2021 Half-year results briefing presentation - To be held on Thursday 18 February 2021 - Wesfarmers ...

Page created by Jimmy Buchanan
 
CONTINUE READING
2021 Half-year results briefing presentation - To be held on Thursday 18 February 2021 - Wesfarmers ...
2021 Half-year results
briefing presentation
To be held on Thursday 18 February 2021
2021 Half-year results briefing presentation - To be held on Thursday 18 February 2021 - Wesfarmers ...
Presentation outline

Item                                       Presenter                 Page

Group performance overview                 Rob Scott                         3

Group balance sheet and cash flow    Anthony Gianotti                     10

Bunnings                            Michael Schneider                     16

Kmart Group                                Ian Bailey                     21

Officeworks                             Sarah Hunter                      27

Chemicals, Energy and Fertilisers         Ian Hansen                      32

Industrial and Safety                        Tim Bult                     37

Group outlook                              Rob Scott                      41

                                                        2021 Half-year results | 2
2021 Half-year results briefing presentation - To be held on Thursday 18 February 2021 - Wesfarmers ...
Group performance overview
Rob Scott
Managing Director, Wesfarmers Limited
2021 Half-year results briefing presentation - To be held on Thursday 18 February 2021 - Wesfarmers ...
Wesfarmers’ primary objective is to provide
a satisfactory return to shareholders

We believe it is only possible to achieve this over the long term by:

Anticipating the needs of our           Looking after our team           Engaging fairly with our
customers and delivering                members and providing a safe,    suppliers and sourcing ethically
competitive goods and services          fulfilling work environment      and sustainably

Supporting the communities              Taking care of the environment   Acting with integrity and honesty
in which we operate                                                      in all of our dealings

                                                                                           2021 Half-year results | 4
2021 Half-year results briefing presentation - To be held on Thursday 18 February 2021 - Wesfarmers ...
Maintaining a long-term focus, consistent with our values

  Anticipating the needs of our           Looking after our team                   Engaging fairly with our
  customers and delivering                members and providing a safe,            suppliers and sourcing ethically
  competitive goods and services          fulfilling work environment              and sustainably

  • Investing to provide greater value,   • Continued to pay team members          • Supporting suppliers by remaining
    service and convenience to              during periods of government-            operational and with measures
    customers                               mandated trading restrictions            around payment terms in cases of
                                                                                     hardship
  • Adjusting processes to provide a      • Increased employment by ~9,500
    safe and trusted environment                                                   • Adjusted ethical sourcing practices
                                          • 800 additional Aboriginal and Torres
                                                                                     to accommodate travel restrictions
  • Strengthening digital capabilities      Strait Islander team members
    to support 125%1 growth in
                                          • 18.1% reduction in Group TRIFR
    online sales
                                            and expanded safety commitments

  Supporting the communities                                                        Acting with integrity and
                                          Taking care of the environment
  in which we operate                                                               honesty in all of our dealings
  • ~$30m in direct and indirect          • Announced new ambitions to             • All actions and decisions continue
    community contributions                 reach net zero emissions by 2030         to be guided by our values and
  • Dedicated services for vulnerable       (retailers) and 2050 (industrials)       long-term objective
    customers needing assistance          • 8% decrease in divisional
    with online channels                    Scope 1 and 2 emissions

1. Excludes Catch.

                                                                                                          2021 Half-year results | 5
2021 Half-year results briefing presentation - To be held on Thursday 18 February 2021 - Wesfarmers ...
Financial overview

 Half-year ended 31 December ($m)                                                             2020     2019                 Var %

 Results from continuing operations excluding significant items1
 Revenue                                                                                     17,774   15,249                   16.6
 EBIT                                                                                         2,171    1,734                   25.2
 EBIT (after interest on lease liabilities)                                                   2,057    1,615                   27.4
 NPAT                                                                                         1,414    1,127                   25.5
 Basic earnings per share (cps)                                                               125.0     99.6                   25.5

 Results including discontinued operations and significant items1
 NPAT                                                                                         1,390    1,210                   14.9
 Basic earnings per share (cps)                                                               122.9    106.9                   14.9
 Interim ordinary dividend (fully-franked, cps)                                                 88       75                    17.3

• Result underpinned by a strong trading performance in the Group’s retail businesses, reflecting their ability to
  adapt to changing customer preferences and provide a safe environment for customers and team members
• WesCEF result reflected a solid operating performance, and Industrial and Safety reported an improvement
  in the performance of Blackwoods
• NPAT excluding significant items up 25.5% to $1,414m
• Interim, fully-franked dividend of 88 cents per share

1. Further detail on significant items and discontinued operations is set out on slide 45.

                                                                                                               2021 Half-year results | 6
2021 Half-year results briefing presentation - To be held on Thursday 18 February 2021 - Wesfarmers ...
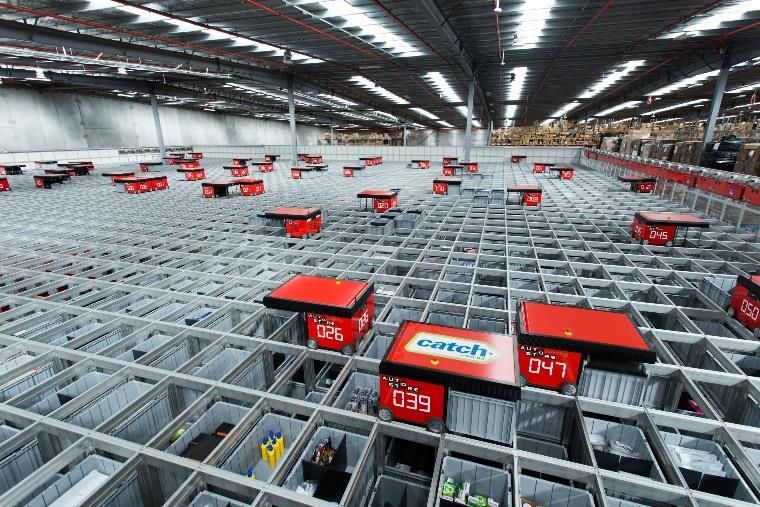
Divisional sales performance

     Sales performance ($m)                                                                                                                          1H20
     Half-year ended 31 December                                                                                                                     1H21

                                                          Retail sales (excludes Catch)1                                 Revenue

 Total sales
                     +24.3%                               +7.1%                  +2.3%        +23.6%         (6.6%)                 +4.7%
    growth
Comp sales
                     +27.7%                               +9.1%                 +13.0%
   growth
                            9,046

                   7,275

                                                      3,417 3,658

                                                                               1,492 1,527   1,226
                                                                                                     1,515
                                                                                                             889   830             858    898

                     Bunnings                             Kmart                  Target      Officeworks     WesCEF           Industrial and Safety
    Online
                       3.1%                               8.7%                   15.9%         37.1%
penetration

    • Strong sales growth in Bunnings and Officeworks due to increased demand for products as customers spent
      more time working, learning and doing projects at home
    • Kmart delivered pleasing sales growth and made progress to improve inventory availability, and Target
      recorded an improvement in sales reflecting good execution and enhancements to the product range
    • Strong growth in online sales of 125%2 for the half to $1.4b, or $2.0b including the Catch marketplace
    1. Refer to slide 51 for relevant retail calendars.
    2. Excludes Catch.
                                                                                                                                    2021 Half-year results | 7
2021 Half-year results briefing presentation - To be held on Thursday 18 February 2021 - Wesfarmers ...
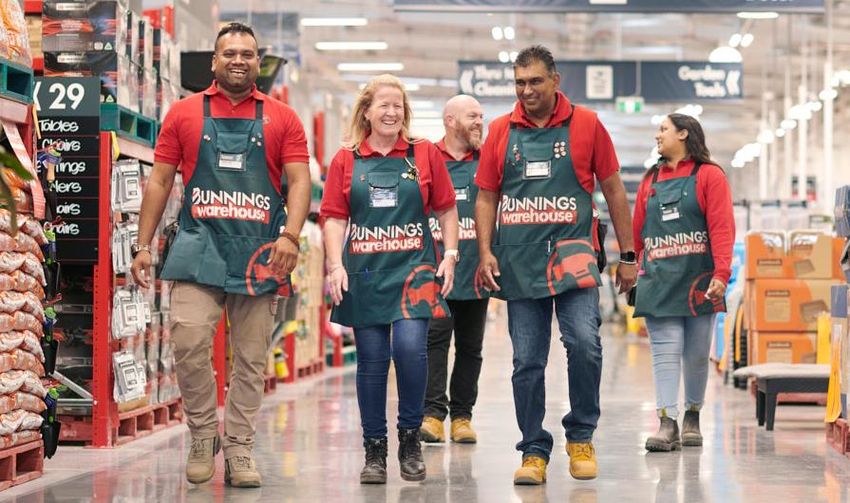
Divisional earnings performance and return on capital

                                                                                           EBT1 ($m)                                                                  RoC2 (R12, %)

 Half-year ended 31 December                                                  2020                   2019             Var (%)                                2020                   2019         Var (ppt)

 Bunnings                                                                     1,274                     938                  35.8                              76.6                     51.5              25.1

 Kmart Group3                                                                    487                    343                  42.0                              35.5                     25.1              10.4

 Officeworks                                                                     100                      82                 22.0                              23.4                     17.2                 6.2

 WesCEF4                                                                         160                    173                  (7.5)                             18.1                     26.7              (8.6)

 Industrial and Safety5                                                            37                       7                n.m.                                5.4                     3.4                 2.0

n.m. = not meaningful
1. Excludes significant items. Further detail on significant items is set out on slide 45.
2. RoC is calculated as EBT / capital employed, where capital employed excludes right-of-use assets and lease liabilities. Further detail on RoC calculations is set out on slide 48.     2021 Half-year results | 8
3. 2019 includes $9m of payroll remediation costs relating to Target.
4. Return on capital excluding ALM for 2020 is 29.0% and for 2019 is 32.0%.
5. 2019 includes $15m of payroll remediation costs.
2021 Half-year results briefing presentation - To be held on Thursday 18 February 2021 - Wesfarmers ...
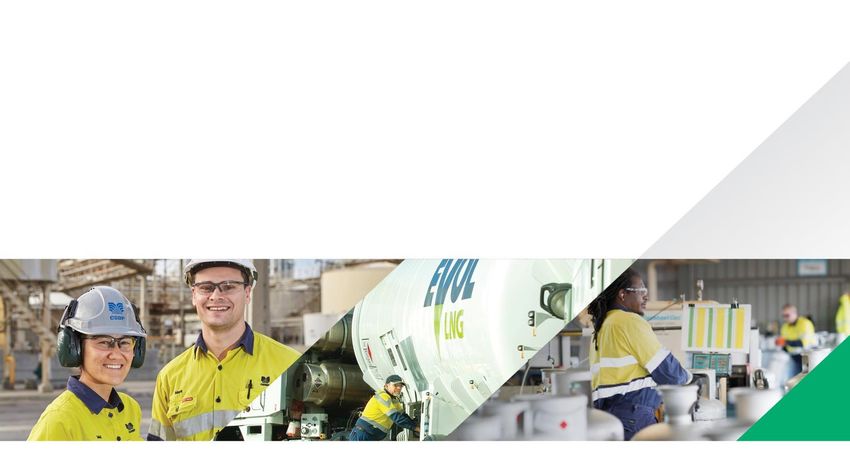
Group performance summary

 Half-year ended 31 December ($m)                                                                                                            2020                            2019                 Var %
 Results from continuing operations1
 Revenue                                                                                                                                 17,774                             15,249                  16.6
 EBIT                                                                                                                                       2,137                            1,734                  23.2
 EBIT (after interest on lease liabilities)                                                                                                 2,023                            1,615                  25.3
 EBIT (after interest on lease liabilities) (excl. significant items)2                                                                      2,057                            1,615                  27.4
 NPAT                                                                                                                                       1,390                            1,127                  23.3
 NPAT (excl. significant items)2                                                                                                            1,414                            1,127                  25.5
 Basic earnings per share (excl. significant items)2 (cps)                                                                                  125.0                             99.6                  25.5
 Results including discontinued operations1
 NPAT from discontinued operations1                                                                                                                 -                          83                   n.m.
 NPAT                                                                                                                                       1,390                            1,210                  14.9
 Operating cash flows                                                                                                                       2,216                            2,131                     4.0
 Net capital expenditure                                                                                                                       243                            207                   17.4
 Free cash flows                                                                                                                            1,964                            1,039                  89.0
 Interim ordinary dividend (fully-franked, cps)                                                                                                  88                            75                   17.3
 Net financial debt / (cash)3                                                                                                               (871)                            2,317                  n.m.
n.m. = not meaningful
1. Further detail on discontinued operations is set out on slide 45.
2. Further detail on significant items is set out on slide 45.                                                                                                                       2021 Half-year results | 9
3. Interest-bearing liabilities less cash at bank and on deposit, net of cross-currency interest rate swaps and interest rate swap contracts. Excludes lease liabilities.
2021 Half-year results briefing presentation - To be held on Thursday 18 February 2021 - Wesfarmers ...
Group balance sheet and cash flow
Anthony Gianotti
Chief Financial Officer, Wesfarmers Limited
Other business performance summary

 Half-year ended 31 December ($m)                                                              Holding %                                 2020                           2019                 Var %

 Share of profit of associates and joint ventures

 Coles1                                                                                                4.9                                       -                        73                     n.m.
 BWP Trust                                                                                            24.8                                    36                          34                       5.9
 Other associates and joint ventures2                                                              Various                                      5                         27                     n.m.

 Sub-total share of profit of associates and joint ventures                                                                                   41                         134                    n.m.

 Interest revenue                                                                                                                               8                          4                     n.m.

 Other3                                                                                                                                       13                           2                     n.m.

 Corporate overheads                                                                                                                       (62)                          (68)                   (8.8)

 Total Other EBIT                                                                                                                                -                        72                    n.m.

 Interest on lease liabilities                                                                                                               (1)                            -                    n.m.

 Total Other EBT                                                                                                                             (1)                          72                    n.m.

n.m. = not meaningful
1. Wesfarmers held a 15% interest in Coles as at 31 December 2019 and sold 10.1% of its interest via two separate transactions on 18 February 2020 and 30 March 2020.
2. Includes investments in Gresham, flybuys, Wespine and BPI.                                                                                                                   2021 Half-year results | 11
3. 2020 includes $18m of dividends received from the Group’s 4.9% interest in Coles. 2019 includes $9m from the Curragh value sharing arrangement.
Working capital and cash flow

• Divisional operating cash flows increased                                                                  Half-year ended 31 December ($m)                          2020              2019
  16.1%1                                                                                                     Working capital cash movement
      – Strong divisional earnings growth                                                                    Receivables and prepayments                                    176                96

      – Ongoing normalisation of working capital                                                             Inventory                                                    (671)           (286)

        positions in retail businesses from FY20                                                             Payables                                                       604              454
                                                                                                             Total                                                          109              264
                – Includes targeted investments to
                  increase stock weights in Kmart                                                            Retail businesses                                              167              385

      – Divisional cash generation of 111%, below                                                            Industrial businesses and Other                                (58)          (121)

        the 1H five-year average of 125%                                                                     Total                                                          109              264

• Group operating cash flows increased 4.0%
      – Timing of tax payments                                                                               %
                                                                                                                                           Divisional cash generation2
                                                                                                            160                       excluding discontinued operations3
• Free cash flows increased significantly                                                                   140                                          1H17 – 1H21 average = 125%

      – Solid operating cash flow result
                                                                                                            120
                                                                                                            100

      – Prior corresponding period includes                                                                  80
                                                                                                             60
        $1.0b in acquisition consideration                                                                   40
        associated with Kidman and Catch                                                                     20
                                                                                                               0
• Group cash realisation ratio4 of 102%                                                                                  1H17                1H18     1H19         1H20                1H21

1.   Before tax after net capital expenditure and repayment of finance leases.
2.   Divisional operating cash flows before tax after net capital expenditure and repayment of finance leases divided by divisional EBT.
                                                                                                                                                                          2021 Half-year results | 12
3.   1H17 to 1H19 includes contributions from KTAS and Quadrant.
4.   Operating cash flows as a percentage of net profit after tax, before depreciation, amortisation and significant items.
Capital expenditure

• Gross capital expenditure of $410m                    Half-year ended
                                                        31 December1 ($m)           2020    2019         Var %
    – Increased investment in data and digital
      capabilities in all divisions                     Bunnings                     219       269         (18.6)
    – The successful conversion of 19 Target stores
      to Kmart stores, including 12 large formats       Kmart Group                   81         80             1.3

    – Lower new store and refurbishment capex in
                                                        Officeworks                   26         22          18.2
      Bunnings and Kmart Group, partly due to the
      timing of projects
                                                        WesCEF                        53         50             6.0
• Increase in net capital expenditure primarily due
  to lower proceeds from Bunnings property              Industrial and Safety         30         33          (9.1)
  disposals of $167m (1H20: $224m)
• FY21 net capital expenditure of                       Other                          1           1               -
  $650m to $800m expected, subject to net
  property investment                                   Gross capital expenditure    410       455           (9.9)

    – Inclusive of the conversion of Target stores to
                                                        Sale of PP&E                (167)   (248)          (32.7)
      Kmart stores and purchase of long lead items
      for the development of the Mt Holland project
                                                        Net capital expenditure      243       207           17.4

1. Capital investment provided on a cash basis.

                                                                                            2021 Half-year results | 13
Balance sheet and debt management
• Maintained significant balance sheet flexibility
                                                                                                                                                    Debt maturity profile2
• Net        cash1
           position of $871m as at                                                                                  $m
                                                                                                                   1,200
  31 December 2020, compared to net cash of
  $471m as at 30 June 2020                                                                                               0

    – Solid operating cash flow performance                                                                      (1,200)

    – Repayment of $500m in domestic bonds                                                                       (2,400)

• Other finance costs decreased 13.0% to $60m in                                                                 (3,600)
                                                                                                                                        FY21                          FY22                     FY23
  1H21 (1H20: $69m) due to lower average debt
                                                                                                                                              Capital markets                  Cash and equivalents
  balances

    – Weighted average cost of debt increased to
      4.38% (1H20: 4.25%) due to a shift in the mix of                                                                                    Other finance costs and
                                                                                                                      $m                                                                                       %
                                                                                                                                       weighted average cost of debt3
      debt towards higher cost bonds                                                                                 160                                                                                        5.0
                                                                                                                     140
                                                                                                                                                                                                                4.0
    – Additional costs incurred due to undrawn facility                                                              120
                                                                                                                     100                                                                                        3.0
      fees on the $1.95b extension of committed bank                                                                  80
                                                                                                                                                                                                                2.0
      debt completed in FY20                                                                                          60
                                                                                                                      40
                                                                                                                                                                                                                1.0
                                                                                                                      20
• Strong credit metrics and stable credit ratings                                                                        -                                                                                      0.0
                                                                                                                                 1H17              1H18             1H19          1H20            1H21
    – Moody’s A3 (stable outlook)                                                                                                  Finance costs [LHS]                Weighted average cost of debt [RHS]

    – Standard & Poor’s A- (stable outlook)
1. Interest-bearing liabilities less cash at bank and on deposit, net of cross-currency interest rate swaps and interest rate swap contracts. Excludes lease liabilities.
2. As at 31 December 2020.
3. Weighted average cost of debt based on total gross debt before hedging costs, undrawn facility fees and amortisation of debt establishment costs.                                     2021 Half-year results | 14
Dividends

• Fully-franked half-year ordinary dividend of                                                Dividends1
  $0.88 per share
                                                          $/share                                   Demerger of Coles
    – Reflects strong underlying NPAT result              3.50
                                                                                                       Nov 2018
                                                          3.00                                      2.78
• Dividend record date 24 February 2021;                  2.50         2.23            2.23
                                                                                                    1.00
                                                          2.00                                                  1.70
  dividend payable 31 March 2021                          1.50         1.20            1.20                     0.18
                                                                                                    0.78                          0.88
                                                          1.00                                                  0.77
• Dividend investment plan: not underwritten;             0.50         1.03            1.03         1.00        0.75              0.88
                                                             -
  last day for application 25 February 2021                           FY17             FY18         FY19       FY20              1H21

    – Dividend investment plan shares                               Interim dividend          Final dividend      Special dividend

      expected to be purchased on market

• Dividend distributions determined based on
  franking credit availability, earnings, credit
  metrics and cash flow
    – Maximising value of franking credits for
      shareholders

1. Represents dividends resolved to pay in each period.

                                                                                                                        2021 Half-year results | 15
Bunnings
Michael Schneider
Managing Director, Bunnings Group
Bunnings performance summary

 Half-year ended 31 December ($m)                                                                                            2020    2019               Var %
 Revenue                                                                                                                     9,054   7,276                 24.4
 EBITDA                                                                                                                      1,669   1,316                 26.8
 Depreciation and amortisation                                                                                               (337)   (321)                 (5.0)
 EBIT                                                                                                                        1,332    995                  33.9
 Interest on lease liabilities                                                                                                (58)    (57)                 (1.8)
 EBT                                                                                                                         1,274    938                  35.8
 Net property contribution                                                                                                      1      22                  n.m.
 EBT (excluding net property contribution)                                                                                   1,273    916                  39.0
 EBT margin excluding property (%)                                                                                            14.1    12.6
 RoC1 (R12, %)                                                                                                                76.6    51.5
 Total store sales growth2 (%)                                                                                                24.8     5.8
 Store-on-store sales growth2 (%)                                                                                             27.7     4.7
 Online penetration (%)                                                                                                        3.1     0.4
 Safety (R12, TRIFR)                                                                                                          10.0    10.4
 Scope 1 and 2 emissions (ktCO2e)                                                                                             115     130

n.m. = not meaningful
1. RoC is calculated as EBT / capital employed, where capital employed excludes right-of-use assets and lease liabilities.
2. Refer to slide 51 for relevant retail calendars.                                                                                          2021 Half-year results | 17
Bunnings sales and earnings overview

• Revenue growth of 24.4% to $9,054m

  – Total store sales growth of 24.8%
  – Store-on-store sales growth of 27.7%
  – Strong growth across all product categories
    and major trading regions
  – Particularly strong growth in garden and
    outdoor living
  – Online penetration increased to 3.1% for
    the half
• Earnings increased 35.8% to $1,274m

• Earnings excluding net property contribution
  increased 39.0%

  – $16m of additional costs in cleaning, additional
    security and PPE for team members
  – Continued focus on investments in customer
    experience for long-term growth
• RoC (R12) increased to 76.6%

                                                       2021 Half-year results | 18
Bunnings progress on strategy

• Investing in customer experience
 – Investment in lower prices across a wide number
   of categories and products
 – 6,000 additional team members to service
   increased demand
 – Product display upgrades and refreshed ranges
• Development of the digital agenda
 – Ongoing enhancements to website functionality
 – Increased online access to product ranges
 – Enhancements to Product Finder app for
   customer convenience
• Stronger commercial customer relationships
 – Expanded supply and install product offer for
   builders
 – New trade service desk format
 – More trailer parking spaces
 – Increased PowerPass app functionality and
   engagement with a five-times increase in
   transactions via the app to over one million (R12)

                                                        2021 Half-year results | 19
Bunnings outlook

• Outlook remains uncertain

• Trading performance expected to continue to
  benefit from consumers continuing to spend more
  time at home

• Sales and earnings growth likely to moderate from
  March as the business begins to cycle the initial
  impacts of COVID-19 in the prior year

• Continued investment in additional cleaning,
  security and PPE in response to COVID-19

• Continued focus on long-term investments

  – Digital capabilities
  – Broadening commercial markets
  – Strengthening both in-store and online offer
• Ongoing store network expansion

  – Five warehouses and one smaller format store
    under construction due to open in the second half

                                                        2021 Half-year results | 20
Kmart Group
Ian Bailey
Managing Director, Kmart Group
Kmart Group performance summary

  Half-year ended 31 December ($m)1                                                                                                           2020                            2019                  Var %
  Revenue                                                                                                                                     5,441                       4,990                           9.0
  EBITDA2                                                                                                                                        818                           696                     17.5
  Depreciation and amortisation                                                                                                               (283)                           (292)                       3.1
  EBIT2                                                                                                                                          535                           404                     32.4
  Interest on lease liabilities                                                                                                                 (48)                           (52)                       7.7
  EBT2                                                                                                                                           487                           352                     38.4
  EBT including payroll remediation costs                                                                                                        487                           343                     42.0
  Significant items                                                                                                                             (34)                              -                    n.m.
  EBT including significant items                                                                                                                453                           343                     32.1
  EBT margin2 (%)                                                                                                                                 9.0                           7.1
  RoC3 (R12, %)                                                                                                                                 35.5                          25.1
  Safety (R12, TRIFR)                                                                                                                           10.6                          16.0
  Scope 1 and 2 emissions (ktCO2e)                                                                                                               143                           154

n.m. = not meaningful
1. 2019 includes Catch from 12 August 2019.
2. 2020 excludes $34m of pre-tax significant items. 2019 excludes $9m of payroll remediation costs relating to Target.
3. RoC is calculated as EBT / capital employed, where capital employed excludes right-of-use assets and lease liabilities. Earnings excludes significant items and includes           2021 Half-year results | 22
   payroll remediation costs.
Kmart and Target performance overview

• Revenue growth of 5.7% to $5,112m                                                                           Half-year ended
                                                                                                              31 December ($m)               2020    2019           Var %
    – Kmart comparable sales growth of 9.1%
    – Target comparable sales growth of 13.0%                                                                 Revenue                        5,112   4,835               5.7

    – Very strong growth in online                                                                            EBITDA1                         822      685             20.0

                                                                                                              EBT1                            502      348             44.3
• Earnings growth of 44.3% to $502m
                                                                                                              Kmart:
• Kmart delivered strong earnings growth
                                                                                                              Total sales growth2 (%)          7.1      7.6
    – Higher sales and lower clearance costs
                                                                                                              Comparable sales growth2 (%)     9.1      5.5
    – Partially offset by increased online fulfilment
                                                                                                              Online penetration (%)           8.7      3.7
      costs, higher shrinkage and higher ocean
      freight charges                                                                                         Target:

• Target’s profitability improved significantly                                                               Total sales growth2 (%)          2.3    (4.3)

    – Strong sales growth                                                                                     Comparable sales growth2 (%)    13.0    (2.3)
    – Higher proportion of full-price sales                                                                   Online penetration (%)          15.9      6.9
    – Lower operating costs

• Temporary store closures and additional in-store
  cleaning, PPE and security costs due to
  COVID-19

1. 2020 excludes $34m of pre-tax significant items. 2019 excludes $9m of payroll remediation costs relating to Target.
2. Refer to slide 51 for relevant retail calendars.
                                                                                                                                                     2021 Half-year results | 23
Kmart and Target progress on strategy

• Kmart continued to invest in initiatives to enhance its
  customer offer, including new in-store retail technology
  and the development of data and digital capabilities

• Good progress on actions to accelerate the growth of
  Kmart and optimise the Target store network
  – 12 large format Target stores converted to Kmart
  – Seven Target Country stores converted to the new
    K Hub small format

• Encouraging customer feedback and initial trading
  results from converted stores

• Successfully redeployed a significant number of store
  and support office team members across the
  Wesfarmers Group

• Target has focused on simplifying the business,
  prioritising online growth and improving the product
  offer

                                                             2021 Half-year results | 24
Catch performance overview

• Strong growth across both the in-stock and marketplace                                                               Half-year ended 31
  segments                                                                                                             December ($m)1                                    2020          2019

    – Gross transaction value growth of 95.6%                                                                          Gross transaction value                             610           255

                                                                                                                       Revenue                                             329           155
• Accelerated investment in marketing and capability
    – Active customers increased by 0.6m during the half,                                                              EBITDA                                               (4)            11
      with a total of 2.9m active customers at                                                                         EBT2                                               (15)               4
      31 December 2020
                                                                                                                       Gross transaction value growth3 (%)                95.6          21.4
    – Investments in automation and fulfilment capacity
    – Broadened range of categories and brands available
      for both the in-stock and marketplace segments

• Implemented a number of customer-driven initiatives
    – Click and Collect available for Catch products in a
      number of Target and Kmart stores
    – Introduced Target to Catch marketplace and Kmart
      products to Catch’s in-stock range
    – Joined flybuys as loyalty partner

1. 2019 includes Catch from 12 August 2019. Variance not shown due to different period of ownership between 2020 and 2019.
2. Includes an amortisation expense in 2020 and 2019 of $5m and $4m, respectively, relating to assets recognised as part of the acquisition.
3. 2020 gross transaction value growth reflects the period 1 July 2020 to 31 December 2020 and 1 July 2019 to 31 December 2019. 2019 gross transaction value growth   2021 Half-year results | 25
   reflects the period 12 August 2019 to 31 December 2019 and 12 August 2018 to 31 December 2018.
Kmart Group outlook

• In an uncertain and volatile environment, Kmart Group is
  well-positioned for the future

• Current global supply chain disruptions expected to continue

• Kmart will continue to focus on investing for future growth
  – Accelerating development of new technology capabilities
    and optimising supply chain and online fulfilment
  – Planned conversion of 19 large format Target stores and
    46 Target Country stores in the second half

• Target will continue to focus on accelerating online growth
  and improving the product offer
  – Now expected to be profitable for the full financial year
    before one-off costs

• Catch will continue to invest in growing gross transaction
  value through customer acquisition
  – Further investment in marketing, technology and fulfilment
    capacity

• FY21 one-off non-operating costs of approximately $90m to
  $110m relating to Target store closures and conversions

                                                                 2021 Half-year results | 26
Officeworks
Sarah Hunter
Managing Director, Officeworks
Officeworks performance summary

 Half-year ended 31 December ($m)                                                                                            2020    2019                 Var %
 Revenue                                                                                                                     1,523   1,231                    23.7
 EBITDA                                                                                                                       156     137                     13.9
 Depreciation and amortisation                                                                                                (51)    (48)                   (6.3)
 EBIT                                                                                                                         105      89                     18.0
 Interest on lease liabilities                                                                                                 (5)     (7)                    28.6
 EBT                                                                                                                          100      82                     22.0
 EBT margin (%)                                                                                                                6.6     6.7
 RoC1 (R12, %)                                                                                                                23.4    17.2
 Total sales growth2 (%)                                                                                                      23.6    11.5
 Online penetration (%)                                                                                                       37.1    29.7
 Safety (R12, TRIFR)                                                                                                           7.3     7.1
 Scope 1 and 2 emissions (ktCO2e)                                                                                              20      22

1. RoC is calculated as EBT / capital employed, where capital employed excludes right-of-use assets and lease liabilities.
2. Refer to slide 51 for relevant retail calendars.
                                                                                                                                             2021 Half-year results | 28
Officeworks sales and earnings overview

• Sales growth of 23.6%
                                                              %                       Sales growth momentum
 – Every-channel offer continues to deliver strong sales      30                                                                       28.5

   growth in stores and online                                25                                                                                23.6

 – Online sales penetration approximately 37%, including      20
   Click and Collect sales                                    15
                                                                                                                               11.5
 – Increased demand for technology and home office            10
                                                                    9.1                           9.7
                                                                                                         8.5     8.2
                                                                           7.0             6.3                          7.1
   products as customers established, maintained and                               5.9
                                                               5
   upgraded their working and learning spaces at home
                                                               0
 – Solid demand for early learning and art & craft products

                                                                    1H16

                                                                           2H16

                                                                                    1H17

                                                                                           2H17

                                                                                                  1H18

                                                                                                          2H18

                                                                                                                 1H19

                                                                                                                        2H19

                                                                                                                                1H20

                                                                                                                                        2H20

                                                                                                                                                 1H21
• Earnings growth of 22.0%
 – Gross margins impacted by sales mix changes and             $m
                                                                                  Strong earnings and RoC growth
                                                                                                                                                     %
   continued price investment                                 200                                                                          23.4       25
                                                              175
 – Increased online fulfilment costs due to additional        150
                                                                                                                                                        20

   resources required to support peak demand                  125                                                                                       15
                                                              100
 – Additional costs incurred to ensure COVID-safe              75    5.7                                                                                10
                                                               50                                                                              100
   operations                                                  25                      50 59 62
                                                                                                68 76 82                                                5
                                                                     25 27 32 34 38 42
                                                                0                                                                                       0
• RoC (R12) of 23.4%
 – Strong earnings growth combined with a disciplined                      1H EBT [LHS]                  2H EBT [LHS]                  RoC [RHS]

   approach to cost and capital management

                                                                                                                          2021 Half-year results | 29
Officeworks progress on strategy

Our team
 – Continued focus on the safety, health and wellbeing of
   the team
Customer experience
 – Investment in data analytics capabilities to improve
   marketing and increase the personalisation of
   communications with customers
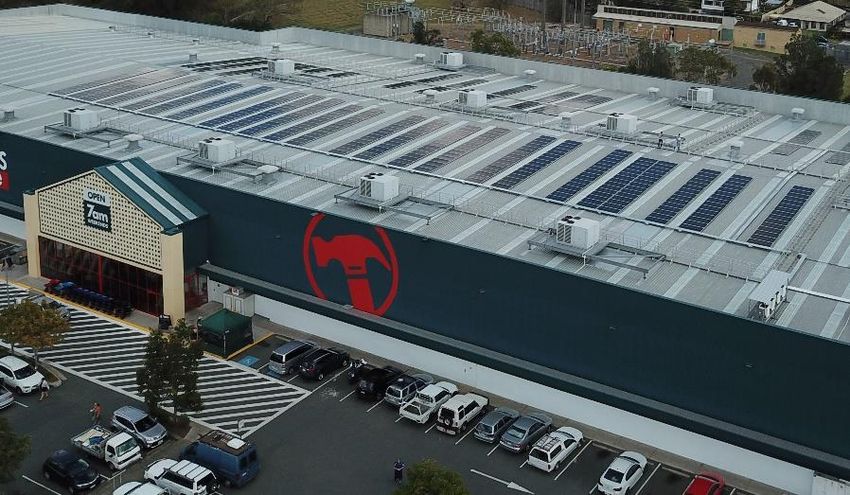
 – New and expanded product ranges
Connecting with our communities
 – Over $3m donated to community groups
 – Scope 1 and 2 emissions reduced by 10%
Operational excellence
 – Improvements in supply chain capacity across all
   channels
Growing our business
 – Investment in every-channel offer to meet changing
   customer needs
 – Opened two new stores

                                                            2021 Half-year results | 30
Officeworks outlook

• Outlook is uncertain but Officeworks remains
  well-positioned for the future
• Sales and earnings growth likely to moderate from
  March as the business begins to cycle the initial
  impacts of COVID-19 in the prior year
• Execution of strategy to drive long-term growth
  – Investment in team member safety, health and
    wellbeing programs
  – Investing in online enhancements and store layouts
    and design
  – Further investment in data and digital capabilities
  – Enhancing supply chain capacity and increased use
    of technology
  – Continued investment in Print, Copy & Create online
    and in store
  – Expanding Officeworks’ presence in the education
    and business-to-business segments
• Focus on supporting the communities where we work
  and live, and reducing our environmental impact

                                                          2021 Half-year results | 31
Chemicals, Energy and Fertilisers
Ian Hansen
Chief Executive Officer, Wesfarmers Chemicals, Energy and Fertilisers
Chemicals, Energy and Fertilisers performance summary

 Half-year ended 31 December ($m)1                                                                                                          2020             2019                 Var %

 Revenue2                                                                                           Chemicals                                 489             510                   (4.1)
                                                                                                          Energy                              206             219                   (5.9)
                                                                                                      Fertilisers                             135             160                 (15.6)
                                                                                                             Total                            830             889                   (6.6)
 EBITDA                                                                                                                                       202             214                   (5.6)
 Depreciation and amortisation                                                                                                                (42)           (41)                   (2.4)
 EBIT                                                                                                                                         160             173                   (7.5)
 Interest on lease liabilities                                                                                                                     -            -                          -
 EBT                                                                                                                                          160             173                   (7.5)
 External sales volumes3 ('000 tonnes)                                                              Chemicals                                 550             568                   (3.2)
                                                                                                  LPG & LNG                                    115            103                    11.7
                                                                                                      Fertilisers                             274             324                 (15.4)
 RoC4 (R12, %)                                                                                                                               18.1            26.7
 RoC4 (R12, %) (excluding ALM)                                                                                                               29.0            32.0
 Safety (R12, TRIFR)                                                                                                                           3.2            3.1
 Scope 1 and 2 emissions (ktCO2e)                                                                                                             455             493

1.   2019 includes Australian Light Minerals, the holding company for WesCEF’s 50% interest in the Covalent Lithium joint venture, from 23 September 2019.
2.   Excludes intra-division sales.
3.   External sales exclude AN volumes transferred between Chemicals and Fertilisers business segments.                                                             2021 Half-year results | 33
4.   RoC is calculated as EBT / capital employed, where capital employed excludes right-of-use assets and lease liabilities.
Mt Holland lithium project Final Investment Decision

• Wesfarmers together with 50:50 JV partner, SQM,                      Overview of Mt Holland lithium project
  approved the final investment decision (FID) for the
  Mt Holland lithium project
• Provides new growth opportunity for WesCEF
    – Capitalises on strong chemical processing capabilities
    – Builds on track record of successfully delivering plant
      development and expansion projects
                                                                                Mine site includes Earl Grey lithium deposit:
                                                                                • Resources: 189Mt @ 1.5% Li2O (7.0Mt of
• FID follows completion of an updated definitive feasibility                     lithium carbonate equivalent)
  study (UDFS) over the past 12 months                                          • Reserves: 94Mt @ 1.5% Li2O)

    – Greater certainty on engineering design                                  PERTH
                                                                                                              KALGOORLIE

    – Concentrator and refinery production capacity increase          Proposed
                                                                                          Mine site       Proposed
                                                                      refinery           MT HOLLAND       concentrator
      from ~45ktpa to ~50ktpa of sustainably-sourced
      battery-grade lithium hydroxide
    – Capacity for second phase expansion
                                                                Proposed lithium hydroxide
• Wesfarmers’ expected share of total project capital           refinery:
                                                                • Located in Kwinana industrial
  expenditure estimated at approximately $950m1                   area                                  Proposed spodumene
                                                                                                        concentrator:
                                                                • Capable of producing ~50ktpa
                                                                  battery-grade lithium hydroxide       • Produces spodumene
• Indicative construction timeline, subject to approvals:         for export globally                     concentrate for use in lithium
                                                                                                          hydroxide refinery
                                                                • Flexibility for second phase
    – Project construction to commence: 2H CY21                   expansion

    – First production from refinery: 2H CY24
CY = calendar year
1. Real 2021 terms.
                                                                                                                      2021 Half-year results | 34
Chemicals, Energy and Fertilisers overview

• Revenue of $830m down 6.6%, driven by a combination of lower Chemicals and Fertilisers sales
  volumes and lower energy prices (Saudi CP1)
• Earnings of $160m down 7.5% impacted by lower AN2 sales and weaker export demand in the sodium
  cyanide business
• Chemicals: Solid result, earnings down on prior corresponding period
   – As expected, earnings impacted by additional supply from a competitor AN plant in the Burrup
   – Burrup impact moderated by strong AN demand and CSBP’s contracted positions
   – Weakened sodium cyanide export demand driven by international gold mine closures due to
     COVID-19
   – Ammonia earnings marginally down due to a planned two-week plant maintenance shutdown
   – Increased input costs across most Chemicals businesses due to temporary supply chain disruptions
• Energy: Earnings slightly lower than prior corresponding period
   – Lower Saudi CP impacted LPG earnings, partially offset by higher LPG export sales volumes and an
     increase in natural gas residential usage
• Fertilisers: Earnings down on prior corresponding period
   – Lower sales volumes due to a moderate end of season compared to late seasonal rains in the prior
     corresponding period
   – Continued investment in customer services and differentiated offerings

1. Saudi Contract Price (the international benchmark indicator for LPG).
2. Ammonium nitrate.
                                                                                           2021 Half-year results | 35
Chemicals, Energy and Fertilisers outlook

• Production and demand for AN expected to remain stable
• Weaker sodium cyanide export demand is expected to continue, driven by ongoing disruption to
  international gold mines due to COVID-19
• The sodium cyanide business is investigating opportunities to expand production, supported by
  expected growth in global demand for gold
• Kleenheat earnings expected to benefit from increased LPG sales due to closure of the BP Refinery
  in Kwinana from FY22
• Kleenheat natural gas retailing business remains focused on continuing its market-leading
  customer service
• Fertilisers earnings may be impacted by increased competitive pressures in the Western Australian
  fertiliser market
• Earnings will continue to be impacted by international commodity prices, exchange rates,
  competitive factors and seasonal outcomes

                                                                                             2021 Half-year results | 36
Industrial and Safety
Tim Bult
Managing Director, Wesfarmers Industrial and Safety
Industrial and Safety performance summary

  Half-year ended 31 December ($m)                                                                                                           2020                        2019                      Var %
  Revenue                                                                                                                                       898                         858                          4.7
  EBITDA1                                                                                                                                         76                          61                       24.6
  Depreciation and amortisation                                                                                                                (37)                        (36)                       (2.8)
  EBIT1                                                                                                                                           39                          25                       56.0
  Interest on lease liabilities                                                                                                                  (2)                         (3)                       33.3
  EBT1                                                                                                                                            37                          22                       68.2
  EBT including payroll remediation costs                                                                                                         37                            7                     n.m.
  EBT margin1 (%)                                                                                                                                4.1                         2.6
  RoC2 (R12, %)                                                                                                                                  5.4                         3.4
  Safety (R12, TRIFR)                                                                                                                            4.5                         4.1
  Scope 1 and 2 emissions (ktCO2e)                                                                                                                13                          14

n.m. = not meaningful
1. 2019 excludes $15m of payroll remediation costs.
2. RoC is calculated as EBT / capital employed, where capital employed excludes right-of-use assets and lease liabilities. 2019 earnings include $15m of payroll remediation costs.   2021 Half-year results | 38
Industrial and Safety overview

• Industrial and Safety businesses continued to support customers in response to COVID-19
    – Sourcing critical products including respiratory, cleaning and hygiene products
    – Ensuring critical oxygen supply to hospital groups
    – Providing additional risk consulting services
• Revenue of $898m, up 4.7%
    – Blackwoods revenue increased due to continued growth from strategic customers and strong
      demand for critical products in the first quarter, partially offset by weakness in the coal mining,
      oil and gas, and manufacturing sectors
    – Investment to date to improve Blackwoods’ operational execution supported the reliable supply of
      products despite COVID-19 related shipping disruptions
    – Coregas revenue increased due to higher demand from industrial and healthcare customers,
      reflecting investment in the product offerings for these segments in recent years

• Earnings increased to $37m, up 68.2%
    – Blackwoods earnings growth supported by higher sales and cost improvement initiatives, partially
      offset by continued investment in customer service and digital capabilities (including ERP1)
    – Workwear Group earnings in line with prior corresponding period with lower revenue from uniforms
      as a result of the impact of COVID-19 (airlines, retail, hospitality), partially offset by revenue growth
      from the industrial workwear brands (KingGee and Hard Yakka) and operating efficiencies
    – Coregas earnings increased due to revenue growth and improved sourcing costs
1. Enterprise resource planning.

                                                                                                   2021 Half-year results | 39
Industrial and Safety outlook

• Market conditions are expected to remain uncertain and challenging for the remainder of FY21
• Blackwoods continues to focus on improving the customer value proposition
  – Build on improvements to its core operational capabilities
  – Progress the implementation of the ERP system

• Workwear Group will continue to be impacted by COVID-19
  – Continued focus on growth from key brands, cost improvement initiatives and investment in its digital
    offering

• Customer demand in Coregas is expected to remain stable, with continued strength in healthcare and
  industrial segments offset by some weakness in other sectors and ongoing competitive pressures

                                                                                            2021 Half-year results | 40
Group outlook
Rob Scott
Managing Director, Wesfarmers Limited
Outlook

• Economic conditions in Australia have recovered strongly and the outlook is more positive, subject to
  future COVID-19 risks
• Sales across the Group’s retail businesses have continued to remain strong through January and
  February, with some impact from government-mandated trading restrictions
• Customers spending more time at home while COVID-19 restrictions remain is likely to support higher
  demand across the Group’s retail businesses
• Retail sales growth is expected to moderate from March as the businesses begin to cycle the initial
  impacts of COVID-19 in the prior year, particularly in Bunnings and Officeworks
• Additional costs of approximately $10m per quarter to provide a COVID-safe environment
• Wesfarmers’ portfolio of cash-generative businesses with trusted brands and leading market positions
  is well-placed to deliver satisfactory shareholder returns over the long term
• Retail businesses will maintain their focus on meeting changing customer needs and delivering even
  greater value, quality and convenience for customers
• Performance of the Group’s industrial businesses will continue to be subject to international commodity
  prices, foreign exchange rates, competitive factors and seasonal outcomes
• Wesfarmers will continue to manage the portfolio with deep carbon awareness, actively considering
  climate change risk in the context of key business decisions
• The Group will continue to develop and enhance its portfolio, building on its unique capabilities and
  platforms to take advantage of growth opportunities within existing businesses and to pursue
  investments and transactions that create value for shareholders over the long term

                                                                                             2021 Half-year results | 42
Questions
Appendix: Supplementary information
Significant items and discontinued operations summary

Half-year ended 31 December 2020 ($m)                               Pre-tax          Tax impact             Post-tax

Restructuring costs in Kmart Group                                      (34)                  10                      (24)

Total significant items                                                 (34)                  10                      (24)

Half-year ended 31 December 2019 ($m)                               Pre-tax          Tax impact             Post-tax

Capital losses in BUKI (disposed in June 2018)                             -                  84                        84

True-up of tax base in Coles                                               -                  10                        10

True-up of tax on sale of Bengalla                                         -                 (11)                     (11)

Total significant items and discontinued operations                        -                  83                        83

• As previously announced, significant items recorded during the half relate to Target store closure and
  conversion costs as part of restructuring actions in Kmart Group
• Significant items in the prior corresponding period relate to discontinued operations and primarily comprise
  the recognition of tax losses relating to the BUKI business which was divested in June 2018

                                                                                                    2021 Half-year results | 45
Group management balance sheet

 ($m)1                                                                        1H21                  FY20                 1H20 Commentary (versus 1H20)
 Inventories                                                                   4,516                3,844                4,578
 Receivables and prepayments                                                   1,024                1,261                1,124
                                                                                                                                          • Increase due to higher purchases in Bunnings,
 Trade and other payables                                                   (4,520)              (4,008)               (4,130)              Kmart Group and Officeworks

 Other                                                                            160                  172                   150
 Net working capital                                                           1,180                1,269                1,722
                                                                                                                                          • Decrease due to store network impairment in
 Property, plant and equipment                                                 3,478                3,623                3,919              Target in FY20 and property divestments in
                                                                                                                                            Bunnings
 Mineral rights                                                                   829                  813                   801
                                                                                                                                          • Decrease due to Industrial and Safety, and
 Intangibles                                                                   3,867                3,814                4,285              Target impairments in FY20
                                                                                                                                          • Decrease due to sale of the Group’s 10.1%
 Other assets                                                                  1,688                1,804                3,430              interest in Coles
                                                                                                                                          • Increase due to restructuring provisions in Kmart
 Provisions and other liabilities                                           (1,610)              (1,698)               (1,447)              Group, higher store make-good estimates and
                                                                                                                                            employee benefits
 Total capital employed2                                                       9,432                9,625              12,710
                                                                                                                                          • Decrease due to solid operating cash flow
 Net financial (debt) / cash3                                                     871                  471             (2,317)              performance and sale of the Group’s 10.1%
                                                                                                                                            interest in Coles
 Net tax balances                                                                 376                  278                   288

 Net right-of-use asset / (lease liability)                                 (1,068)              (1,030)                  (957)

 Total net assets                                                              9,611                9,344                9,724

1. Balances reflect the management balance sheet, which is based on different classification and groupings from the balance sheet in the Appendix 4D.
2. Capital employed excludes right-of-use assets and lease liabilities.
3. Interest-bearing liabilities less cash at bank and on deposit, net of cross-currency interest rate swaps and interest rate swap contracts. Excludes lease liabilities.   2021 Half-year results | 46
   Net cash position expressed as a positive.
Management of lease portfolio

• Lease liabilities totalled $7.3b and represent                                                      ($m)                                                    1H21               FY20               1H20
  82% of Group fixed financial obligations as at
                                                                                                      Bunnings                                                 3,822              3,727             3,873
  31 December 2020
                                                                                                      Kmart Group                                              2,875              2,943             3,136
• The ongoing store closures and conversion
  program within Target has supported a ~14%                                                          Officeworks                                                 342                  343                368
  reduction in its lease liabilities since FY20                                                       WesCEF                                                         27                 27                30

                                                                                                      Industrial and Safety                                       160                  167                177
• Average remaining lease tenure of 4.7 years1
  (FY20: 4.8 years)                                                                                   Other                                                          34                 35                37

    – Complemented by strategic extension                                                             Total lease liabilities                                  7,260              7,242             7,621

      options to maintain security of tenure
                                                                                                                      Weighted average lease terms (%)1
    – Reflects disciplined management of leases                                                                                                                                  Post AASB 16
      in retail businesses
                                                                                                              2.2             1.7              0.6             0.3               0.3               0.3
                                                                                                                                               6.8             5.3               4.5               4.2
• Approach to lease portfolio management                                                                      12.3            12.1
                                                                                                                                                              31.3               30.9              30.0
  unchanged by AASB 16                                                                                        32.3            32.3
                                                                                                                                              32.9

    – Continued focus on lease-adjusted return
      on capital as a key hurdle for divisions                                                                53.2            53.9            59.7            63.1               64.3              65.5

                                                                                                             FY17            FY18            FY19            FY20            FY20              1H21

                                                                                                                       15 years

1. Post AASB 16 lease tenure calculated as weighted average of undiscounted dollar commitments by year including non-property leases and reasonably certain extension options.
   Pre AASB 16 lease tenure calculated as weighted average of undiscounted dollar commitments by year.
                                                                                                                                                                                   2021 Half-year results | 47
Divisional return on capital

 Rolling 12 months to
 31 December                                                             2020                           2019
                                                       EBT            Cap Emp1          RoC    EBT     Cap Emp1    RoC                      Var
                                                        ($m)                     ($m)    (%)    ($m)        ($m)    (%)                    (ppt)

 Bunnings                                            2,162                      2,823   76.6   1,632       3,171   51.5                    25.1

 Kmart Group2                                            554                    1,561   35.5    500        1,990   25.1                    10.4

 Officeworks                                             215                     918    23.4    173        1,004   17.2                      6.2

 WesCEF3                                                 381                    2,109   18.1    421        1,579   26.7                   (8.6)

 Industrial and Safety4                                    69                   1,269    5.4     51        1,482    3.4                      2.0

1.   Capital employed excludes right-of-use assets and lease liabilities.
2.   2019 includes $9m of payroll remediation costs relating to Target.
3.   Return on capital excluding ALM for 2020 is 29.0% and for 2019 is 32.0%.                                             2021 Half-year results | 48
4.   2019 includes $15m of payroll remediation costs.
Retail store networks
As at 31 December 2020

                  More than 1,000 locations across Australia and New Zealand

Brand                    NSW/ACT   VIC    QLD      SA     WA     TAS     NT     NZ            Total

Bunnings
 Warehouse                    79    61      50     18      30      7      3      28              276
 Smaller format               19    14      13      3       9      -      -      12               70
 Trade                         7     3       7      2       3      1      -       7               30
 Adelaide Tools                -     -       -      6       -      -      -       -                6
Total Bunnings               105    78      70     29      42      8      3      47              382

Kmart Group
 Kmart                        62    58      50     16      31      5      3      24              249
 K Hub                         -     7       -      -       -      -      -       -                7
 Target – large format        51    43      35     14      16      5      2       -              166
 Target – small format        32    16      26      7       9      1      1       -               92
Total Kmart Group            145   124     111     37      56     11      6      24              514

Officeworks                   57     51     30     10      17      2      1          -           168

                                                                               2021 Half-year results | 49
Revenue reconciliation – Kmart Group

 Half-year ended 31 December1 ($m)                                      2020                   2019

 Segment revenue (Gregorian)                                            5,441                 4,990

 Less: Non-sales revenue                                                 (35)                    (33)

 Headline sales (Gregorian)                                             5,406                 4,957

 Add: Gregorian adjustment2                                              100                      102

 Headline sales revenue (Retail)3                                       5,506                 5,059

1. 2019 includes Catch from 12 August 2019.
2. Adjustment to headline sales revenue to reflect retail period end.
3. Refer to slide 51 for relevant retail calendars.                             2021 Half-year results | 50
Retail calendars

Business                                           Retail sales period
Bunnings, Officeworks and Catch
 1H21                               1 Jul 2020 to 31 Dec 2020 (6 months)
 1H20                               1 Jul 2019 to 31 Dec 2019 (6 months)
 1H19                               1 Jul 2018 to 31 Dec 2018 (6 months)
Kmart
 1H21                              29 Jun 2020 to 3 Jan 2021 (27 weeks)
 1H20                                1 Jul 2019 to 5 Jan 2020 (27 weeks)
 1H19                             25 Jun 2018 to 30 Dec 2018 (27 weeks)
Target
 1H21                              28 Jun 2020 to 2 Jan 2021 (27 weeks)
 1H20                              30 Jun 2019 to 4 Jan 2020 (27 weeks)
 1H19                             24 Jun 2018 to 29 Dec 2018 (27 weeks)

                                                          2021 Half-year results | 51
You can also read