Half-Year Results 2021 - Valora Group
←
→
Page content transcription
If your browser does not render page correctly, please read the page content below

Half-Year Results 2021
21 JULY 2021

Michael Mueller, CEO
Beat Fellmann, CFO
AGENDA

Content                                             Page

Key Takeaways                                         3

Post-Crisis Recovery                                  6

Half-Year 2021 Results                               14

Financial Outlook                                    30

Update on Strategic Priorities                       33

Appendix                                             40

Half-Year 2021 Results Presentation, 21 July 2021          Page 2
Key Takeaways                                       Half-Year 2019
                                                    Results

Half-Year 2021 Results Presentation, 21 July 2021                    Page 3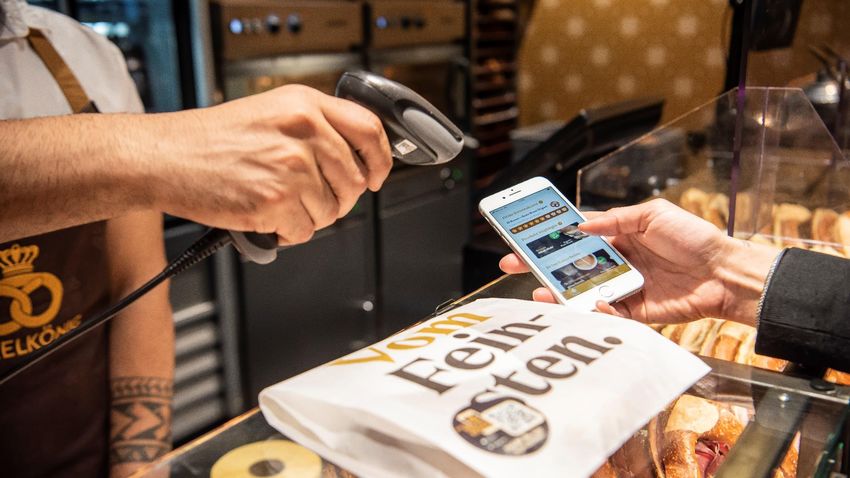
KEY TAKEAWAYS HY 2021 (1/2)

                                                    ▪ Valora confirms expectation to return to pre-crisis profitability with its operating
                                                      units within the next 6-9 months
                                                    ▪ For 2021, EBIT of 25-35 mCHF expected and 70 mCHF (+/- ~10%) for 2022
                                                    ▪ Confirmation of long-term guidance, which is expected to be reached with a
                                                      COVID-19 related delay of 18-24 months
                                                    ▪ Limited impact of continued working-from-home on footfall and sales anticipated
                                                      to be largely offset by:
                                                      − Sustainable cost improvement and a favourable category mix with more food in
                                                         the short term
                                                      − Increase in public transportation commuters in the medium term
                                                    ▪ Positive EBIT of 7.4 mCHF in HY 2021 compared to -1.9 mCHF in HY 2020
                                                      − Adjusted for the positive effect from the German governmental COVID-19
                                                         support programme («Überbrückungshilfe III») of 13.1 mCHF, an operating
                                                         growth of +16.4 mCHF for the recovery period of March to June 2021 has been
                                                         realised
                                                    ▪ HY 2021 net revenue at -19.0% compared to pre-crisis level (HY 2019) strongly
                                                      impacted by governmental restrictions and -0.2% lower compared to HY 2020,
                                                      when January and February were not affected by COVID-19
                                                      − From March to June, recovery started to gain traction after significant release
                                                         of governmental restrictions with +13.8% net revenue growth vs. HY 2020

Half-Year 2021 Results Presentation, 21 July 2021                                                                                      Page 4
KEY TAKEAWAYS HY 2021 (2/2)

                                                    ▪ Strong balance sheet confirmed
                                                      − Improved equity ratio before lease liabilities of 50.9% (FY 2020: 47.3%)
                                                      − Stable net debt, thanks to neutral free cash flow with a solid leverage ratio of
                                                         2.4x EBITDA well below covenant ceiling
                                                      − Capacity from capital increase in Nov. 2020 remains available for M&A & capex
                                                    ▪ Resilience of business model and stability of partner network confirmed even
                                                      during the prolonged and more severe than expected crisis during HY 2021
                                                      − Disciplined cost management across all areas of business
                                                      − Continued financial support to franchise and agency partners (churn rate of
                                                         partners maintained on pre-crisis level)
                                                      − Short-time working schemes helped to avoid lay-offs significantly
                                                    ▪ Continued investment along all strategic initiatives
                                                      − Continued investment in SBB refurbishment
                                                      − Progress in in-house development of digital solutions, with significantly stronger
                                                         team and higher related expenses compared to HY 2020
                                                      − Intensified M&A activity with a focus on expanding the network in existing
                                                         geographies and strengthening core business
                                                      − New cooperation with Moveri, doubling Swiss service station business
                                                    ▪ Valora strongly believes in the value creation potential of its established
                                                      foodvenience strategy

Half-Year 2021 Results Presentation, 21 July 2021                                                                                      Page 5
Post-Crisis
Recovery

Half-Year 2021 Results Presentation, 21 July 2021   Page 6
STRONG FUNDAMENTALS FOR POST-CRISIS RECOVERY

                                                       ▪ Third consecutive half-year with significant impact of government
                                                         restrictions on mobility and sales development at transportation hubs
                                                         and city centers that account for ~2/3 of pre-crisis (2019) sales
                                                       ▪ However, recovery gained traction over the last weeks since
                                                         governments in all Valora geographies started to ease restrictions
                                                         based on progress in vaccination programmes; US B2B sales with
                                                         strongest recovery in the Group as indicator for further recovery in
                                                         Europe
                                                       ▪ Reduced commuting activity based on expected increase in working-
                                                         from-home expected to have limited effect on footfall as higher total
                                                         commuter flows will compensate in the medium term
                                                       ▪ Vaccination success strengthens confidence and positively stimulates
                                                         buyer behavior; growth in public transportation expected to return as
                                                         soon as commuters feel safe (vaccination) and road congestions
                                                         increase again
                                                       ▪ The operating leverage of the recovery will be the strongest in Food
                                                         Service, which suffered the most during the crisis

Valora expects sustainable recovery of footfall to pre-crisis level at public transportation hubs and city center locations

Half-Year 2021 Results Presentation, 21 July 2021                                                                                Page 7
SALES DEVELOPMENT BY POS CLUSTER
~50% OF PRE-CRISIS SALES IN TRANSPORTATION HUBS HAVE BEEN MOST SEVERELY IMPACTED

                             Transportation hubs      City centers     Shopping malls                 Other
                                (incl. airports)                                        (Agglomeration, service stations, etc.)

                  External sales
                  development HY
                  2021 vs. 2020         -6%                  -4%            +3%                          -5%
     RETAIL

                  2021 vs. 2019        -25%                 -19%            +3%                         -12%

                  Sales
                  share            ~50%                              ~30%
                  FY 2019:
                                                    ~10%                                        ~10%

                  External sales
  SERVICE (B2C)

                  development HY
                  2021 vs. 2020        -28%                 -29%            -49%                        n/m
     FOOD

                  2021 vs. 2019        -56%                 -54%            -67%                        n/m

                  Sales
                  share            ~50%              ~40%
RECOVERY SINCE EASING OF RESTRICTIONS
Mobility trend (transit stations) in Switzerland…                                                                     … and Germany during HY 2021:

   0                                                                                                                    0
       Jan            Feb              Mrz              Apr              Mai              Jun                               Jan            Feb            Mrz       Apr         Mai       Jun
-10                                                                                                                  -10
                                                                                                                     -20
-20
                                                                                                                     -30
-30
                                                                                                                     -40
-40
                                                                                                                     -50
-50
                                                                                                                     -60
                                          Recovery months                                                                                                   Recovery months
-60                                                                                                                  -70

-70                                                                                                                  -80
       Source: Google LLC "Google COVID-19 Community Mobility Reports"   Note: Baseline = Median of 5-week period (Jan 3 – Feb 6, 2020)

External sales development during hard lockdown months (Jan+Feb) and recovery months (March-June) in 2021 vs. 2020:

 Retail CH                                          Food Service CH                                                     Retail DE/LU/AT                               Food Service DE (B2C)
                                                                                    44.1%
 in LC                    5.7%                      in LC                                                               in LC                                         in LC              1.6%
                                                                                                                                                  -0.8%

         -17.8%                                                   -54.1%                                                          -21.7%                                      -71.4%
        Jan+Feb         Mar-Jun                                 Jan+Feb           Mar- Jun                                    Jan+Feb            Mar- Jun                     Jan+Feb   Mar -Jun
Half-Year 2021 Results Presentation, 21 July 2021                                                                                                                                                  Page 9
COMMUTING ON PUBLIC TRANSPORT IN SWITZERLAND
PRE-CRISIS ONLY 38% OF TRAIN PASSENGERS COMMUTED FOR WORK

                                                                                            Share of train
Split of working population by way of commuting                                                                     Valora view for the medium term
                                                                                            passengers by purpose

                      9%                                                                                                    ▪ Return to physical attendance with
                                                                                                Education   12%               no impact on passenger volume
                     15%
                                                                                                Work                        ▪ Most affected by working-
                                   ▪ 17% of the working population in                                                         from-home trend but with
                     17%             Switzerland commuted by train,                                         38%               compensating effects from
                                     representing the 38% of train commuters                                                  new commuters (in particular
                                                                                                                              due to population growth)

                                                                                                                            ▪ Private travels (for leisure
                                                                                                                              and shopping) to recover
                                                                                                Private
                                                                                                                              faster post-COVID and with
                     59%
                                             Other                                                                            no impact on passenger
                                                                                                            50%               volume in the mid-term
                                             Other public transport
                                             Train                                                                          ▪ New public train offerings for
                                             Individual transportation (Car, Motorbike, Bike)
                                                                                                                              leisure to even increase
                                                                                                                              passenger volume
                     2019                                                                                   2019
 Source: Swiss Federal Statistical Office (Bundesamt für Statistik, BfS)

Half-Year 2021 Results Presentation, 21 July 2021                                                                                                              Page 10
EXPECTED INCREASE OF IMPORTANCE OF WORKING-
FROM-HOME
Split of workforce working from home Our view for the medium term
Usually (> 50% of working time)
▪ Pre-crisis (in 2019) 25% of the working population were
Regularly (< 50% of working time) working fully or partly from home
Occassionally
~+30% ▪ During the pandemic in 2020, the share of people working-
from-home increased to 34%
34% vs. 2019
32% (pre-Covid level) ▪ Going forward we estimate that this trend will level off at
4% ~32%, which means ~30% more people working-from-home
4% +1%pt compared to 2019
24% 25%
▪ Our assumptions in detail for working-from-home:
3% 13%
3%
15%
+4%pt − Usually (> 50% of working time): 4 days at home / week
11% − Regularly (NEW COMMUTERS EXPECTED TO COMPENSATE EFFECT
OF INCREASED WORKING-FROM-HOME
Train commuters
Illustrative example for Switzerland
Working-from-home
~0% ▪ Pre-crisis commuters did on average 6.4x journeys by train
per week
~-5% ~+3% to +5% ▪ Although the share of people working-from-home is
expected to increase from 25% in 2019 to ~32% in 2023,
the impact on train commuters being only ~-5% during that
time
New commuters
2019 Increased working- New commuters 2023E
from-home ▪ The negative effect of working-from-home is expected to be
compensated by the increase of:
− Population growth of +0.8% p.a. (2020-2025) expected
25% Share of people who can work-from-home ~32%
(Valora estimate)
by BfS (historically 1.0% p.a. between 2010-2020),
which is a key driver of the continuously increasing
passenger volume
17.0% Share of working commuters ~17.3%
(Valora estimate; based on 50% historical growth)
− Constantly increasing share of public transportation
commuters in the workforce with 17.0% in 2019 and an
+1.0% p.a. Population growth +0.8% p.a. estimated share of ~17.3% by 2023
(2010-2020) (2020-2025; BfS estimate)
Source: Swiss Federal Statistical Office (Bundesamt für Statistik, BfS)
Half-Year 2021 Results Presentation, 21 July 2021 Page 12FOOD SERVICE WITH SUBSTANTIAL OPERATING
LEVERAGE IN RECOVERY
FOOD SERVICE WITH LOWER RELATIVE BREAK-EVEN SALES THAN RETAIL
Retail – Operating Leverage Food Service – Operating Leverage
Dec Jun Dec Jun Dec Dec Jun Dec Jun Dec
2019 2020 2020 2021 2021 2019 2020 2020 2021 2021
fixed costs sales break-even sales fixed costs sales break-even sales
Food Service with high incremental EBIT impact on sales changes (at existing capacities), thanks to high GP margin >70%
Half-Year 2021 Results Presentation, 21 July 2021 Page 13Half-Year 2021
Results Half-Year 2019
Results
Half-Year 2021 Results Presentation, 21 July 2021 Page 14FINANCIAL REVIEW HY 2021
▪ Year-on-year EBIT increase of +9.2 mCHF to 7.4 mCHF
▪ EBIT growth of +29.5 mCHF in March to June – period comparably impacted
by the COVID-19 crisis in both years – attributable to:
− Operating business (+16.4 mCHF) – both divisions contributed to the
positive development
− Funds received from the «Überbrückungshilfe III» (+13.1 mCHF)
▪ January and February with strong results in HY 2020 were also COVID-19
affected in HY 2021 – leading to an adverse YOY effect on EBIT of
-20.3 mCHF
▪ Highly disciplined cost management continued, however, cost reductions
partly offset by lower rent concessions, SBB rent increases and higher
expenses related to digital innovations and M&A projects;
costs -2.2% below HY 2020 and 59.1 mCHF or -14.5% below pre-crisis level
▪ Strong balance sheet and financial stability confirmed with leverage
ratio of 2.4x EBITDA and equity ratio of 50.9% well below financial covenant
ceiling creating flexibility for organic investments and M&A along strategic
priorities; the incremental capacity from the capital increase in November
2020 remains fully available for strategic projects
Half-Year 2021 Results Presentation, 21 July 2021 Page 15HY 2021 STILL IMPACTED BY COVID-19
HY 2021 figures vs. HY 2020 figures restated
GROUP* RETAIL FOOD SERVICE
External GP Margin External External
Sales 1,030 mCHF 43.8% Sales 870 mCHF Sales 150 mCHF
-5.1% +0.2%pts -3.7% -14.4%
EBITDA** EBIT EBITDA** EBITDA**
39.3 mCHF 7.4 mCHF 36.2 mCHF 7.3 mCHF
+8.6 mCHF +9.2 mCHF +7.7 mCHF +4.6 mCHF
Free Cash Leverage Ratio EBIT EBIT
Flow -0.1 mCHF 2.4 x 19.0 mCHF -6.6 mCHF
-11.6 mCHF -0.2x vs. FY 2020 +8.9 mCHF +4.2 mCHF
* Including other for Corporate
** EBITDA is EBIT plus amortisation of intangibles assets and the depreciation of PPE. EBITDA is not considering depreciation on right-of-use assets arising from lease agreements (IFRS 16 effect).
Half-Year 2021 Results Presentation, 21 July 2021 Page 16RECOVERY IN LINE WITH EASING OF RESTRICTIONS
Retail – POS (2,017 as per June 2021) Food Service (B2C) – POS (627 as per June 2021)
8% 7% 6% 5% 4% 2% 3%
15% 18% 10%
24% 21% 23% 31% 26%
21% 23% 24%
77%
72% 77%
72%
75% 76% 64% 69%
71% 70% 70% 71%
13% 13% 20%
5% 6% 10%
Jan Feb March April May June Jan Feb March April May June
Closed stores Reduced opening hours Normal operation
Retail – External sales HY 2021 vs. HY 2019 (in % in LC) Food Service (B2C) – External sales HY 2021 vs. HY 2019 (in % in LC)
-14 -15 -11 -36
-17 -16 -55 -54
-21 -65 -66 -58
Half-Year 2021 Results Presentation, 21 July 2021 Page 17EXTERNAL SALES / NET REVENUE
IMPACTED BY TWO ADDITIONAL COVID-19 MONTHS | RECOVERY GAINING TRACTION FROM MARCH TO JUNE
External sales – Valora Group Net revenue – Valora Group
in mCHF in mCHF
-0.2%
-5.1% March to June: +13.8%
March to June: +8.5%
1,085.2 815.6 814.1
-54.8 1,030.4
-1.5
39% 39% 40% 42%
61% 61% 60% 58%
Foodvenience categories* Foodvenience categories*
Press, Book, Tobacco Press, Book, Tobacco
HY 2020 HY 2021 HY 2020 HY 2021
* Foodvenience categories include Food, Services, Non-Food and exclude Press, Books and Tobacco
▪ Sales overall slightly below HY 2020 figures due to lower footfall related to governmental restrictions to contain the virus and two
additional COVID-19 impacted months January / February
▪ From March to June, recovery started to gain traction, with YOY growth of +8.5% in external sales and +13.8% in net revenue
▪ Stable category mix in external sales, since BackWerk franchise outlets in the out-of-home food market in Germany were strongly
affected by government restrictions in the first half of 2021
▪ +2 %-pts increase of foodvenience share in net revenue thanks to Retail CH and FS B2B
Half-Year 2021 Results Presentation, 21 July 2021 Page 18NET REVENUE
POSITIVE DEVELOPMENT IN BOTH DIVISIONS FROM MARCH TO JUNE, +13.8% IN TOTAL
Division | Country
HY 2020 HY 2021 ∆ in % ∆ % in LC
in mCHF
Retail 697.4 697.0 -0.1% -0.8%
CH 516.0 519.2 +0.6% +0.6%
DE/LU/AT 181.4 177.7 -2.0% -4.7%
Food Service 112.3 106.9 -4.8% -6.3%
Other 5.9 10.2 +72.7% 72.7%
Valora Group 815.6 814.1 -0.2% -1.0%
LC = Local Currency
Retail CH Food Service
▪ Slight YOY increase of +0.6% ▪ Decrease of -6.3% in LC for HY 2021
▪ +8.6% growth from March to June, most categories showing a ▪ Growth of +38.8% in the period from March to June
positive development
− Increased sales of +39.6% at Food Service CH
▪ Net of effects from changes in operating models, food external
sales increased by +10.3% in the period from March to June − Food Service DE with a decline of -2.7% in LC – corresponding
to a slight increase of +1.6% in LC in external sales – out-of-
Retail DE/LU/AT home food market in Germany more affected by government
▪ Sales decrease of -4.7% in LC, driven by January and February restrictions than in Switzerland during the first half of 2021
▪ Growth of +8.6% in LC from March to June, all categories − Food Service B2B with strongest growth rate of +58.8% in LC –
contributed with record sales at Ditsch USA having already fully recovered
Half-Year 2021 Results Presentation, 21 July 2021 Page 19GROSS PROFIT VS. OPERATING COSTS
STABLE GP MARGIN AND IMPROVED OPERATING COST RATIO
Gross profit – Valora Group Operating costs – Valora Group
in mCHF; GP margin in % in mCHF; Cost ratio in %
+0.3%
-2.2%
+1.2
+8.0
355.3 356.5 -357.2
-349.2
HY 2020 HY 2021 HY 2020 HY 2021
43.6% 43.8% -43.8% -42.9%
▪ Stable gross profit ▪ Highly disciplined cost management continued across all units
▪ Corresponding to YOY growth of +19.5% for March to June ▪ Cost reductions partly offset by lower rent concessions, higher
SBB rent and higher expenses related to digital innovations and
M&A projects
▪ Besides governments’ short-time-working programmes, the Group
also made use of «Überbrückungshilfe III»
▪ Moreover, Valora continued to support its franchise and agency
Half-Year 2021 Results Presentation, 21 July 2021 partners to secure their economic viability Page 20GROSS PROFIT
GROUP GROSS PROFIT MARGIN STABLE THANKS TO STRONG RETAIL CH DEVELOPMENT
Division | Country ∆ Gross Profit ∆ GP
HY 2020 HY 2021 ∆ % in LC
in mCHF in % Margin Margin
Retail 264.9 274.5 +3.6% +2.9% 39.4% +1.4%pts
CH 202.7 213.5 +5.3% +5.3% 41.1% +1.8%pts
DE/LU/AT 62.2 61.0 -2.0% -4.7% 34.3% -0.0%pts
Food Service 86.4 78.1 -9.6% -11.0% 73.0% -3.8%pts
Other 4.0 4.0 -1.7% -1.7% 38.9% n.m.
Valora Group 355.3 356.5 +0.3% -0.5% 43.8% +0.2%pts
LC = Local Currency
Retail CH Food Service
▪ Gross profit growth of +5.3% in HY 2021 ▪ HY 2021 with gross profit decline of -11.0% due to additional
▪ Corresponding YOY growth from March to June of +14.7% COVID-19 impacted months January and February
▪ +1.8 %-pts margin improvement driven by positive sales-mix ▪ Corresponding YOY growth from March to June of +36.0%
effects and supported by resilient promotional income ▪ GP margin decrease by -3.8 %-pts to 73.0% driven by
portfolio mix effects, particularly a higher share of B2B sales
Retail DE/LU/AT
▪ HY 2021 with sales-driven decline in gross profit of -4.7% in LC
▪ Corresponding YOY growth from March to June of +9.9%
▪ GP margin could be maintained
Half-Year 2021 Results Presentation, 21 July 2021 Page 21OPERATING COSTS (INCL. D&A)
HIGHLY DISCIPLINED COST MANAGEMENT CONTINUED ACROSS ALL UNITS
Division | Country HY 2020 ∆ Cost ∆
HY 2021 ∆ % in LC
in mCHF restated in % Ratio* Cost Ratio
Retail -254.9 -255.5 +0.3% -0.4% -36.7% -0.1%pts
CH -194.6 -204.4 +5.1% +5.1% -39.4% -1.7%pts
DE/LU/AT -60.3 -51.1 -15.2% -17.5% -28.7% +4.5%pts
Food Service -97.1 -84.7 -12.8% -14.3% -79.2% +7.3%pts
Corporate / Other -5.2 -9.0 +72.4% +72.6% n.m. n.m.
Valora Group -357.2 -349.2 -2.2% -3.1% -42.9% +0.9%pts
* Cost Ratio defined as Net Operating Costs (incl. D&A) in % of Net Revenue LC = Local Currency
Retail CH Food Service
▪ Cost increase of +5.1% due to substantially lower rent ▪ Cost reduction of -14.3% in LC – compared to an already
concessions (-12.7 mCHF) and higher SBB rent streamlined basis in the first half of 2020
▪ Additional savings based on lower personnel expenses, higher
Retail DE/LU/AT rent concessions and «Überbrückungshilfe III»
▪ Further cost reduction of -17.5% in LC
▪ Major effects resulted from decreased personnel expenses, rent Other
concessions and «Überbrückungshilfe III» ▪ Cost increase of -3.8 mCHF particularly due to increased digital
innovations expenses and M&A projects
Half-Year 2021 Results Presentation, 21 July 2021 Page 22COSTS ALMOST -60 MCHF BELOW PRE-CRISIS LEVEL
>60% OF LOST GROSS PROFIT MITIGATED BY LOWER COST
Cost reduction
vs. HY 2019 Key cost measures
(14% of costs, 59 mCHF)
Personnel ▪ Short-time work
~40% (incl. agency & ▪ Optimised working hours
franchise) ▪ Offsetting effect of temporary partner support
▪ Variable operating expenses
Other operating
▪ Reduced administration costs
expenses*
~50% ▪ «Überbrückungshilfe III»
▪ Lower variable rent
Rent** ▪ Higher rent after SBB tender
~10% ▪ Rent concessions for lockdown phase – however lower than in HY 2020
HY 2021
* Including D&A w/o amortisation of the right-of-use asset
** Including amortisation of the right-of-use asset related to rental costs
Half-Year 2021 Results Presentation, 21 July 2021 Page 23HY 2021 EBIT OF 7.4 mCHF
OPERATING BUSINESS RESUMING GROWTH FROM MARCH TO JUNE
EBIT – Valora Group
in mCHF; EBIT margin in %
7.4
13.1
-1.9
-10.9 -20.3
16.4
HY 2020 HY 2020 January / February operating business «Überbrückungshilfe III» HY 2021
stated restated * March - June
-1.3% -0.2% 0.9%
▪ January and February with strong results in HY 2020 were also COVID-19 affected in HY 2021 – leading to an adverse YOY effect on
EBIT of -20.3 mCHF
▪ EBIT growth of +29.5 mCHF from March to June – comparable period impacted by the COVID-19 crisis in both years – attributable to:
− Operating business (+16.4 mCHF) resuming growth as sales recovery gains traction
− Funds related to «Überbrückungshilfe III» (+13.1 mCHF)
* In the first half-year 2020, there was a lack of clarity pertaining to the booking of COVID-19-related rent concessions. For the first half-year, Valora recorded the rent concessions linearly over the duration of the reduction and reported
them proportionally in the published 2020 half-year results. In Q3 2020, the IFRS standard was specified so the previously negotiated COVID-19 rent concessions have to be booked fully at the time at which the contract was concluded.
Accordingly, the first half-year 2020 (HY) has been adjusted retrospectively.
Half-Year 2021 Results Presentation, 21 July 2021 Page 24EBIT
POSITIVE DEVELOPMENT IN ALL UNITS | RETAIL DE/LU/AT EBIT MARGIN ABOVE PRE-CRISIS LEVEL
Division | Country HY 2020 ∆ EBIT ∆ EBIT
HY 2021 ∆ % in LC
in mCHF restated in % Margin Margin
Retail 10.1 19.0 +88.2% +86.1% 2.7% +1.3%pts
CH 8.1 9.1 +11.9% +11.9% 1.8% +0.2%pts
DE/LU/AT 2.0 9.9 +405.6% +377.6% 5.6% +4.5%pts
Food Service -10.8 -6.6 n.m. n.m. n.m. n.m.
Corporate / Other -1.2 -5.0 n.m. n.m. n.m. n.m.
Valora Group -1.9 7.4 n.m. n.m. 0.9% +1.1%pts
Retail CH Food Service
▪ EBIT growth of +1.0 mCHF, despite substantially lower rent ▪ Increase in EBIT of +4.2 mCHF
concessions and increase in SBB rents
▪ Even excluding positive effect from «Überbrückungshilfe III»:
▪ Increase of +4.1 mCHF in the period from March to June EBIT increase of +10.7 mCHF in the period from March to
▪ ROCE of 14.1% and 24.8% excluding goodwill June
Retail DE/LU/AT
▪ Even excluding the positive effect from «Überbrückungshilfe III»
− EBIT growth of +4.8 mCHF from March to June
− EBIT margin of 2.8% above HY 2019 pre-crisis level (2.5%)
▪ ROCE of 12.4% and 30.0% excluding goodwill
Half-Year 2021 Results Presentation, 21 July 2021 Page 25NET PROFIT
IMPROVEMENT OF +4.6 MCHF
Group net profit / loss in mCHF
Net Profit / EPS HY 2020 ∆
HY 2021
in mCHF restated in %
-3.8 EBIT -1.9 7.4 n.m.
-8.4 Financing activities, net -13.0 -10.3 -20.7%
4.6
-15.9 Earnings before taxes -14.9 -2.9 n.m.
Income taxes 6.5 -0.9 n.m.
Group net profit / loss -8.4 -3.8 n.m.
EPS Group in CHF -2.12 -0.87 n.m.
HY 2020 HY 2020 HY 2021 Average number of outstanding shares in # (thousand) 3’942 4’382 +11.2%
stated restated *
▪ Improved net financial result, particularly thanks to a positive exchange rate impact and lower IFRS 16 related interest
▪ Income taxes of -0.9 mCHF include effect from fully taxable «Überbrückungshilfe III»
▪ The tax income in 2020 was positively impacted by the release of a provision and deferred taxation
▪ Higher number of average outstanding shares as a result of the Group’s capital increase in November 2020
* In the first half-year 2020, there was a lack of clarity pertaining to the booking of COVID-19-related rent concessions. For the first half-year, Valora recorded the rent
concessions linearly over the duration of the reduction and reported them proportionally in the published 2020 half-year results. In Q3 2020, the IFRS standard was
Half-Year 2021 Results Presentation, 21 July 2021 specified so the previously negotiated COVID-19 rent concessions have to be booked fully at the time at which the contract was concluded. Accordingly, the first half- Page 26
year 2020 (HY) has been adjusted retrospectively.CAPEX
CONTINUED INVESTMENTS IN EXPANSION AND INNOVATION | PHASING EFFECTS
Capex – Valora Group
in mCHF
12.5 mCHF
Maintenance
30%
Retail 7.5
70%
Food Service 3.3 Expansion &
Innovation
Corporate 1.7
HY 2021
▪ Capex of 12.5 mCHF with the continuous refurbishment of SBB locations as
a major project
▪ ~50% reduced capex compared to HY 2020, driven by prioritisation and
phasing of investments
▪ Catch-up in second half of 2021
Half-Year 2021 Results Presentation, 21 July 2021 Page 27FREE CASH FLOW
CASH OUTFLOW FROM INVESTING ACTIVITIES FINANCED BY CASH INFLOW FROM OPERATING ACTIVITIES
Free cash flow
in mCHF
Free Cash Flow HY 2020 ∆
HY 2021
in mCHF restated in %
EBIT -1.9 7.4 n.m.
11.5
D&A (excluding depreciation of right-of-use asset) 32.6 32.0 -1.8%
Depreciation of RoU - IFRS 16 effect 75.6 79.1 +4.6%
Payments rents / leasing (net) - IFRS 16 effect -68.3 -77.0 +12.7%
Interest - IFRS 16 effect -9.1 -8.1 -10.8%
Elimination of other non-cash items 2.4 2.0 -16.3%
-11.6 NWC and current assets & liabilities 20.2 -9.0 n.m.
Interest, tax expense (net) -4.9 -7.1 +45.1%
CF from operating activities 46.6 19.2 -58.8%
CF from investing activities (net) -35.1 -19.3 -45.1%
Free Cash Flow (before M&A) 11.5 -0.1 n.m.
-0.1
HY 2020 HY 2021
▪ Cash flow from operating activities decreased to 19.2 mCHF
− Positive impact from EBIT(DA) increase offset primarily by NWC effects
− Solid NWC management also in HY 2021, but HY 2020 included the extraordinary strict NWC management and the one-time
inflow from renegotiated payment terms
▪ Cash flow from investing activities was reduced by -45.1% to -19.3 mCHF based on focused capex and phasing effects
Half-Year 2021 Results Presentation, 21 July 2021 Page 28BALANCE SHEET
STRENGTH UNCHANGED Balance Sheet
FY 2020 HY 2021
∆
in mCHF in %
Net debt Total assets 2’445.9 2’328.1 -4.8%
thereof right-of-use asset & sublease net investment 999.3 979.9 -1.9%
in mCHF
+2.9% Cash, cash equivalents 229.7 149.9 -34.8%
Goodwill and intangible assets 643.6 643.5 0.0%
218.0 Other assets (incl. right-of-use asset & sublease net investment) 1’572.5 1’534.7 -2.4%
211.8 +6.2 Interest bearing debt 441.5 367.9 -16.7%
Other debt (incl. financial lease liabilities) 1’319.3 1’274.2 -3.4%
Shareholders' equity 685.0 686.0 +0.1%
Equity ratio 47.3% 50.9% +3.6%pts
Equity ratio incl. lease liability 28.0% 29.5% +1.5%pts
EBITDA 83.4 92.1 +10.4%
FY 2020 HY 2021
Net debt 211.8 218.0 +2.9%
Net debt incl. lease liability 1’239.5 1’228.2 -0.9%
2.5x 2.4x Leverage ratio 2.5x 2.4x -0.2x
Leverage ratio incl. lease liability 5.2x 4.9x -+0.3x
ROCE 1.3% 2.2% +0.9%pts
Please refer to appendix for more details on alternative performance measures
▪ Improved equity ratio of 50.9% compared to 47.3% as of 31 December 2020
▪ Net debt fairly stable, supported by neutral free cash flow and by the suspension of a dividend payment for the 2020 financial year
▪ Leverage ratio of 2.4x EBITDA remained well below the covenant ceiling
▪ Lower amount of cash and cash equivalents after the repayment of the Schuldscheindarlehen II (72 mEUR) in April 2021 as scheduled
▪ The incremental capacity from the Group’s capital increase in November 2020 remains fully available for strategic projects
▪ Favourable maturity profile with no maturity before 2023 and 150 mCHF unused CFA provide financial flexibility and stability
Half-Year 2021 Results Presentation, 21 July 2021 Page 29Financial Outlook Half-Year 2021 Results Presentation, 21 July 2021 Page 30
SHORT-TERM OUTLOOK
EXPECTATIONS FOR 2021 CONFIRMED AS COMMUNICATED ON 24 FEB 2021

                                                    ✓ Tough start into 2021
                                                    ✓ Step-by-step easing of restrictions – process expected to take longer than
                                                      anticipated with a material recovery of footfall not before June 2021
                                                    ✓ Easing of restrictions to stimulate mobility and out-of-home consumption
                                                      comparable to development between waves in 2020
                                                    ✓ Food category sales expected to recover significantly above average with an
                                                      especially strong positive impact on sales and gross margin in foodvenience
                                                    ✓ H1 result heavily impacted but H2 should be substantially better than H2
                                                      2020
                                                    ✓ Operating units return to pre-crisis profitability expected within
                                                      next 6-9 months
                                                    ✓ Tight cost management is maintained, benefiting from experience and
                                                      measures already implemented in 2020
                                                    ✓ Refurbishment of SBB locations shall continue as fast as meaningfully and
                                                      expansion of digital competence and solutions shall not be jeopardised
                                                    Further specification:
                                                                       EBIT of 25 to 35 mCHF expected for 2021
                                                                      (no additional adverse COVID-19 restrictions)

Half-Year 2021 Results Presentation, 21 July 2021                                                                                  Page 31
MID- AND LONG-TERM OUTLOOK
ESTABLISHED FOODVENIENCE STRATEGY WITH CONTINUED HIGH VALUE CREATION POTENTIAL
Assumptions for overall outlook
@Annette: Bild mit Person ▪ COVID-19 vaccination programmes continuing to prove their effectiveness,
ohne Maske restrictions being eased considerably with the concomitant recovery in
footfall and sales, and no significant restrictions to contain possible future
virus waves
▪ Above average catch-up effect in the food category with a positive influence
on foodvenience turnover and gross profit margin – strongest operating
leverage of recovery in Food Service
▪ Flexibility of the Groups’ cost base as additional key driver – no material
further rent concessions and short-time working compensation
Mid-term outlook
▪ EBIT of 70 mCHF (+/- ~10%) expected for 2022
Long-term outlook
▪ Valora confirms long-term guidance set in 2019
▪ Operational target achievement (initially set for 2025) with delay of
18 to 24 months due to the COVID-19 crisis and continued uncertainty on
timing of air travel and public transport recovery
Half-Year 2021 Results Presentation, 21 July 2021 Page 32Update on Strategic Priorities Half-Year 2021 Results Presentation, 21 July 2021 Page 33
UPDATE ON SBB REFURBISHMENTS
▪ The SBB refurbishment program has been delayed by roughly one
year because of the COVID-19 crisis with scheduled completion by
approx. the end of 2022
− As of end of HY 2021 92 POS have been refurbished or newly
opened across the SBB network
▪ The results of the refurbishments are highly promising with a better
performance of the refurbished stores, particularly in food during the
recovery period from March-June 2021
− The refurbished SBB stores achieved year-on-year growth of +14%
in food sales, while the not yet refurbished stores recorded fairly
stable sales during that period
14.3%
yoy performance during March-June 2021
7.3%
Refurbished SBB POS
Non-refurbished SBB POS
-1.0%
-3.4%
All categories Food
▪ In addition, 17 Retail POS (mainly k kiosk) have been refurbished and
newly opened in HY 2021 beyond the SBB network in Switzerland
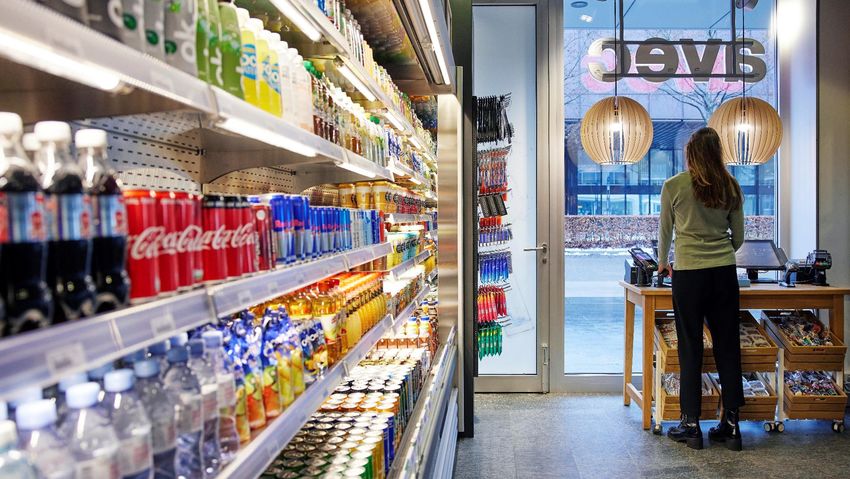
Half-Year 2021 Results Presentation, 21 July 2021 Page 34DIGITAL CONVENIENCE SOLUTIONS TO IMPROVE
CUSTOMER EXPERIENCE
24/7 Service Store avec mini ▪ Valora continued to invest significantly (even above pre-crisis
levels) in digital initiatives by hiring new talents and by further
pushing in-house development of new solutions that improve the
customer experience and operations of our core business
▪ The automated store pilot at ETH Hönggerberg had been very
successful as well as the 24/7 hybrid avec store at Zurich
Hardplatz, while new locations – including for the first time in
cooperation with DB in Germany (24/7 Service Store) – will be
tested; the team is preparing the scaling of the solution
▪ The delivery solution avec now is now successfully present at 6
locations in Switzerland
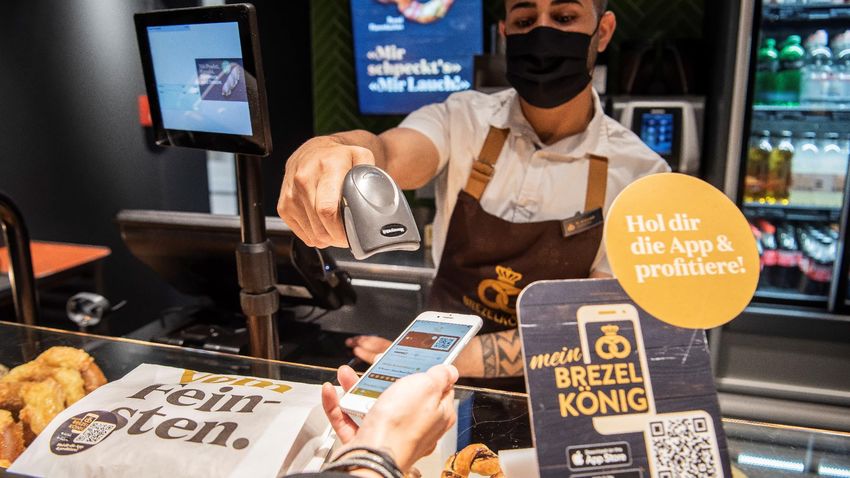
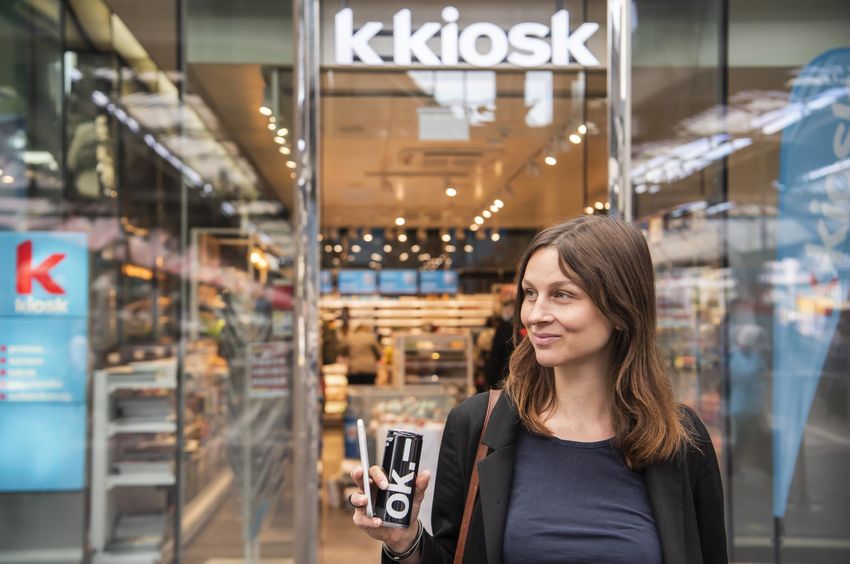
k kiosk tobacco shop Brezelkönig app
▪ Valora plans to expand its automated store initiative in smaller
formats in the form of «automated shelves» (i.e. avec mini for e.g.
office spaces, avec shelf for shop-in-shop concepts); expansion of
conventional vending machines operated at existing POS or
independently also planned
▪ During HY 2021, the Valora digital team launched the new, in-
house developed online k kiosk tobacco store as a further
distribution channel in the tobacco category, and the Brezelkönig
app to offer an attractive loyalty scheme to customers
https://tabak.kkiosk.ch/
Half-Year 2021 Results Presentation, 21 July 2021 Page 35SIGNIFICANT INVESTMENTS IN DIGITAL INITIATIVES
(Expected) Development of Opex and Capex spending: (Expected) Development of FTEs:
~30
~2x ~5.5x ~7x 100% ~1.5x ~2x
100%
FY 2019 FY 2020 FY 2021 FY 2022 FY 2019 HY 2020 FY 2020 HY 2021 FY 2021 FY 2022
▪ Continued investment in digital opportunities during pandemic (even above pre-crisis level) to further strengthen
technological expertise
▪ Significant investment (opex and capex) planned for the coming years by hiring new talents and by further pushing in-house
development of new solutions that improve the customer experience and operations of our core business
▪ In-house digital investments increase incremental revenue and promotional potential and offer additional opportunities to
enter new markets
Half-Year 2021 Results Presentation, 21 July 2021 Page 36STRENGTHENING SERVICE STATIONS FOOTPRINT IN
SWITZERLAND THANKS TO A NEW PARTNERSHIP
WITH MOVERI
▪ Taking over operation of 39 service station stores from 1 January 2022
Deal currently operated by shop and more AG from Moveri
overview
▪ Long-secured rental contract
▪ Convenience shops are attractive at service stations and complement Valora’s
foodvenience business ideally as ~70%* of customers shop at service stations
without buying fuel; they come by because of the store’s location and the
convenience assortment
Deal − Increase market share of foodvenience and strengthening avec brand at
rationale service stations beyond Tamoil
− Service stations proved to be very attractive also during the COVID-19 crisis
− Strengthen position as a promotion platform for industry partners
▪ Diversification of service station network in German-speaking Switzerland
Substantial ▪ Central operations, purchasing, promotions and supply functions offer yearly
long-term single-digit million synergy potential
synergies ▪ Profiting from Moveri’s nationwide leading service station know-how
* Source: Based on own Tamoil/avec service store sales slips analysis (YTD June 2021)
Half-Year 2021 Results Presentation, 21 July 2021 Page 37GEOGRAPHICAL DIVERSIFICATION OF THE SERVICE
STATION NETWORK IN SWITZERLAND
Expanding avec network with Moveri
▪ Doubling avec stores at service stations in Switzerland from currently
61 to ~100 and almost doubling related net revenue
− Expected net revenue of the 39 stores in 2022: > 60 mCHF
▪ Partnership with Moveri strengthens market position at service stations
especially in German-speaking Switzerland
− Current avec stores at Tamoil service stations with strong presence
in the western part of Switzerland and greater Zurich area
− With the Moveri partnership, Valora now strengthens its service
station footprint at highly frequented locations in the northwestern
and eastern part of the country including the Zurich area
▪ The shop and more AG stores, currently mostly operated under
APERTO, will be converted into avec convenience stores in the future
▪ As a consequence, avec network as a whole will expand to ~300 POS
(after completion of SBB roll-out) and the higher-margin food share in
the Group’s category mix will increase further
Half-Year 2021 Results Presentation, 21 July 2021 Page 38INITIATIVES TO STRENGTHEN CORE BUSINESS,
INCLUDING M&A
▪ In recent months, Valora has intensified and invested in its M&A activity with a focus on
expanding the network in existing geographies and to strengthen its core business
M&A ▪ Valora also entered into strong partnerships to further grow its business
Strategy ▪ Based on a strong expertise in the foodvenience market and the proven post-acquisition
integration capabilities, Valora is convinced to create value through acquisition in the near
future
▪ In June 2021, BackWerk communicated its franchise partnership in the Netherlands with
HMSHost International for 12 new locations at the largest Dutch train stations
Network
Expansion
▪ In July 2021, Valora communicated to take over 5 bookshops at railway stations in northern
Bavaria, reinforcing its leading position in the German station bookshop market and its
partnership with DB
▪ In April 2021, bob Finance launched its cooperation with PostFinance to offer online
Collaboration consumer credit solutions with attractive conditions and access to a broad customer base
Half-Year 2021 Results Presentation, 21 July 2021 Page 39APPENDIX APPENDIX Half-Year 2021 Details Group
STRONG FORMATS AND DISTINCT PRESENCE
IN GERMAN-SPEAKING EUROPE
                                                                                                                                                External sales split
                                                                                    Change vs.                                                   2020 by country
                    Format and number of stores                         June 2021
                                                                                    Dec. 2020

                                       k kiosk                           1,131         -16
                                       Press & Books                        192         +1
     RETAIL

                                       cigo & subformats                    392        -10
                                                                                                                                           Switzerland   53%
                                       avec                                 172         +4

                                       ServiceStore DB                      104         -1                   29

                                       U-Store                               24         0
                                                                                                                              1,362
                                                                                                                  74
                                       Ditsch                               196         -2
     FOOD SERVICE

                                       Brezelkönig CH                        56         -5
                                                                                                                                             Germany
                                       Brezelkönig Internat.                  4          -                                                               42%
                                                                                                                                      37
                                       Caffè Spettacolo*                     32         -3
                                                                                                                         1,142
                                       BackWerk**                           341         -4
                                       Total                             2,644         -36       Number of stores as per June 2021              Other    5%
                    * Thereof 2 POS in Retail Luxembourg                                                                                                 2020
                    ** Including 3 SuperGuud locations in Switzerland

Half-Year 2021 Results Presentation, 21 July 2021                                                                                                                      Page 41
OUR MAIN RETAIL & CONVENIENCE FORMATS
Market leader in the kiosk Tobacco retailer also
business, mainly supplying offering press products
tobacco, press and lottery and a range of services for
products. A growing share people on the move.
of food as well as fresh
products and expanding
digital services offering.
Stores: 1,131 Stores: 392
Specialist in delivering a Modern convenience
wealth of reading material. format at highly frequented
Extensive press offering locations, for example
complemented by selected train stations or service
book titles and a range of stations, with an extensive
services for people on the offering of fresh food,
move. other comestibles and
Stores: 192 regional products.
Stores: 172
Number of stores as per June 2021
Half-Year 2021 Results Presentation, 21 July 2021 Page 42OUR MAIN FOOD SERVICE FORMATS
Germany’s largest self- Sale of high-end pretzel
service bakery with a broad dough products, such as
and flexible range of snacks pretzels, baguettes,
and feel-good food. croissants, hot dogs or
selected sandwich snacks
when on the move. Internat.
franchise system.
Stores: 341
Stores: 60
Leading producer and Italian-themed coffee bar
provider of pretzels and concept with its own
products for immediate locations and an integrated
consumption for the retail coffee module concept for
and wholesale market with other Valora formats.
its own branch network.
Stores: 32
Stores: 196
Number of stores as per June 2020
Half-Year 2021 Results Presentation, 21 July 2021 Page 43OVERVIEW OF BUSINESS MODELS
TRANSFORMATION FROM AN OWN SALES NETWORK TO AN AGENCY / FRANCHISE MODEL
Own stores Agency Franchise
25%
Operations Valora Agent Franchisee
Inventory Valora Valora Franchisee
Own 89%
Lease agreement Valora Valora Valora
Franchisee (BW)
Store investment Valora Valora 75%
Valora (R DE)
Valora pays Valora receives
Fee None
commission to agent franchise fee
# number of stores Agencies
June 2021
658; 25% 1,154; 44% 832; 31% 11%
& Franchise
R = Retail; DE = Germany; BW = BackWerk
2011 2021
(June)
Half-Year 2021 Results Presentation, 21 July 2021 Page 44ALTERNATIVE PERFORMANCE MEASURES
Net debt: Interest bearing debt (excluding lease liability) minus cash
Balance sheet
& cash equivalents ROCE: EBIT / Capital employed
Capital employed: Capital employed excl. right-of-use asset &
New KPIs / Ratios
sublease net investment
Assets: Assets excl. right-of-use asset and sublease net investment
Leverage Ratio: Net debt / EBITDA
EBITDA:
+ EBIT (according to new IFRS 16 standard)
P&L
+ Depreciation (excluding depreciation of right-of-use asset)
Equity Ratio: Equity / Assets
+ Amortisation
Free Cash Flow: Eliminating IFRS 16 effect in cash flow:
Cash Flow
+ EBITDA + Depreciation of right-of-use asset
+ Non-cash items - Payments rent / leasing (net)
+/- Net working capital - Interest expenses
- Interest and taxes
Half-Year 2021 Results Presentation, 21 July 2021 Page 45APPENDIX Next Event & Contacts Details Group Half-Year 2021 Results Presentation, 21 July 2021 Page 46
NEXT EVENT & CONTACTS
NEXT EVENT

 FY 2021                                                                                        23 February, 2022

 AGM                                                                                            6 April, 2022

CONTACTS

 Christina Wahlstrand                                                                           Phone:      +41 61 467 24 53
 Head of Corporate Communications & Branding                                                    E-mail:     media@valora.com

 Annette Carrer-Martin                                                                          Phone:      +41 61 467 21 23
 Head of Corporate Investor Relations                                                           E-mail:     annette.carrer@valora.com

                                                    Please visit our website for more information regarding Valora
                                                                           www.valora.com

Half-Year 2021 Results Presentation, 21 July 2021                                                                                       Page 47
Brightens up your journey.
You can also read


