2019 HALF YEAR RESULTS - 9 MAY 2019 - Orica
←
→
Page content transcription
If your browser does not render page correctly, please read the page content below

9 MAY 2019
             2019 HALF YEAR RESULTS

             ALBERTO CALDERON, MANAGING DIRECTOR AND CEO
             CHRISTOPHER DAVIS, CHIEF FINANCIAL OFFICER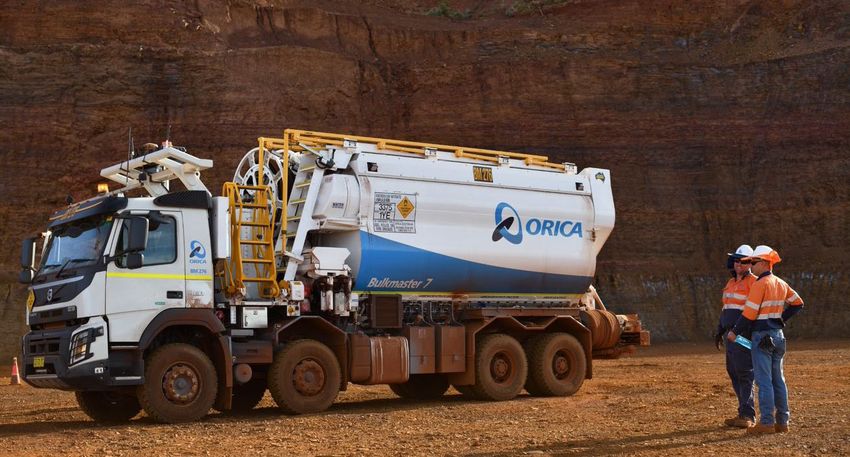
Disclaimer

Forward looking statements
This presentation has been prepared by Orica Limited. The information contained in this presentation is for informational purposes only. The information contained in
this presentation is not investment or financial product advice and is not intended to be used as the basis for making an investment decision. This presentation has
been prepared without taking into account the investment objectives, financial situation or particular needs of any particular person.

No representation or warranty, express or implied, is made as to the fairness, accuracy, completeness or correctness of the information, opinions and conclusions
contained in this presentation. To the maximum extent permitted by law, none of Orica Limited, its directors, employees or agents, nor any other person accepts any
liability, including, without limitation, any liability arising out of fault or negligence, for any loss arising from the use of the information contained in this presentation. In
particular, no representation or warranty, express or implied, is given as to the accuracy, completeness or correctness, likelihood of achievement or reasonableness of
any forecasts, prospects or returns contained in this presentation. Such forecasts, prospects or returns are by their nature subject to significant uncertainties and
contingencies.

Before making an investment decision, you should consider, with or without the assistance of a financial adviser, whether an investment is appropriate in light of your
particular investment needs, objectives and financial circumstances. Past performance is no guarantee of future performance.

Non-International Financial Reporting Standards (Non-IFRS) information
This presentation makes reference to certain non-IFRS financial information. This information is used by management to measure the operating performance of the
business and has been presented as this may be useful for investors. This information has not been reviewed by the Group’s auditor. Refer to slide 36 for a
reconciliation of IFRS compliant statutory net profit after tax to EBITDA. Forecast information has been estimated on the same measurement basis as actual results.

Note: numbers in this document are subject to rounding and stated in Australian dollars unless otherwise noted.

                                                                                                                                                        2019 HALF YEAR RESULTS |      2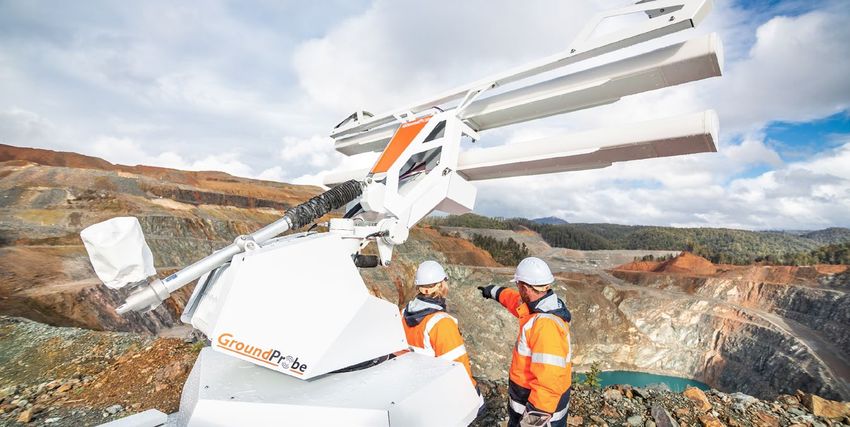
Safety, health & environment
Aligned with Orica’s core values                                                                     Safety is our
                                                                                                    priority. Always.

            Safety & health                               Environment
                                                                                                     We respect
 • Sustained fatality free operations, our    • No environmental incidents (category 3+)             and value all.
   primary goal
                                              • CHC intensity remains stable
 • Evolving and strengthening our Major
                                              • Continued deployment of our SHES
   Hazard program
                                                Management System
 • Driving a reporting and learning culture
                                                                                                       Together
                                                                                                      we succeed.

               Community                                      People

• Improved analysis of community sentiment    • Sustained improvement in organisational
  at key sites                                  health                                                We act with
                                                                                                       integrity.
• Celebrated 50 years of operations at        • Roll out of enhanced Orica Code of
  Kooragang Island                              Conduct
                                              • Continued progress towards Diversity and
                                                Inclusion goals
                                                                                                   We are committed
                                                                                                    to excellence.

                                                                                      2019 HALF YEAR RESULTS |        3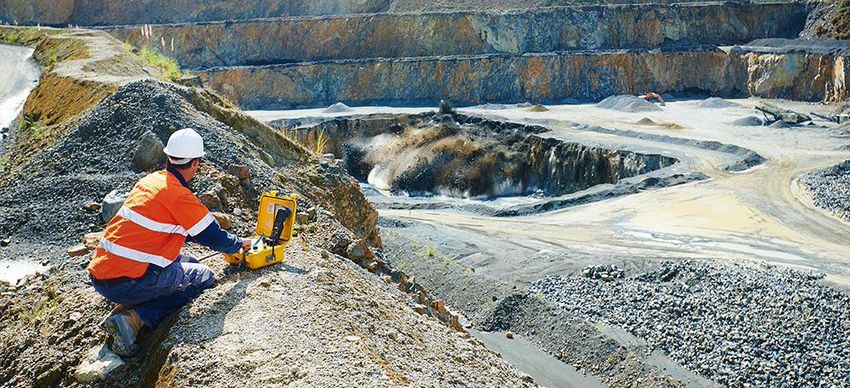
Results summary
Stronger first half operating performance

Total AN product volumes up 3%, mainly
                                                                                                                                                     Underlying
from Australia Pacific Asia (APA) and Latin                                       AN volumes                             EBIT                          NPAT1
America regions
EBIT significantly higher supported by:                                             1.88mt                           $301m                            $167m
     • strong performance across all regions                                             +3%                             +20%                             +35%
                                                                                       (pcp:1.83mt)                    (pcp:$252m)                      (pcp:$124m)
     • improved manufacturing performance
     • sustainable overhead reduction
Further adoption of technology products                                             Operating
                                                                                      cash                            Gearing                         Dividend
Burrup rectification works progressing
GroundProbeTM delivering above expectations
                                                                                    $184m                             38.1%                            22cps
Operating cash of $184m                                                               +>100%                            +2.4pts                   50% payout ratio
                                                                                        (pcp: $29m)                     (pcp:35.7%)            (pcp:20cps; 61.2% payout ratio)
Gearing within revised target range of 30-40%
Final dividend of 22 cents per share,
unfranked

1.   Equivalent to profit after income tax expense before individually significant items attributable to shareholders of Orica Limited disclosed in Note 2(b) within
     Appendix 4D – Preliminary Final Report

                                                                                                                                   2019 HALF YEAR RESULTS |              4
Australia Pacific & Asia
Increased market share from continued growth
   1H      2H       EBIT margin                                                          Volumes
                                                                                         • AN market share increase with continued growth
               AN volume (kt)                    EBIT and EBIT margin ($m)                   across most of the region, despite impact of weather on
                                                                                             the coal sector
                         884                                         215                 •   Higher Electronic Blasting Systems (EBS) sales,
                                                       197
          748      742            773                                                        particularly in Indonesia
    676                                          171                            174
                                                               167

                                                                                         EBIT
                                                 21%
                                                       22%     19% 21%          18%      • EBIT up 4% primarily from higher uptake of services
                                                                                             and improved manufacturing reliability, partly offset by
                                                                                             previously disclosed contract pricing
        2017        2018           2019            2017            2018           2019   •   Increased investment in plants enabling improved
                                                                                             reliability
                Revenue ($m)                       Revenue by commodity
                                                                                         •   Increased contribution from Indonesia
                         1,048
                                                             12%                         •   Further BM7TM uptake across customer sites and
                                  986                  6%    Thermal coal                    successful WebGenTM adoption
          893      896                                       Coking coal        36%
    833
                                                   9%        Gold
                                                             Iron ore                    Outlook
                                                             Copper
                                                    10%      Q&C                         • Higher 2H EBIT expected from normal seasonality
                                                             Other
                                                                                             weighting
                                                                          10%
                                                             17%                         •   EBS growth and contribution from new advanced
        2017         2018           2019                                                     products and services contracts
                                                                                         •   Continued improvement in manufacturing performance
                                                                                         •   East Coast market in balance and expect West Coast
Note all comparisons are to the prior corresponding period unless stated otherwise           to be in balance in next 2-3 years

                                                                                                                       2019 HALF YEAR RESULTS | 5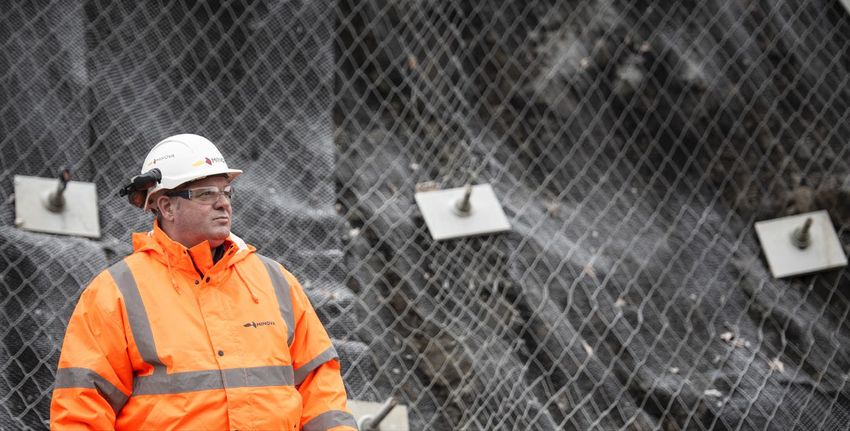
Burrup update
Permanent fix progressing; fundamentals remain strong

Rectification works
• All critical components (heat exchangers, drying drums and
    absorption column) being manufactured by suppliers, with
    delivery scheduled in September 2019
•   Rectification program being closely managed
•   Plant scheduled to ramp up and commence operations in
    1H20
•   Focus remains on ensuring reliable long term operation
                                                                Burrup TAN Plant
Outlook
• FY19: limited utilisation anticipated with marginal EBIT
                                                                 Average material moved for iron ore projected to increase
    contribution
•   FY20: ~50% Overall Equipment Effectiveness (OEE)
    expected following commencement of operations, weighted
    to 2H
•   D&A to commence when plant running reliably and on a
    continuous basis
•   Plant essentially loaded from FY20 with current contracts
•   Plant remains strategic 30+ year asset located in the
    Pilbara region of Western Australia; strong growth in
    material moved

                                                                Source: Australian Ore Material Moved (Open Cut), Wood Mackenzie, April 2019

                                                                                                2019 HALF YEAR RESULTS |              6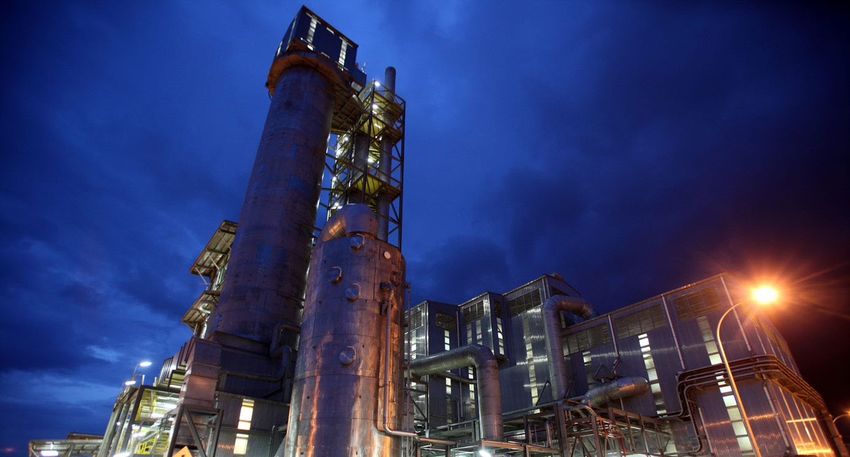
North America
Steady contribution across region
   1H      2H       EBIT margin
                                                                                           Volumes
               AN volume (kt)                    EBIT and EBIT margin ($m)                 • AN volumes stable with stronger demand in Canada
                                                                                               offsetting lower volumes in Mexico
                                                                                               – Quarry & construction volume slightly lower due to
    575
          546      560 553        560            97
                                                                      98
                                                                                   94
                                                                                                   unfavourable weather and tightening labour market
                                                       90
                                                                 88                        •   EBS sales up 8% predominately from strong customer
                                                                                               conversion in Canada and Mexico

                                                 15%
                                                                                           •   Successful conversion to technology based contracts
                                                       13%      13% 13%
                                                                               12%

                                                                                           EBIT
        2017        2018           2019            2017            2018             2019
                                                                                           • EBIT up 7% from higher services activity, improved
                Revenue ($m)                       Revenue by commodity                        emulsion and EBS conversions
                                                                      10%                  •   Improved manufacturing performance at Carseland
                                                          19%
                                                                              6%               and Brownsburg
                                                               Thermal coal
          700      689
                         741
                                  783
                                                               Coking coal                 •   Commenced cyanide spot sales
    662                                                        Gold
                                                   15%
                                                               Iron ore                    •   Improved market conditions drive stronger
                                                               Copper
                                                               Q&C
                                                                                               contribution from associates
                                                                               31%
                                                               Other
                                                         10%
                                                                 9%                        Outlook
        2017         2018           2019                                                   • Steady growth in volume and EBIT contribution
                                                                                               expected to continue in FY19
                                                                                           •   Further penetration of technology based productivity
Note all comparisons are to the prior corresponding period unless stated otherwise             solutions

                                                                                                                      2019 HALF YEAR RESULTS |    7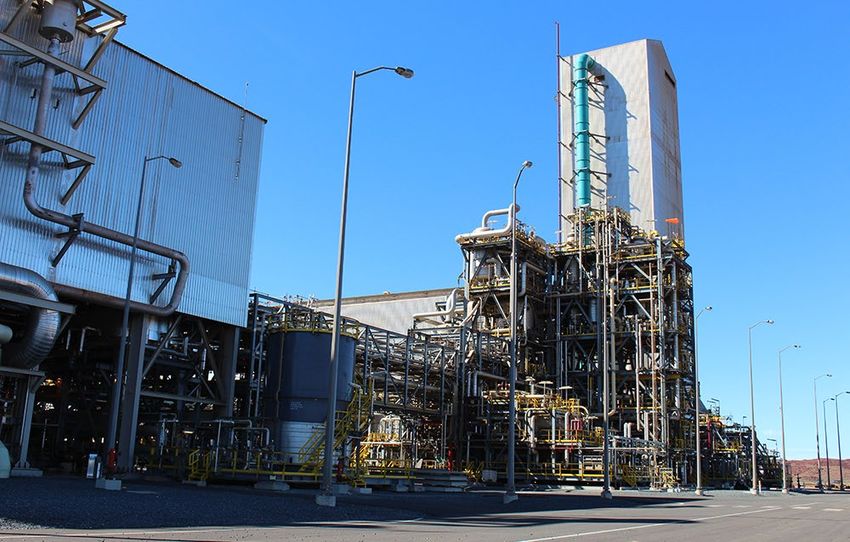
Latin America
Business performance recovery earlier than expected
   1H      2H       EBIT margin
                                                                                            Volumes
               AN volume (kt)                    EBIT and EBIT margin ($m)                  • Volumes up 10% with increased demand in Colombia
                                                                                                and Peru
                                                                                            •   Cyanide sales remain low due to customer mine plan
          333                     331
    304            301
                         317
                                                        32                                      changes
                                                 29
                                                                          24
                                                                   19               19
                                                                                            EBIT
                                                 7%
                                                                                            • EBIT and margin steady despite continued
                                                       7%         4% 5%             4%          competitive pricing pressure on explosives and lower
                                                                                                cyanide volumes
        2017        2018           2019            2017                2018          2019
                                                                                            •   Operational review complete with renewed customer
                Revenue ($m)                       Revenue by commodity                         focus and engagement in the region
                                                                  7%
                                                                                            •   Final roll through of partial loss of major contract
                                                             3%               18%               impact
          480            463
                   437            451                             Thermal coal
    435
                                                                  Gold
                                                                  Iron ore
                                                                  Copper
                                                                                            Outlook
                                                      42%
                                                                  Q&C
                                                                  Other
                                                                                    23%     • Business performance recovery expected to continue
                                                                                            • Benefits from new service and cyanide contracts, as
                                                                          7%                    well as further cost control, will continue to underpin
                                                                                                recovery in the region
        2017         2018           2019
                                                                                            •   Copper and gold fundamentals remain strong with
                                                                                                mine plans ramping up
Note all comparisons are to the prior corresponding period unless stated otherwise

                                                                                                                         2019 HALF YEAR RESULTS |     8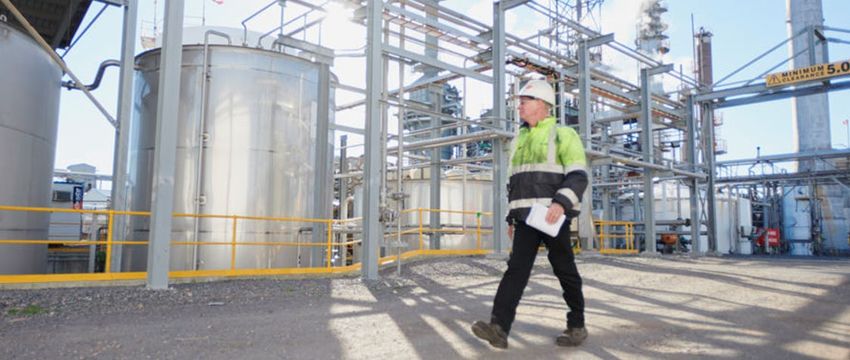
Europe, Middle East & Africa
Strong, sustainable performance from refocused business
   1H      2H       EBIT margin
                                                                                         Volumes
               AN volume (kt)                    EBIT and EBIT margin ($m)               • Strong AN volume in key growth regions including
                                                                                             Kazakhstan and Russia and Africa partially offsetting
                                                 44                                          lower volumes in Turkey due to continued weakness
          244
                   227 235                                             36
                                                                                             in economy
    224                           216
                                                       31                     30
                                                                                         •   Strong EBS volumes across all regions

                                                 11%
                                                                  19                     EBIT
                                                       7%         5% 9%      7%          • +50% EBIT improvement from:
                                                                                             – higher volumes in CIS and Africa and EBS growth
        2017        2018           2019            2017            2018           2019
                                                                                             – improved manufacturing performance
                Revenue ($m)                       Revenue by commodity                      – sustainable overhead cost reduction benefits
                                                                   1%
                                                                     1%                  •   Increased cyanide sales in Africa
                                                        24%
                                                              Thermal coal   23%
    402 410        391
                         416
                                  440                         Coking coal
                                                              Gold
                                                                                         Outlook
                                                              Iron ore
                                                              Copper
                                                                                         • Momentum from first half expected to continue;
                                                              Q&C             2%             growth will be underpinned by higher volumes across
                                                              Other
                                                                             8%              the region and a focus on EBS and new technology
                                                            41%                              offerings
        2017         2018           2019
                                                                                         •   2H19 EBIT expected to be similar to 2H18

Note all comparisons are to the prior corresponding period unless stated otherwise

                                                                                                                     2019 HALF YEAR RESULTS |   9
Auxiliaries                                   1

GroundProbeTM delivering above expectations
     1H        2H          EBIT margin
                                                                                 Sales
                 Revenue ($m)                     EBIT and EBIT margin ($m)      • Increased GroundProbeTM market share globally
                                                                                 • Entry into tunnels market
                                  55                                 10          • Early wins for innovation award winning high precision
                                                                                     laser products
                      41
                                                               6

          26                                                   15%
                                                                     18%
                                                                                 EBIT
                                                                                 • Strong performance from GroundProbeTM, EBIT
                                                   -1
                                                                                     ahead of investment case
                                                        -4%
                                                                                 •   Stable EBIT contribution from Nitro Consult, a blasting
               2018                    2019             2018              2019
                                                                                     consultancy business servicing the construction
                                                                                     industry

                                                                                 Outlook
                                                                                 • GroundProbeTM on track to deliver 10% RONA target
                                                                                     in first full year of ownership (FY19)
                                                                                     – ~15% RONA now expected earlier - within next
                                                                                         two years
                                                                                 •   Growing global focus on safety monitoring
                                                                                 •   Further expansion into tunnelling

1.   Includes GroundProbeTM and Nitro Consult

                                                                                                             2019 HALF YEAR RESULTS | 10
Minova
Turnaround starting to deliver sustainable benefits
1H 2H
Sales
Revenue ($m) EBIT ($m) Revenue by commodity • +20% increase in revenue in America, Canada,
6% 2% Australia and India due to a combination of increased
market share and higher demand from existing
7 Coal mining customers
280 291 25% Hard rock mining
239 Construction
2
Other
EBIT
67%
• Significant and sustainable EBIT uplift supported by
-4 increased pricing, higher volumes and sustainable
overhead reduction
2018 2019 2018 2019
• Lower fixed manufacturing costs from plant
rationalisation
Outlook
• EBIT run rate expected to continue into 2H19
• Additional product offerings and new market entries to
provide additional revenue and contribution in FY20
and beyond
Note all comparisons are to the prior corresponding period unless stated otherwise
2019 HALF YEAR RESULTS | 11FINANCIAL PERFORMANCE
CHRISTOPHER DAVIS, CHIEF FINANCIAL OFFICER
2019 HALF YEAR RESULTS | 12Financial result
Improvement in key financial metrics
Half year ended 31 March ($m) HY19 HY18 %
Sales revenue 2,829 2,532 12%
Underlying EBITDA 1 437 379 15%
Underlying EBIT 2 301 252 20%
Underlying NPAT 3 167 124 35%
Statutory net profit /(loss) after tax 33 (229) 114%
Effective tax rate 4 31.8% 30.7% 1.1pts
Earnings per share before individually significant items (cents) 5 43.9 32.7 34%
Total dividend per share (cents) 22 20 10%
1. EBIT before individually significant items plus depreciation and amortisation expense
2. Equivalent to profit/(loss) before financing costs and income tax disclosed in Note 2(b) within Appendix 4D – Orica Half Year Report
3. Equivalent to profit after income tax expense before individually significant items attributable to shareholders of Orica Limited disclosed in Note 2(b) within
Appendix 4D – Orica Half Year Report
4. Calculation excludes individually significant items as disclosed in Note 8 of Appendix 4D – Orica Half Year Report
5. Refer to Note 3 of Appendix 4D – Orica Half Year Report
2019 HALF YEAR RESULTS | 13Individually significant items
Non-cash one-off adjustments
Items ($m) Gross (before tax) Net (after tax)
Write down of defective Burrup assets (155.0) (108.5)
Impairment of IT assets (36.1) (25.3)
Total individually significant items (191.1) (133.8)
2019 HALF YEAR RESULTS | 14EBIT bridge
Strong performance across all regions and improved manufacturing
drives 20% increase in EBIT
Orica Group EBIT ($m)
1H18 to 1H19
2019 HALF YEAR RESULTS | 15Capital expenditure
Disciplined approach to capital management
Capital expenditure in line with expectations Capital expenditure1 ($m)
• Sustaining and Growth
– Maintenance at the Kooragang Island and Yarwun
plants in Australia and Bontang, Indonesia 350
322
– Ongoing investment in the global Mobile 306
Manufacturing Unit (MMU™) fleet, including BM7TM 28 66
– Assets for new contracts in Australia, Kazakhstan 29
23 50
and Russia
189
• SAP project 20
– Ramp up of the SAP project in line with expectations 51
– Full implementation expected to be completed by 226
206 37
1HCY20
• FY19 capital expenditure expected to be ~$350 81
million excluding the impact of capital expenditure
to replace the defective Burrup assets
FY17 FY18 1H19 FY19 Fct 2
Sustaining capital Growth capital
SAP project Burrup
1. Excludes capitalised interest
2. Excludes Burrup
2019 HALF YEAR RESULTS | 16Cash flow
Significant improvement in operating cash flow
Net Operating Cash Flow ($m) Cash Conversion (%)
615 90.5
72.1
466
66.5
312 586
37.4
184
155
29
FY17 FY18 FY19 1H18 1H19 1H18 1H19
1H 2H
Incl. Sustaining Capital1 Excl. Sustaining Capital2
1. (EBITDA add/less movement in trade working capital less sustaining
capital expenditure) / EBITDA
2. (EBITDA add / less movement in trade working capital) / EBITDA
2019 HALF YEAR RESULTS | 17Net debt & gearing
Maintaining a strong and flexible balance sheet through the cycle
Net debt & gearing ($m) Movement in net debt ($m)
Net impact $64m
1,906
1,768
54 1,712 56
1,648 118
41
1,768
1,648 38
36
1H18 FY18 1H19 FY18 Dividends Net Sub-total Non-cash 1H19
closing paid cash movements closing
1
Gearing % net debt generated on net debt net debt
1. Non cash movements comprise foreign exchange translation
2019 HALF YEAR RESULTS | 18STRATEGIC PRIORITIES
ALBERTO CALDERON, MANAGING DIRECTOR AND CEO
2019 HALF YEAR RESULTS | 19Our strategic priorities
Be the market leader in chosen segments; deliver superior returns on investment;
and generate strong free cash
Disciplined capital allocation across the portfolio
Manufacturing and Supply Blasting Field Services Productivity Solutions
Cost leader Market leader Value differentiator
Deliver shareholder value
2019 HALF YEAR RESULTS | 20Continuous plants
Improved AN manufacturing performance over past 18 months
Progress to date
AN plant OEE performance vs benchmark
• Continued improvements in Overall Equipment
100%
Effectiveness (OEE)1,2
• Improved turnaround management approach embedded 90%
– Planned turnarounds at Yarwun, Bontang and 80%
Kooragang Island undertaken in 1H19 with no cost
70%
overrun
– Increased daily production rates at all three sites 60%
post turnarounds
50%
• Roll out of standardised organisational structure FY17 FY18 1H19
• Bontang expansion progressed Bontang Yarwun Carseland
Kooragang Island Benchmark
Focus areas 100%
Yarwun AN OEE
(12 month rolling)
• Continued close management of Burrup rectification
program 80%
• Carseland 14 day turnaround to be completed in 2H19: Improved consistency
no other turnarounds scheduled 60%
• >80% OEE in all plants across the continuous network
• Cyanide: maximising sales and balancing supply 40%
20%
Apr May Jun Jul Aug Sep Oct Nov Dec Jan Feb Mar
1. OEE is amount of time spent running at quality, full rates vs demand
2. ~80% overall OEE achieved after removing impacts of turnarounds in the half
2019 HALF YEAR RESULTS | 21Initiating Systems and Packaged Emulsion plants
New technology implementation and substantial reduction in SKUs
Progress to date
• WebGenTM production commenced
• New EBS production line built at existing Initiating
Systems plant in Helidon, Queensland
• >50% SKU reduction. The initial phase of the project
has focused on removing obsolete or superseded
products and materials
Focus areas
• Increased capacity in the EBS and WebGenTM network SKU rationalisation
to support growing demand globally >50%
• Product portfolio optimisation to continue with benefits +40k units
expected to be recognised over the next 3-5 years.
Benefits include:
– Customer security of supply
– Increased plant utilisation rates ~19k units
– Significant reductions in trade working capital and
costs across the network Target
Sep-18 Mar-19 Sep-21
2019 HALF YEAR RESULTS | 22Customer adoption of
TM
technology solutions
Wireless blasting - WebGen
WebGenTM Units fired Blasts by region
• Growing market interest for wireless initiation
technology 3 53
– +130 blasts fired globally
+600%
– Several commercial services contracts secured
– Demonstrations underway currently across 13 59
customers
18
– 28 target trial sites across all regions by end FY19
• Trials in place for expansion into surface applications HY18 HY19
(coal, iron ore, copper)
• Good progress made on next generation WebGenTM200
Increased Ore Recovery Improved Safety
+34%
“We see WebGen technology as a game
changer that is enabling us to lead the industry
Increased Productivity Reduced Costs
in block cave mine design and planning”
Rob Cunningham, Mine Manager +20%
CMOC Northparkes
2019 HALF YEAR RESULTS | 23Customer adoption of technology solutions
Digitally transforming blasting
Orica’s Digital Solutions Implementations Uptake by region
• 18 implementations of Next Generation BlastIQ™
3 5
• 15 customers1, including tier 1 miners
• 10 trials in progress +450%
• 2 major product releases 5
5
Bulkmaster™
HY18 HY19
• 22 Bulkmaster™ 7 smart, connected MMU™s deployed
• 9 Australian sites; 6 customers
• Trials planned for 7 units in Latin America Reduced Drill Costs Improved Safety
• Industry segments: Gold, Copper, Iron Ore, Met Coal,
Thermal Coal, Lithium -10%
Improved Regulatory
Increased Productivity Compliance
+5%
1. Old Generation BlastIQ™ has more than 100 customers using the platform,
with migration plans developed.
2019 HALF YEAR RESULTS | 24OUTLOOK
ALBERTO CALDERON, MANAGING DIRECTOR AND CEO
2019 HALF YEAR RESULTS | 25OUTLOOK
2019 financial year:
• The outlook for the full year result remains unchanged from our prior guidance in November 2018
with our earnings weighted approximately 45/55 across the halves
• Lower utilisation from the Burrup plant in the second half is expected to be mitigated by accelerated
business improvement initiatives
2020 financial year:
• Stronger EBIT run rate from the second half of the 2019 financial year expected to continue into the
2020 financial year, based on the following assumptions:
– AN volume growth supported by commodity growth and mine plan outlook
– AN pricing expected to remain firm
– Improved reliability and operating efficiency across the manufacturing network
– Further benefit of technology product adoption and continued services uptake
– Burrup plant rectification works expected to be completed in the first half of 2020 as previously indicated
– No material changes to market, economic or regulatory environments
Looking forward:
• Positive momentum is expected to continue, with solid demand and supply dynamics and further
operating leverage benefits
1. See Slide 28 in Supplementary Information Section
2019 HALF YEAR RESULTS | 26SUPPLEMENTARY
INFORMATION
2019 HALF YEAR RESULTS | 27FY19 outlook (as disclosed on 2 November 2018)
Improved operating leverage underpins a stronger FY19 result
Higher revenue and EBIT will be underpinned by increased demand and manufacturing improvements,
with earnings skewed to the second half of the year.
Key assumptions for FY19:
• Global AN product volumes expected to be ~3% higher than FY18 from North America, Australia
Pacific Asia and EMEA
Operations • Continued firming of AN pricing across most regions
• Contribution from new advanced products and services contracts in second half
• EBIT growth expected from all regions/businesses except Latin America
• Improved average utilisation rates expected in operational manufacturing plants
Manufacturing • ~20% utilisation rate expected at Burrup TAN plant as construction continues in order to get the
plant available for use at its nameplate capacity; skewed towards second half. Marginal impact,
relative to FY18, expected in FY19
• ~$25 million negative impact from previously disclosed (FY18) deferred contract renewals and price
Other reset flow through; offset by business streamlining benefits
• Interest expense to be similar to FY18
• FY19 capital expenditure expected to be ~$350 million due to higher sustaining capital spend on
Capital manufacturing plants, continuous investment in the MMU fleet and SAP implementation ramp up
• Depreciation and amortisation expense to be ~10% higher than FY18
2019 HALF YEAR RESULTS | 28Explosives volumes
Variance – 1H19 volumes
Half year ended 31 March 1H19 volumes
vs. 1H18 volumes
‘000 tonnes AN 1 Emulsion Total AN 1 Emulsion Total
products2 products2
Australia Pacific & Asia 312 461 773 12% 0% 4%
North America 285 275 560 (5%) 6% 0%
Latin America 111 220 331 27% 3% 10%
Europe, Middle East & Africa 19 197 216 6% (6%) (5%)
Auxiliaries 1 1 2 n/a n/a n/a
Total 728 1,154 1,882 6% 1% 3%
1. Ammonium Nitrate includes prill and solution
2. Emulsion products include bulk emulsion and packaged emulsion
2019 HALF YEAR RESULTS | 29Segment analysis
Half year ended 31 March 1H19 1H18
EBIT %
$m Revenue 1 EBIT Revenue 1 EBIT
change
Australia Pacific & Asia 986 174 896 167 4%
North America 783 94 689 88 7%
Latin America 451 19 437 19 0%
Europe, Middle East & Africa 440 30 391 19 58%
Auxiliaries 55 10 26 (1) >100%
Minova 291 7 239 (4) >100%
Global Support 621 (31) 522 (35) 11%
Eliminations (798) - (667) - -
Total 2,829 301 2,532 252 20%
1. Includes external and inter-segment sales
2019 HALF YEAR RESULTS | 30Diversified global business
Geographic portfolio By commodity By product/service offering
% of 1H19 revenue 1 % of 1H19 revenue 1 % of 1H19 revenue 1
4%
10% 16%
2% 17% 10%
26%
33% Thermal Coal AN/ANFO
15% Australia Pacific & Asia Coking Coal 5% Bulk Emulsion
13%
North America Iron Ore Packaged Products
Latin America Initiating Systems
Q&C 7% Mining Chemicals
Europe, Middle East & Africa
Copper Onsite Services
Auxiliaries
Gold 5% Resins/Powders/Steel 29%
Minova
Other Other
15% 12%
20%
16%
26% 13% 7%
31
1. Excludes inter-segment sales
2019 HALF YEAR RESULTS | 31Interest cover
Half year ended 31 March ($m) 1H19 1H18 Change
EBIT before individually significant items 301 252 49
Net financing costs 56 54 2
Interest cover (times) 5.4x 4.6x 0.8x
2019 HALF YEAR RESULTS | 32Foreign exchange exposure
EBIT composition (FX transaction) HY19 FX movements EBIT sensitivity1
% of HY19 EBIT % change from pcp +/- $m per 1% change
United States 7.9% 0.6
8%
22%
11% Canada 4.1% 0.6
Australia
United States Latin America (4.4%) 0.6
Canada
Latin America
19% EMEA 2 (4.1%) 0.3
EMEA
Asia 21%
Asia 6.9% 0.3
19% Total $2.4m
• Basket of ~45 currencies translated to AUD earnings
• Broad distribution of earnings provides some insulation against cyclical currency fluctuations
1. Sensitivity based on 6 month EBIT result
2. Europe, Middle East and Africa
2019 HALF YEAR RESULTS | 33Debt profile
Facility headroom ($m) Drawn debt maturity profile ($m)
Average tenor at March 2019 – 4.8 years
700
600
1,383 1,230 500
400
300
2,163 2,232 200
100
0
Sep-18 Mar-19 FY19 FY20 FY21 FY22 FY23 FY25 FY26 FY27 FY31
Drawn Undrawn Committed bank facilities US private placement
Export credit finance Other ¹
• In March 2019, committed bank facilities totalling $715 million were refinanced with existing lenders
• This involved a refinancing of 2019 commitments totalling $340 million and a pre-financing of 2020 commitments
totalling $375 million, effecting a desired extension in the committed financing facilities
• A US$100 million bond matured in October 2018 and was financed with existing cash and credit lines
1. Includes overdraft, lease liabilities and other borrowings
2019 HALF YEAR RESULTS | 34Net debt & gearing
Financial year ended 31 March ($m) 1H19 Movement in net debt ($m)
EBITDA 437
Net impact $64m
Movement in trade working capital (55)
1,768
Movement in non trade working capital (88)
1,712
56
Net interest & tax paid (139) 1,648
117
Non cash items & foreign exchange 29
(184)
129
Net operating cash flows 184
Capital expenditure (189)
Other investing activities 60
Net investing cash flows (129)
Dividends paid (118)
Share transactions 1
Net financing cash flows (117)
FY18 Net Net Net Sub-total Non-cash 1H19
Gearing (%) 1 38.1% closing operating investing financing movements closing
2
net debt cash flows cash flows cash flows on net debt net debt
1. Net debt / (net debt + equity)
2. Non cash movements comprise foreign exchange translations
2019 HALF YEAR RESULTS | 35Non-IFRS reconciliation
Half year ended 31 March ($m) 1H19 1H18 %
Statutory net profit/(loss) after tax 33 (229) 114%
Add back: Individually significant items after tax 134 353 62%
Underlying profit after tax 167 124 35%
Adjust for the following:
Net financing costs 56 54 (4%)
Income tax expense 1 78 61 (28%)
Non-controlling interests 1 - 13 100%
EBIT 301 252 20%
Depreciation and amortisation 136 127 (7%)
EBITDA 437 379 15%
1. Excludes individually significant items
2019 HALF YEAR RESULTS | 36Definitions
Term Definition
AN Includes Ammonium Nitrate prill and solution as well as Emulsion products including bulk emulsion and packaged emulsion
Comprises total payments for property, plant and equipment and intangibles as disclosed in the Statement of Cash Flows within Appendix 4D –
Capital expenditure
Orica Half Year Report
Equivalent to profit/(loss) before financing costs and income tax expense disclosed in Note 2(b) within Appendix 4D – Orica Half Year Report, before
EBIT
individually significant items
EBIT margin EBIT / Sales. EBIT refers to Underlying EBIT unless otherwise stated
EBITDA EBIT plus Depreciation and Amortisation expense. EBITDA refers to Underlying EBITDA unless otherwise stated
EBS Electronic Blasting Systems
Gearing % Net debt / (net debt + total equity)
Growth capital Capital expenditure that results in earnings growth through either cost savings or increased revenue
Net debt Total interest bearing liabilities less cash and cash equivalents as disclosed in Note 9 within Appendix 4D – Orica Half Year Report
Net operating and investing Equivalent to net cash flows from operating and investing activities (as disclosed in the Statement of Cash Flows within Appendix 4D – Orica Half
cash flows Year Report
Non trade working capital Comprises other receivables, other assets, other payables and provisions
Equivalent to profit after income tax expense before individually significant items attributable to shareholders of Orica Limited disclosed in Note 2(b)
NPAT
within Appendix 4D – Orica Half Year Report
OEE Overall Equipment Effectiveness - the amount of time spent running at quality, full rates vs demand
Payout ratio Dividends per share for the year / Earnings per share
pcp Prior corresponding period
12 month EBIT / Rolling 12 month Average Operating Net Assets where Operating Net Assets = Property, Plant & Equipment, Intangibles,
Return on net assets (RONA)
Investments in Associates and working capital excluding environmental provisions
SHES Safety, Health, Environment and Security
Sustaining capital Other capital expenditure which is not considered growth capital
Trade working capital (TWC) Comprises inventories, trade receivables and trade payables disclosed within Appendix 4D – Orica Half Year Report
TWC movement Opening TWC less closing TWC (excluding TWC acquired and disposed of during the year)
2019 HALF YEAR RESULTS | 37You can also read