2019 FULL-YEAR RESULTS - Jaarverslag.com

Page created by Lloyd Ortega
 
CONTINUE READING
2019 FULL-YEAR RESULTS - Jaarverslag.com
2019 FULL-YEAR RESULTS
2019 FULL-YEAR RESULTS - Jaarverslag.com
Disclaimer

Unibail-Rodamco-Westfield S.E., a Société Européenne à Directoire et Conseil de Surveillance incorporated under French law, is a listed property investment
company. Unibail-Rodamco-Westfield S.E. is listed on Euronext Amsterdam and Euronext Paris. The value of your investment may fluctuate. Past performance is no
guarantee for the future.

The information in this presentation has been included in good faith but is for general informational purposes only. All reasonable care has been taken to ensure
that the information contained herein is not untrue or misleading. It should not be relied on for any specific purpose and no representation or warranty is given as
regards its accuracy or completeness.

Certain of the statements contained in this release are statements of future expectations and other forward-looking statements. These expectations are based on
management's current views and assumptions and involve known and unknown risks and uncertainties. Actual results, performance or events may differ materially
from those in such statements due to, among other things, (i) general economic conditions, in particular economic conditions in the core markets of Unibail-
Rodamco-Westfield S.E., (ii) performance of financial markets, (iii) interest rate levels, (iv) currency exchange rates, (v) changes in laws and regulations, and (vi)
changes in the policies of governments and/or regulatory authorities. Unibail-Rodamco-Westfield S.E. assumes no obligation to update any forward-looking
information contained in this document. Any opinions expressed in this presentation are subject to change without notice. The presentation should not be
regarded by recipients as a substitute for the exercise of their own judgment. Investors should seek financial advice regarding the appropriateness of investing in
any securities or investment strategies discussed or recommended in this presentation and should understand that statements regarding future prospects may not
be realised. It does not constitute an offer to purchase any securities or a solicitation to purchase or subscribe securities neither in the United States nor in any
other country where such offer or solicitation is restricted by applicable laws or regulations.

Neither Unibail-Rodamco-Westfield S.E. nor any affiliates nor their or their affiliates’ officers or employees shall be liable for any loss, damage or expense arising
out of any access to or use of this presentation, including, without limitation, any loss of profit, indirect, incidental or consequential loss.

No reproduction of any part of the presentation may be sold or distributed for commercial gain nor shall it be modified or incorporated in any other work,
publication or site, whether in hard copy or electronic format.

                                                                                                                                                 2019 HALF-YEAR RESULTS   2
2019 FULL-YEAR RESULTS - Jaarverslag.com
URW delivers

                                   AREPS                                                                 €12.37            Exceeding guidance

                             DISPOSALS                                                                   €4.8 Bn   (1)
                                                                                                                              ≥ Bookvalue

                           OPERATIONS                                                                  +3.1% Lfl NRI      in Continental Europe

                        TENANT SALES                                                                      +3.7%                Groupwide

                                      CSR                                                                                Extended and recognized

(1)   Disposals closed since June 2018 and announced disposal of five French assets
(2)   NB: All terms in this presentation are defined in the Appendix to the Press Release, which can
      be found on URW’s website: www.urw.com                                                                                                2019 FULL-YEAR RESULTS   3
2019 FULL-YEAR RESULTS - Jaarverslag.com
FINANCIAL RESULTS
2019 FULL-YEAR RESULTS - Jaarverslag.com
2019 Full-Year Results
  € Mn                                                                                              FY-2019                  FY-2018(1)    Growth   Lfl Growth
  Shopping Centres                                                                                      2,293                 1,912        +19.9%     +3.1%
  Offices & Others                                                                                          103                 149        -30.9%     -1.2%
                                                                                                                                                               (2)
  Convention & Exhibition                                                                                      95               100         -4.7%     +3.4%
  Net Rental Income                                                                                     2,491                 2,161        +15.3%    +3.0%

  Recurring Net Result (Group share)                                                                    1,760                 1,610         +9.3%
  Recurring EPS                                                                                         12.72                 13.15         -3.3%
  Adjusted Recurring EPS(3)                                                                          12.37                    12.92        -4.3%

  Per share data (€)                                                                          Dec. 31, 2019                Dec. 31, 2018   Growth
  EPRA NAV                                                                                          213.30                   221.80        -3.8%

  Going Concern NAV                                                                                     217.50                233.90        -7.0%
  EPRA NNNAV                                                                                            199.20                210.80        -5.5%
(1)   URW results include the contribution of former Westfield (WFD) from June 1, 2018. 2018 figures were restated
      as follows: hotel assets were transferred from the Convention & Exhibition segment to the Offices & Others segment
      and one asset was reclassified from the Shopping Centres segment to the Convention & Exhibition segment
(2)   Restated for Intermat
(3)   The Adjusted Recurring Earnings are calculated based on the Recurring Net Result for the period attributable
      to the holders of the Stapled Shares minus the coupon on the Hybrid Securities
(4)   Figures may not add up due to rounding                                                                                                         2019 FULL-YEAR RESULTS   5
2019 FULL-YEAR RESULTS - Jaarverslag.com
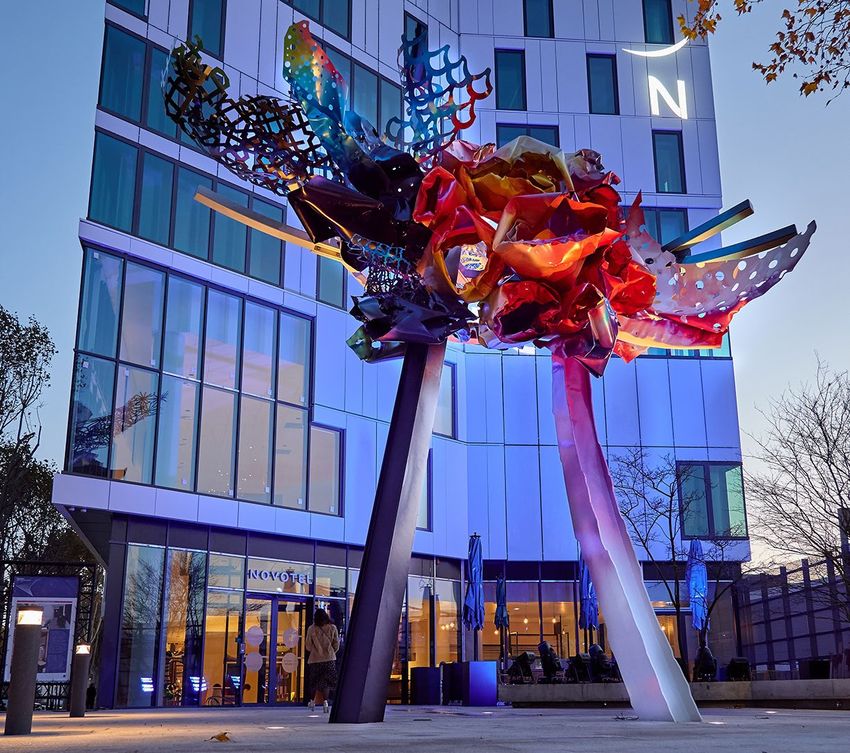
CONTINENTAL EUROPE HIGHLIGHTS
2019 FULL-YEAR RESULTS - Jaarverslag.com
URW’s tenant sales growing                                                                                     14.1%

  and outperforming                                                                                                        3.5%

                                                                                                                     Nordics

                                                                                                                                  3.9%
                                                                                                          4.4%                           2.2%
                                                                                                                 3.5%

                                                                                                                               Central Europe
          5.2%                             5.5%
                                                                                                           Germany

                                                                2.2%                        5.4%

                                                                                                                  0.7%         0.7%
                                                                                                   1.6%
  Shopping Centres                      Flagships            National Sales                                             Austria
                                                                Indices
                                                                                              France

                                                                                     2.5%
                                                                              1.8%

                                                                                 Spain

All data YTD November 30, 2019, unless otherwise indicated                                                                                      2019 FULL-YEAR RESULTS   7
2019 FULL-YEAR RESULTS - Jaarverslag.com
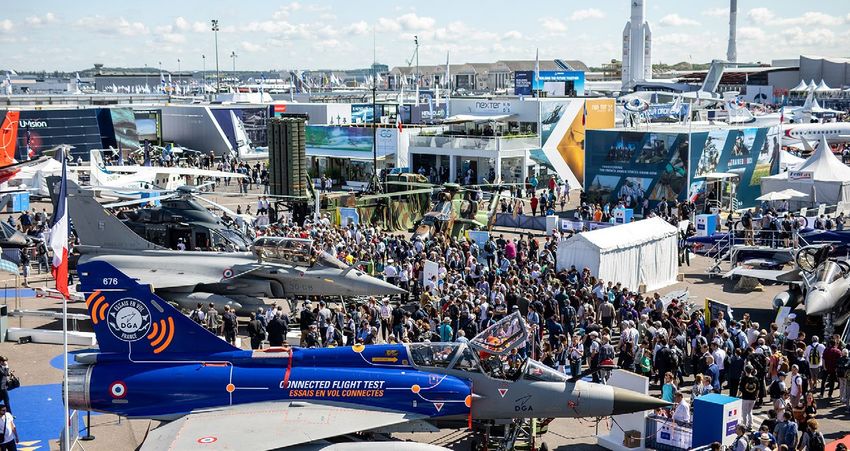
URW consistently outperforms the market

                                                                               URW cumulative growth: +23.7%             Avg NSI cumulative growth: +8.4%

                                                                                                                                         +5.2%
                                                       +4.6%
                                                                                                   +3.9%
                                                                                                                        +3.0%
                                       +2.4%                   +2.2%
                                                                                                                                                      +2.2%
                                                                                                             +2.1%
                                                                                 (1)
                                                                                       +1.6%
                                                                            +1.4%
      +1.1%                                                                                                                     +1.0%
                                               +0.5%

            2013                            2014          2015                 2016                      2017              2018                 2019

                  -1.4%

                                                         URW tenant sales              Average national sales indices

(1)   +5.4% including Mall of Scandinavia                                                                                               2019 FULL-YEAR RESULTS   8
2019 FULL-YEAR RESULTS - Jaarverslag.com
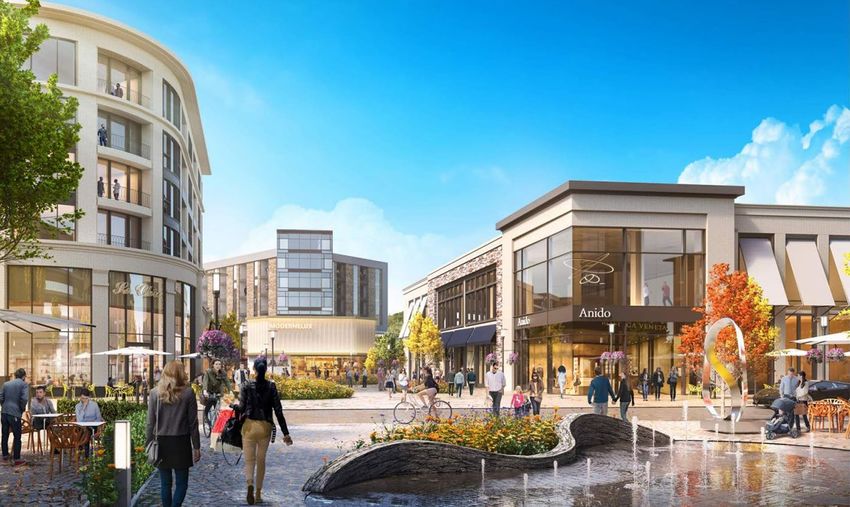
Differentiating segments performing very well
   +211%

                        +7.5%                  +7.0%
                                                                                       Glòries
                                                        +6.9%
                                                                  +5.1%

                                                                             +2.2%

       Auto           Entertainment             Sport    Dining    Health    Fashion
                                                                  & Beauty

                           39% of 2019 lettings (GLA)                                  Westfield Vélizy 2, Dining Extension

All sales data YTD through November 30, 2019                                                                                  2019 FULL-YEAR RESULTS   9
2019 FULL-YEAR RESULTS - Jaarverslag.com
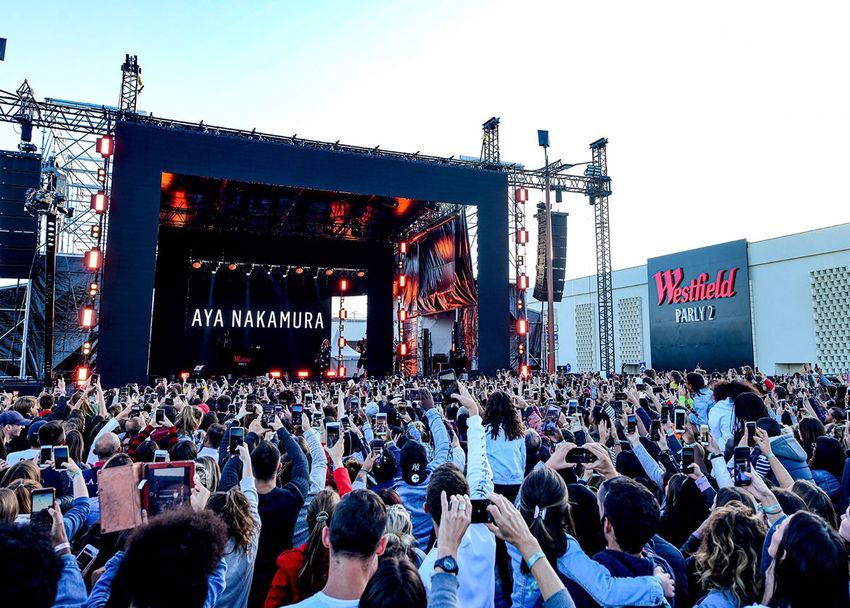
Driving healthy MGR uplifts

                                              Leases signed: 1,367           Rotation rate: 10.6%

            19.6%
                    18.2%
                              17.4%
    15.3%                             14.7%
                                                                                    13.9%
                                                      11.7%          12.0%

    2013    2014    2015      2016    2017            2018            2019        2019 Flagships

                                                                                   2019 FULL-YEAR RESULTS   10
Delivering solid retail Lfl NRI growth
  Net Rental Income (€ Mn)                                                      FY-2019                FY-2018(1)   Growth   Lfl Growth
  France                                                                             663                 647         +2.5%     +2.8%
  Central Europe                                                                     223                 212         +5.4%     +4.0%
  Spain                                                                              157                 155         +0.8%   +10.5%
  Nordics                                                                            123                 141        -13.3%     -2.6%
  Austria                                                                            111                 108         +3.5%     +2.5%
  Germany                                                                            143                 140         +2.8%     +0.0%
  The Netherlands                                                                      62                  59        +5.8%   +10.7%
  Total Continental Europe                                                      1,483                  1,462        +1.4%     +3.1%
  United States                                                                      653                  351         n.m.

  United Kingdom                                                                     157                   99         n.m.

  Total                                                                          2,293                 1,912        +19.9%
(1)   URW results include the contribution of former Westfield (WFD) from June 1, 2018. 2018 figures
      were restated as follows: one asset was reclassified from the Shopping Centres segment
      to the Convention & Exhibition segment
Figures may not add up due to rounding                                                                                         2019 FULL-YEAR RESULTS   11
UK & US ACTIVITY
WITHSTANDING CHALLENGING MARKETS
Operating metrics UK

               FY-2019   FY-2018

Tenant Sales    +4.7%     +2.8%

Footfall        +2.8%     +6.1%

MGR Uplift     +11.1%    +19.8%

Lfl NRI         -4.2%     +3.4%

EPRA Vacancy     7.7%      7.4%
                                   Westfield Stratford City

                                                              2019 FULL-YEAR RESULTS   13
Making progress in a tough market

                          YTD Nov. 30,      vs. national
                             2019          average (bps)

 Tenant Sales               +5.3%            +550

 Footfall                   +3.4%            +530

                          EPRA occupancy

                FY-2018       HY-2019         FY-2019

                89.5%          88.3%          89.2%

                96.7%          95.0%          96.0%
                                                           Westfield London

                                                                              2019 FULL-YEAR RESULTS   14
Operating metrics US
                                                                                                                                                       Specialty Sales
                                                                                                                                          Sales             psf
                                     Comp NOI Growth (%)                      Occupancy (%)                      Rental Spreads (%)    Growth (%)(1)    Growth (%)(2)

                                   FY-2019                       FY-2018   FY-2019     FY-2018               FY-2019         FY-2018     FY-2019             FY-2019

 US                                 +2.4                          -1.6     94.8          95.6                 +1.6             +7.5       +1.6                +5.1

 Flagships                          +5.4                          -0.3     96.2          96.2                 +4.7           +11.5        +3.2                +4.3
 Regionals                              -6.8                      -4.7       92.9        94.8                    -8.5          -1.6         -2.1                +4.3

Westfield UTC                                                                                 Westfield Mission Valley

(1)   Total tenant sales excluding department stores and Tesla
(2)   Excluding Tesla                                                                                                                              2019 FULL-YEAR RESULTS   15
Key US take-aways of June 2019 IR Days

                URW US not a proxy                                            Foundation of an effective   Clear short, mid, and long-
                  for the market                                                organization in place       term business objectives

        Small number of assets                                                New governance structure     Starting 2nd round
                                                                                                           of 5-Year BP to fine-tune
        70% of GLA in A malls                                                 Operating management
                                                                                                           asset strategies
                                                                              function in place
        83% of GMV in Flagships
                                                                                                           ERV exercise gives clear
                                                                              Reinforced leasing team
        61% of GMV in California                                                                           direction for Leasing Action
                                                                              and capabilities
                                                                                                           Plans
                                                                              First US talent review
                                                                                                           Close monitoring
                                                                              completed
                                                                                                           of Development projects
                                                                                                           with strong focus on ROI

NB: from "Operational and Strategic Update On The US Business" presentation                                                 2019 FULL-YEAR RESULTS   16
US: implementing our clear plans

Reinforcing leasing to improve occupancy

                   91%          95%                           92%               96%

Honey Birdette     Javier’s                Bake Cheese Tart   Dyson

Hermès             Kate Spade              Del Frisco’s       Happy Socks

                                                                            2019 FULL-YEAR RESULTS   17
US: implementing our clear plans

  Proactively re-tenanting to improve the mix
                                      GLA signed in 2019(1)                                                      Total change in GLA 2013-2019(2)

                     18.9%
                                                                                                                      +34.6%

                                                                                                                                    +28.0%
                                                   11.9%
                                                                                                        +22.5%

                                                                                  5.3%

                                                                                                                                                         Fashion

                                                                                                        Dining     Entertainment    Health &
                     Dining                  Entertainment              Health & Wellness                                           Wellness

                                                                                                                                                         -12.5%
                Strategic categories: 36% of GLA signed                                                Strategic categories: 28% of GLA

(1)   % GLA signed for deals for each category over total portfolio GLA signed, excluding department
      stores
(2)   Excluding department stores                                                                                                            2019 FULL-YEAR RESULTS   18
US: implementing our clear plans

  Transforming big-boxes

                                                 Pre-letting(1)            100% TIC   Delivered            Pre-letting(1)      100% TIC           Delivery
                                                 99%                       €50 Mn     H2-2019              50%                 €240 Mn            H2-2021

      Before                                                       After                          Before               After

(1)    Pre-letting: GLA signed, all agreed to be signed and financials agreed                                                             2019 FULL-YEAR RESULTS   19
US: implementing our clear plans

  Deliveries

 # of apartments                 Delivered                 URW ownership       GLA                     Delivery   URW ownership   100% TIC               Pre-Letting(1)
 300                             H2-2019                   50%                 +46,700 sqm             H1-2020    50%             €1,050 Mn              80%

Palisade at Westfield UTC                                                      Westfield Valley Fair

(1)   Pre-letting: GLA signed, all agreed to be signed and financials agreed                                                                 2019 FULL-YEAR RESULTS   20
We are executing on our regional mall plans

                                              2019 FULL-YEAR RESULTS   21
STANDING OUT IN
THE RETAIL (R)EVOLUTION
Leveraging 1.2 billion annual visits

                                             URW’s mission: "Reinvent being together"

Westfield Parly 2, Aya Nakamura   Westfield Les 4 Temps, John Legend        Westfield World Trade Center, Christmas market   CentrO, NFL event

Westfield Rosny 2, Kendji Girac   Westfield Mall of Scandinavia, Rita Ora   Westfield Century City, Lovely the Band          Westfield London, Elle Weekender event

                                                                                                                                                   2019 FULL-YEAR RESULTS   23
All retail is not equal…

                       Highest footfall locations                                                 Best catchment areas

                       Best connected locations                                                   Constant reinvention

NB: Please see June 2019   Investor   Days   presentations   for   references,   available   at
www.urw.com/investordays                                                                                                 2019 FULL-YEAR RESULTS   24
Retail is about retailers

   2,621 leases signed                                         803,500 sqm                  €432 Mn MGR

                                                                                                          Westfield UTC, Under Armour

      1,157 re-lettings                                        293,300 sqm                  €201 Mn MGR

o/w with increased GLA                                           36,000 sqm                 €30 Mn MGR

                                                                                                          Westfield Les 4 Temps

NB: Data shown reflects leasing for the Group (inc US and UK) in 2019. Sqm refers to GLA.
MGR for the US includes CAM                                                                                                             2019 FULL-YEAR RESULTS   25
Expanding key categories: Dining and Entertainment
                     Signed                                            New stores opened
                     160,400 sqm                                       98,300 sqm

                     Westfield Vélizy 2, UGC Ciné Cité                                     CentrO, dining area

                     Westfield Valley Fair, Icon cinema                                    Westfield London, food court

NB: Leasing for the Group in GLA. Signed = renewals and new lettings
                                                                                                                          2019 FULL-YEAR RESULTS   26
Expanding key categories: Sport, Health & Beauty
                     Signed                                            New stores opened
                     102,000 sqm                                       43,400 sqm

                     Westfield Century City                                                CentrO

                     Westfield Stratford City, JD Sports, +3,100 sqm                       Westfield London

NB: Leasing for the Group in GLA. Signed = renewals and new lettings
                                                                                                              2019 FULL-YEAR RESULTS   27
Expanding key categories: DNVBs
                     Signed                                            New stores opened
                     8,100 sqm                                         5,900 sqm

                     Westfield San Francisco Centre                                        Westfield London

                     Westfield Topanga                                                     Westfield Garden State Plaza

NB: Leasing for the Group in GLA. Signed = renewals and new lettings
                                                                                                                          2019 FULL-YEAR RESULTS   28
Expanding key Fashion retailers
                     Signed                                            New stores opened
                     296,200 sqm                                       69,100 sqm

                     Westfield London                                                      Stadshart Amstelveen

                     Westfield Les 4 Temps                                                 Westfield Forum des Halles

NB: Leasing for the Group in GLA. Signed = renewals and new lettings
                                                                                                                        2019 FULL-YEAR RESULTS   29
New revenues: brand events & commercial partnerships
     2019 Total Group                         Continental Europe
     €118 Mn                                  +11.2%

     CentrO, Christmas market                                      Westfield London, Samsung Galaxy kiosk

     Westfield Les 4 Temps, digital screens                        Westfield World Trade Center, Gucci kiosk

                                                                                                               2019 FULL-YEAR RESULTS   30
Retailer failures are proactively
managed and relet
                        Cont. Europe        UK            US            URW
# of stores                  203            50            195           448

Trading - no rent cut         88            20             74           182

Trading - rent cut            17            11             20            48

Replaced                      56             5             35            96

Trading or replaced         79%            72%           66%            73%

Vacant                       42             14             66           122

              Annualized potential exposure: 3.2% of Group retail MGR

         Annualized spot exposure: 1.0% of Group retail MGR

                                                                              2019 FULL-YEAR RESULTS   31
OFFICE AND C&E
Offices & Others: results reflect disposals

 Net Rental Income
 (€ Mn)                                 FY-2019              FY-2018(1)               Growth       Lfl Growth

 France                                     72                   124                  -41.8%         -1.5%

 Nordics                                    10                     11                   -9.0%        -6.1%

 Others                                       7                      6               +33.2%         +11.4%

 US                                         13                       8                      n.m.       n.a.

 Total                                    103                    149                 -30.9%         -1.2%

                                                                                                                Shift, Issy-les-Moulineaux

(1)   FY-2018 is restated to include the NRI of hotel assets, which were transferred from
      the Convention & Exhibition segment to the Office & Others segment                                                                     2019 FULL-YEAR RESULTS   33
Convention & Exhibition: an excellent year

                                                                          Growth                                 Growth
                                                                  (1)                                     (1)
 € Mn                             FY-2019             FY-2018            2019/2018            FY-2017           2019/2017

 Net Rental
                                      95                 100                -4.7%                    91           +4.7%
 Income

                                                                                                                            Paris Le Bourget, Paris Air Show, 316,000 visitors
 Property Services
                                      62                   65               -4.8%                    50          +23.6%
 & Other Income

 Recurring Net
 Operating                         157                  165                -4.8%                    141         +11.4%
 Income

                                                                                                                            Paris Porte de Versailles, 32,000 attendees

(1)   FY-2017 and FY-2018 are restated to exclude the NRI of hotel assets, which were transferred
      from the Convention & Exhibition segment to the Office & Others segment. In 2019,
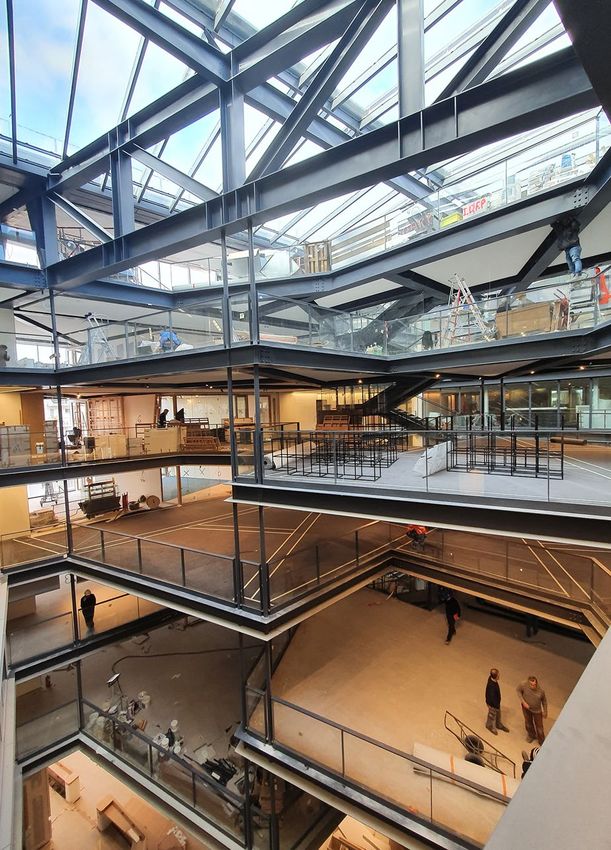
      Les Boutiques du Palais was reclassified from French retail to Convention & Exhibition                                                                              2019 FULL-YEAR RESULTS   34
Convention & Exhibition: building the future
             A congress venue recognized globally                                                              Delivery of new venue & hotels

Paris Convention Centre, European Society of Cardiology and the World Heart Federation    Paris Porte de Versailles, New Pavilion 6   Paris Porte de Versailles, Novotel

    # of congresses                                                                  st
    96 (+7%)                                                                    1
    Congress revenues
    €26 Mn (+12%)                                           destination for congresses
                                                                      by ICCA
                                                                                          Paris Porte de Versailles, New Pavilion 6   Paris Porte de Versailles, Mama Shelter

                                                                                                                                                             2019 FULL-YEAR RESULTS   35
LEADING ON SUSTAINABILITY
Extending the Group’s CSR programme

                                                                   REINVENTING PLACES TOGETHER FOR A BETTER TOMORROW

            Reaffirmed carbon ambition, incl. scope 3(1)

                                                   -50%
                      Extended reach and commitment

                 All regions of the Group (incl. US & UK)
                                                              Responsible consumption

                                                                Circular economy
                 New challenges
                                                                Biodiversity

                                                              Community resilience

(1)   Carbon emissions across URW’s value chain (construction, operations including tenant energy
      consumption, transport of employees and visitors) in Continental Europe, the UK, and the US
      by 2030, baseline 2015                                                                                           2019 FULL-YEAR RESULTS   37
URW: a leader in CSR

                          st
                               (1)

                     1                                                AAA   A   Prime
                                                                                  C+

(1)   First among all listed retail real estate companies worldwide              2019 FULL-YEAR RESULTS   38
PIPELINE: FLEXIBLE, FOCUSED
      AND DIVERSIFIED
URW pipeline: flexible…
           €11.9 Bn

                                                    -€0.4 Bn

                                                                                               €8.3 Bn
                                                                         -€3.2 Bn

                                                                                                                                  €5.5 Bn
                                                                                                 €5.6 Bn
                                                                                                               -€2.8 Bn

                                                                                                                                    €4.5 Bn

                                                                                                 €2.7 Bn
                                                                                                                                    €1.0 Bn

               FY-2018                          Deliveries, changes   Removed projects          FY-2019      Invested to date     Remaining
                                                    & additions

                                                                              Committed(1)   Controlled(1)

(1)   Please refer to the MD&A for definition                                                                                   2019 FULL-YEAR RESULTS   40
… focused on value creation…

                             €3.2 Bn of projects removed from the pipeline

            Require major redefinition
                                                                URW continues to review
                        or                                      alternatives, in line with:

          Are postponed significantly due                        Capital allocation priorities
     to market or administrative circumstances                   Return objectives

                        or                                       Mixed-use strategy

                                                                 Better Places 2030
      Did not meet the Group’s return targets

                                                                                                 2019 FULL-YEAR RESULTS   41
… and diversified towards mixed-use

                                          Dining & leisure
                                      greenfield / brownfield
                                                10%
                                                          Dining & leisure
                  Retail ext /                           ext / renovation
                  renovation                                     7%
                     19%

                                                                             Westfield Hamburg

 43%                                                               Offices
Retail                           1.4 million sqm                    21%

         Retail greenfield /
            brownfield                                    Hotels
                 24%                                       8%
                                         Residential
                                            11%
                                                                             Westfield Montgomery

                                                                                                    2019 FULL-YEAR RESULTS   42
Deliveries: a remarkable 2020
                                                                                           €2 Bn of deliveries: +268,100 sqm / YoC: 6.2%
                                                                                                                             2020

                                                                                                                    Montparnasse
                                                                                                                                                    LA PART-DIEU
GLA                  Delivered              GLA         Delivery from           GLA             Delivery         GLA               Delivery         GLA             Delivery         GLA             Delivery
46,700 sqm           H2-2019                +46,700 sqm H1-2020                 49,500 sqm      H1-2020          51,300 sqm        H2-2020          +33,400 sqm     H2-2020          +87,200 sqm     H2-2020

100% TIC                                    100% TIC           Pre-letting(1)   100% TIC        Pre-letting(1)   100% TIC          Pre-letting(1)   100% TIC        Pre-letting(1)   100% TIC        Pre-letting(1)
€210 Mn              Fully let              €1,050 Mn          80%              €350 Mn         0%               €160 Mn           100%             €410 Mn         82%(2)           €620 Mn         62%(3)

URW ownership                               URW ownership                       URW ownership                    URW ownership                      URW ownership                    URW ownership
100%                                        50%                                 100%                             100%                               100%                             100%
(1)   Pre-letting: GLA signed, all agreed to be signed and financials agreed
(2)   Pre-letting as at February 11, 2020: 91%
(3)   Pre-letting as at February 11, 2020: 74%                                                                                                                                          2019 FULL-YEAR RESULTS    43
SYNERGIES
Synergies

                                                                                                               Commercial Partnerships

                        Target (run rate)                                                                  +11.2% in Continental Europe
                            €100 Mn(1)

                                 Achieved
                           €99.0 Mn

                   Cost                                  Revenue(2)
        €87.9 Mn                                    €11.1 Mn
                                                                      Westfield Vélizy 2, digital screen                   CentrO, Sephora event

(1)   €60 Mn in cost synergies and €40 Mn in revenue synergies
(2)   Phased-in                                                                                                                                    2019 FULL-YEAR RESULTS   45
€4.8 BN OF DISPOSALS
AT PREMIUM TO BOOK VALUE
Disposal of 54.2% interest in €2.0 Bn retail portfolio
              Aéroville                                           So Ouest               Rennes Alma                  Toison d’Or                   Confluence

  GLA                                                GLA                           GLA                         GLA                           GLA
  84,900 sqm                                         56,900 sqm                    46,500 sqm                  78,700 sqm                    53,800 sqm
  Footfall 2019                                      Footfall 2019                 Footfall 2019               Footfall 2019                 Footfall 2019
  9.2 Mn                                             7.6 Mn                        7.2 Mn                      8.3 Mn                        10.2 Mn

                                                   Portfolio KPIs                                      Implied transaction KPIs (100% basis)
                    URW-owned GLA                            Footfall 2019   Sales/sqm(1)                   Offer price(2)          NIY(3)
                    272,400 sqm                              42.5 Mn         €6,484                         €2,037 Mn               4.8%

(1)   Small units
(2)   In line with last unaffected appraisal value as at December 31, 2018
(3)   NRI next 12 months / Total Acquisition Cost                                                                                                    2019 FULL-YEAR RESULTS   47
Disposal of 54.2% interest in €2.0 Bn retail portfolio

                                                                                              Transaction details
                                                                Equity – 50%

                                                                                                 URW                    Accounting treatment:
                                                                                                                            Equity method
                                                54.2%                                          45.8%
                             Debt – 50%                                                                                   Targeted closing:
                                                                                                                                     (2)

                            Non-recourse
                                                                                                                              Q2-2020
                                                                       JV
                          Fully underwritten

                                                                                   URW asset &
                                                                                property manager(1)
                                                                                                                     URW NDP : €1,511 Mn
                                                                                                                               (3)

                                                                   Rennes
              Aéroville                 So Ouest                                          Toison d’Or   Confluence
                                                                    Alma

(1)   10 year contract
(2)   Subject to consultation with URW works council and customary conditions precedent
(3)   Net Disposal Proceeds                                                                                                                     2019 FULL-YEAR RESULTS   48
€4.8 Bn of disposals made or agreed since June 2018

      July & August 2018                   December 2018                 H1-2019            H2-2019                  February 2020(1)

               Capital 8                     Tour Ariane                Jumbo               Majunga                      Aéroville
           Horton Plaza                    Lumen & Skylight           Cherry Park          Ring Center                   So Ouest
              Los Arcos                                                                                               Rennes Alma
              Bahia Sur                                                                                                Toison d’Or
                 Vallsur                                                                                               Confluence
                 El Faro

                        Offices & Others                             Retail                                  Total disposals

        NDP                    Premium     NIY             NDP       Premium        NIY            NDP            Premium         NIY
        €2.4 Bn                6.2%        4.2%            €2.4 Bn   3.3%           5.1%           €4.8 Bn        4.8%            4.6%

(1)   Binding offer received                                                                                             2019 FULL-YEAR RESULTS   49
FINANCING AT ATTRACTIVE CONDITIONS
€4.6 Bn(1) of long-term capital raised at attractive rates
                                                                                                                                    Secured GBP Bond
                                    Euro Senior Bonds                                                     144A USD Bonds          Westfield Stratford City

                 February                                                June/July                             June                         July

                                    8-year                                                 30-year                      10-year                          7-year
          €750 Mn                                                  €500 Mn                                 $750 Mn                   £750 Mn     (2)

                                    1.0%                                                   1.75%                        3.5%                             1.64%

                                                                           October                            October

                                                                                                                                              st
                                                                                                                                                   (3)

                                                                                                                                          1
                                  15-year                                                  12-year                      7-year
          €750 Mn                                                  €750 Mn                                 $750 Mn
                                  1.75%                                                    0.875%                       2.875%

                       Avg maturity:                  11.8 years                            Avg coupon:   1.71%

(1)   Including private placements under URW’s EMTN programme, not shown on the slide; excluding
      Secured GBP Bond of Westfield Stratford City
(2)   £375 Mn in URW’s proportionate debt
(3)   Lowest coupon ever for a GBP benchmark issuance in the real estate sector. Refinancing
      of a CMBS maturing in 2019                                                                                                           2019 FULL-YEAR RESULTS   51
Low cost of debt and record average maturity
                               Average Cost of Debt                                                           Average Maturity
                                                                                                                  (years)
        3.9%                                                                                                                                                   8.2
                  3.6%                                                                                                                                7.5
                             3.4%                                                                                                          7.2
                                                             EUR  (1)
                                                                        USD & GBP                                                   7.0
                                                            0.9%          3.4%
                                     2.9%                                                                                   6.5

                                            2.6%                                                                    5.9

                                                   2.2%                                                     5.4
                                                                                                    4.9
                                                                                             4.5
                                                                                      4.3
                                                          1.6%          1.6%   1.6%

                                                                 1.4%

        2010          2011   2012   2013    2014   2015   2016   2017   2018   2019   2010   2011    2012    2013    2014    2015   2016   2017      2018      2019

(1)   Including SEK                                                                                                                              2019 FULL-YEAR RESULTS   52
BALANCE SHEET & NAV
Healthy credit ratios

                               LTV                                                                 ICR

                                                       60%

                                                                                                                              6.1

         41%                                                                                                         5.9
41%                                                                                                                                    5.7x
                                                       40%
                                                             38.6%                     4.6                     4.6
                     30%         37%   33%                                 4.0
                                                                                             3.8         3.5
                                                       30%
                                                                     2.5         3.5
               25%                                                                                                                     2.0
                                                     37.2%

      Typical covenant level           Pro-forma for disposal
                                                                           The debt the Group expects to raise over
                                       of five French assets
      Target range                                                             the next 2 years is fully hedged

                                                                                                                     2019 FULL-YEAR RESULTS   54
NAV evolution

                                  Going Concern Net Asset Value(1)                                 20                             Non Lfl revaluation
                                                                                                                                  & intangible assets
                                          (in € per share)                                                                                +€2.71
        €233.90                                                                                         Recurring
                                                                                                          EPS
                                                                                                   15
                                                                                                        +€12.72                         Rent effect
                                                                                     €217.50
                                   -€10.80                          €212.95           +€4.55
                                                                                                                                         +€4.08

                                                    -€10.15                                        10

                                                                                                           Asset                       Yield effect
                                                                                                        revaluation                      -€13.58
                                                                                                    5    -€6.79

                                                                                                          Other

                                                                                                    0
                                                                                                         -€1.40

                                                                                                                      GMV €65.3 Bn
      December 2018                 Dividend     Mtm of fixed-rate December 2018   December 2019
                                                 debt & financial    Pro-forma
                                                   instruments                                                EPRA NAV €213.30/share

(1)    Hybrid securities are excluded from NAV                                                                                 2019 FULL-YEAR RESULTS   55
Delivering on strategic and capital allocation priorities

                          Announced                          To date                2020 and onwards

                                                                                 €1.2 Bn (±50% office/50% retail)
         Reduce leverage: €6 Bn of disposals     €4.8 Bn   (80%)(1)
                                                                                 €2.5 Bn additional disposals

                                                                                 Prioritise existing Flagships:
         Review development projects             €3.2 Bn removed from pipeline
                                                                                 extensions and mixed-use projects

                                                                                 More capital partnering on
         Join with capital partners              Cherry Park JV PSP + QuadReal
                                                                                 development projects

         Improve cost base                       €87.9 Mn cost synergies
                                                                                 €40 Mn revenue synergies by 2023
         Realize revenue synergies               €11.1 Mn revenue synergies

(1)   Including disposal of five French assets                                                      2019 FULL-YEAR RESULTS   56
GUIDANCE
Guidance

                          Key inputs                                   AREPS 2020      Medium term CAGR

               Indexation

               Rental uplifts

               Increased disposals

                                                                    €11.90 - €12.10     +3% to +5%
               Reduced pipeline                                                       (Rebased for disposals(1))

               Taxation

               Cost of debt

               No acquisitions assumed

(1)   As if all planned disposals had happened on January 1, 2020                                   2019 FULL-YEAR RESULTS   58
DIVIDEND
Dividend for fiscal year 2019

                                                                           Cash dividend : €10.80
                                                                                               (1)

                                                                             87% pay-out ratio

                                                               INTERIM             €5.40 on March 26, 2020
                                                                 FINAL             €5.40 on July 6, 2020

                                                                         Output of 2020-2024 BP:

                                                                               €10.80 is sustainable

(1)   Subject to approval by Annual General Meetings of Unibail-Rodamco-Westfield SE and WFD
      Unibail-Rodamco N.V.                                                                                   2019 FULL-YEAR RESULTS   60
Established dividend track record
                                                                                                                                                                          94%(1)
                                                                                                                                        93%
                                                                                                                                                     91%
        89%                                                                                                                                                       90%
                           88%                                                     89%                                       88%
                                             87%                                                     88%        87%                                                                        87%
                                                                86%
                                                                                                                                                                          12.92

                                                                                                                                                                  12.05                  12.37
                                                                                                                                                    11.24
                                                                                                                            10.92
                                                                                                                                        10.46
                                                                                                               10.22
                                                                                                     9.60
                                             9.19               9.27              9.03
                          8.52                                                                                                                                    10.80   10.80          10.80
                                                                                                                                                    10.20
        7.86                                                                                                                 9.60       9.70
                                                                                                                8.90
                                                                                                     8.40
                                             8.00               8.00              8.00
                          7.50
        7.00

        2007              2008               2009              2010               2011               2012       2013        2014        2015         2016         2017    2018           2019

                                                          Pay-out ratio                                     Dividend Per Share (in €)           AREPS(2) (in €)

(1)   Dividends / the adjusted net recurring result of the Group, composed of the net recurring result
      of UR through May 31, 2018, and URW from June 1, 2018
(2)   Before 2018: REPS                                                                                                                                                    2019 FULL-YEAR RESULTS   61
URW.COM
You can also read