The impact of school closures on autumn 2020 attainment - Rising Stars
←
→
Page content transcription
If your browser does not render page correctly, please read the page content below

The impact of school
closures on autumn
2020 attainment
Mainstream state schools show measurable declines in
attainment between 2019 and 2020 across all years in
reading, maths and GPS. This study looks at the impact on
performance of deprivation, location, subject and year group.

February 2021
Katie Blainey, RS Assessment from Hodder Education
Timo Hannay, SchoolDash
IN COLLABORATION WITH

   Summary
   This paper analyses attainment among primary pupils in England after the national lockdown
   and suspension of most in-person teaching during the spring and summer of 2020, followed
   by the re-opening of most schools in the autumn term. It uses aggregate results from
   250,000 primary school tests from over 800 schools taken in November and December 2020
   provided by RS Assessment from Hodder Education. These tests include Progress in Reading
   Assessment (PiRA), Progress in Understanding Mathematics Assessment (PUMA) and Progress
   in Grammar, Punctuation and Spelling Assessment (GAPS).

   Key findings include:

   • At the end of the 2020 autumn term, there were measurable declines in attainment
     compared to the previous year across virtually all subjects and year groups.

   • However, the decline in test scores was only about a fifth of that seen at the start of the
     autumn term, suggesting considerable catch-up during the period between September and
     December 2020, when most schools had re-opened.

   • In general, younger children showed larger decreases in attainment than older children.
     Among the different subjects, Grammar, Punctuation and Spelling (GPS) showed the largest
     declines, representing a gap of on average 2 months’ progress across all year groups. This
     was followed by Maths and then Reading which both, on average, showed a 1-month gap.

   • Children who were already low-attaining, those eligible for the Pupil Premium and those
     attending schools in more deprived areas tended to show greater declines in attainment
     than their peers. This indicates that pre-existing educational disparities have been
     exacerbated by school closures and lockdown.

   • There were also considerable differences by region. Schools in the Midlands showed much
     larger average declines in Maths than those in other parts of the country, while schools in
     the North showed the biggest decreases in GPS scores. Areas in the South tended to show
     relatively small declines across all subjects.

   • Somewhat counterintuitively, Pupil Premium-eligible children at relatively affluent schools
     tended to fare worse than those at more deprived schools. Conversely, non-Pupil Premium
     children attending schools in deprived neighbourhoods showed larger reductions in
     attainment than any other group, including children at the same schools who were eligible
     for the Pupil Premium.

   Professor Simon Burgess, University of Bristol
   “One of the key features of the data from RS Assessment is the scale:
   having some 250,000 tests means that analysis can be conducted at
   quite a granular level and still maintain reliable sample sizes.”

To download this white paper, visit risingstars-uk.com/whitepaper21                                2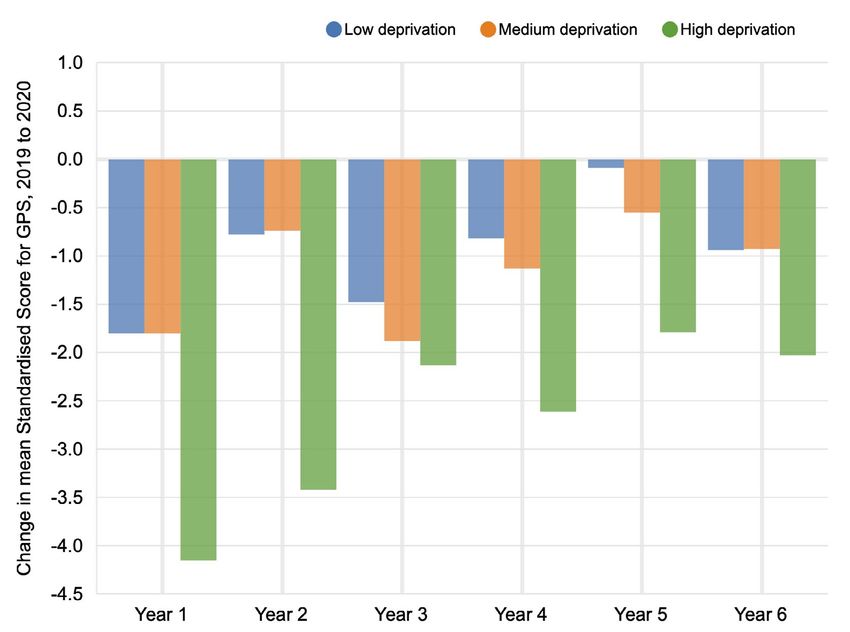
IN COLLABORATION WITH

   Introduction
   Our previous analysis1, published in November 2020, examined learning loss during the
   spring and summer of 2020 by analysing the results of summer tests sat belatedly by pupils
   when schools re-opened in September and comparing these with the same tests sat by the
   previous cohort in summer 2019. It showed considerable reductions in average test scores,
   particularly among younger and disadvantaged pupils, and with certain subjects affected
   more than others. These changes can be attributed to a combination of the effects of school
   closures in the spring and summer 2020 due to the COVID-19 pandemic, together with
   ‘normal’ learning loss during the subsequent summer holiday.

   The new analysis presented here provides an update by investigating the results of tests sat
   at the end of the 2020 autumn term. It therefore provides one of the first comprehensive
   insights into whether schools and pupils were able to recover at least some of the learning
   loss during the period of school re-openings from September to December 2020.

   This paper analyses aggregate, anonymised results from tests sat by primary pupils at
   mainstream state schools in England during the 2020 autumn term, and compares these
   with the results obtained from the previous cohort in autumn 2019. Any differences can
   therefore be attributed to a combination of:

   • The effects of the national lockdown and other restrictions during the spring and summer
     of 2020, notably the replacement of in-person teaching with remote learning and home
     schooling.

   • The more normal levels of in-person, in-school teaching during the autumn term, albeit
     with considerable ongoing disruption for some areas, schools and pupils including
     localised closures and periods of isolation at home.

   Professor Simon Burgess, University of Bristol
   “These new data from RS Assessment provide a very valuable insight into how
   young children’s learning is progressing through the pandemic and school
   closures. It is vital to get a sense of the scale of the learning loss to make up as
   the Government considers strategies to help young people recover. As the Report’s
   authors note, these assessments do not cover all important subjects, still less other
   aspects of pupil wellbeing, but they are nevertheless very valuable.”

   1
       See risingstars-uk.com/whitepaper2020 for these previous analyses.

To download this white paper, visit risingstars-uk.com/whitepaper21                                 3
IN COLLABORATION WITH

   Overall changes in attainment
   As shown in Figure 1, there were decreases in attainment from 2019 to 2020 across virtually all
   subjects and year groups. In general, younger year groups were most affected, and GPS saw the
   biggest declines. Overall this could amount to a gap of up to two months’ learning between children
   in 2020 and 2019, see Figure 2 below.

   Nevertheless, these reductions in attainment were much smaller than those seen at the beginning
   of the autumn term2, which were typically in the range of 5 to 10 Standardised Score points3. This
   suggests that schools and pupils caught up considerably during the course of the autumn term, and
   while overall learning loss was by no means eliminated it was greatly reduced.

   Figure 1: Change in mean Standardised Scores from autumn 2019 to autumn 2020

   Sources: MARK, SchoolDash analysis.
   2020 sample sizes: In the range 76,000–92,000 tests per subject and 8,300–20,100 per subject-year group combination.

   2
       See risingstars-uk.com/whitepaper2020 for these previous analyses.
   3
    Standardised Scores control for potential variation in the relative difficulties of tests sat in different terms or by different year groups.
   This does not have any particular significance for the analysis presented here, which focused on Autumn Papers and looks mainly at
   year-on-year changes for the same tests.

To download this white paper, visit risingstars-uk.com/whitepaper21                                                                                 4
IN COLLABORATION WITH

   To help understand how differences in Standardised Score correspond to time spent learning, we can
   apply a method to translate effect sizes developed by the Education Endowment Foundation (EEF)4,
   the results of which are summarised in Figure 2. This indicates that children could be, on average, up
   to two months behind their 2019 peers in GPS and an average of about one month behind in both
   Maths and Reading, however for older year groups the gap did not grow in Reading. We must advise
   caution with this indicative measure as the conversion process is only a rough guide.

   Figure 2: Effect sizes and months’ progress gap

                         Maths                                   Reading                                GPS

                         Effect size         Months              Effect size        Months              Effect size   Months

     Year 1              -0.09               1                   -0.14              2                   -0.17         2

     Year 2              -0.04               1                   -0.05              1                   -0.11         2

     Year 3              -0.09               1                   -0.07              1                   -0.12         2

     Year 4              -0.06               1                   -0.01              0                   -0.10         1

     Year 5              -0.09               1                   -0.01              0                   -0.05         1

     Year 6              -0.02               1                   0.01               0                   -0.10         2

   As well as looking at the changes in mean score, it is also important to examine if the distributions
   of scores were altered since this may indicate whether some groups of pupils were affected more
   than others.

   Dee Reid and Kate Ruttle, Independent Education Consultants and Authors of
   Shine: Targeted Interventions for Primary
   “This very useful analysis of performance gives statistical strength to many common-sense
   judgements about the effects of school closures during the pandemic. The data clearly shows
   that many pupils slipped behind in performance while schools were closed. Encouragingly,
   the data also shows that schools obviously hit the ground running once they were fully open
   in September and considerable catch up progress was made through the efforts of both
   teachers and pupils. We can hope that the increased provision of access to online learning
   will mitigate the impact on learning of the spring 2021 lockdown.”

   4
     Effect sizes were calculated by dividing the difference in Standardised Score points between 2019 and 2020
   cohorts by the standard deviation of the 2019 cohort. These were converted to months using the EEF table, see:
   educationendowmentfoundation.org.uk/evidence-summaries/about-the-toolkits/attainment

To download this white paper, visit risingstars-uk.com/whitepaper21                                                            5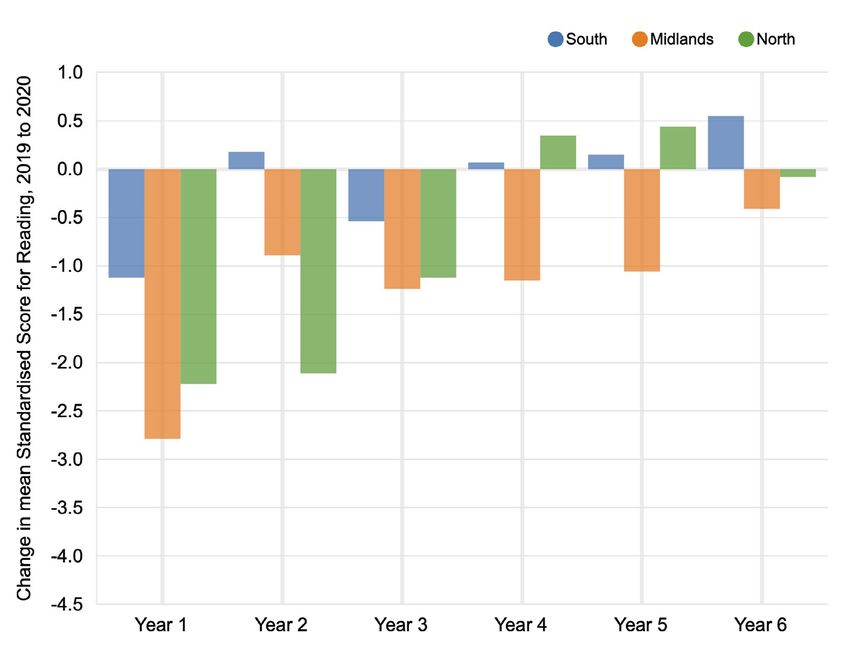
IN COLLABORATION WITH
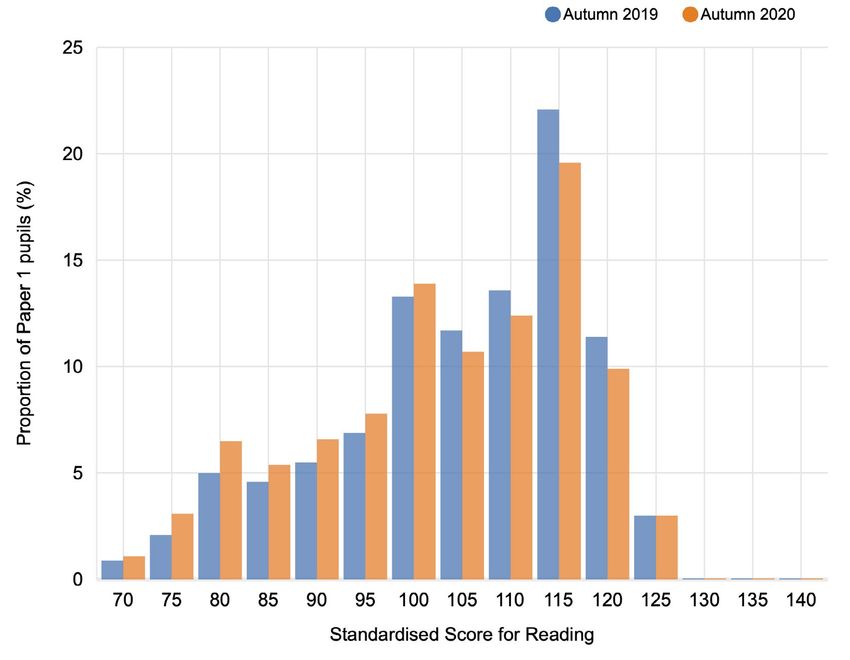
Figure 3 shows the distribution of scores for the Year 1 autumn Reading test. Compared to 2019
(blue columns), 2020 (orange columns) shows fewer scores above the national average of 100 and
a greater number below that level. Nevertheless, both distributions have a similar shape, which is
consistent with the idea that declines in performance were relatively evenly spread across the pupil
population. As we shall see below, however, this does not necessarily mean that all kinds of pupils
were equally affected.
Figure 3: Distributions of Standardised Scores for Autumn Year 1 test in Reading
Proportion of Year 1 pupils (%)
Sources: MARK, SchoolDash analysis.
Sample size: Approximately 9,000 tests in 2019 and 9,200 in 2020.
To download this white paper, visit risingstars-uk.com/whitepaper21 6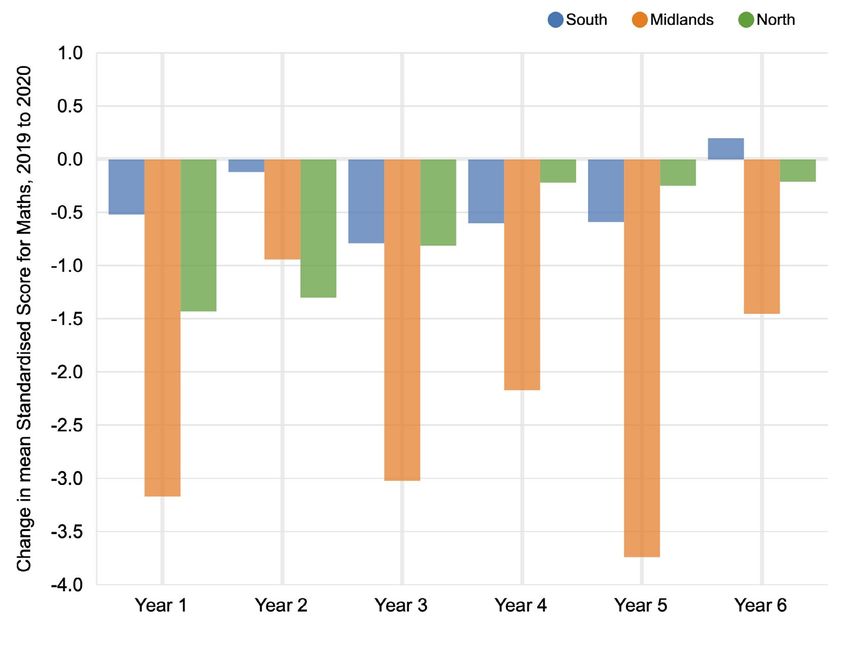
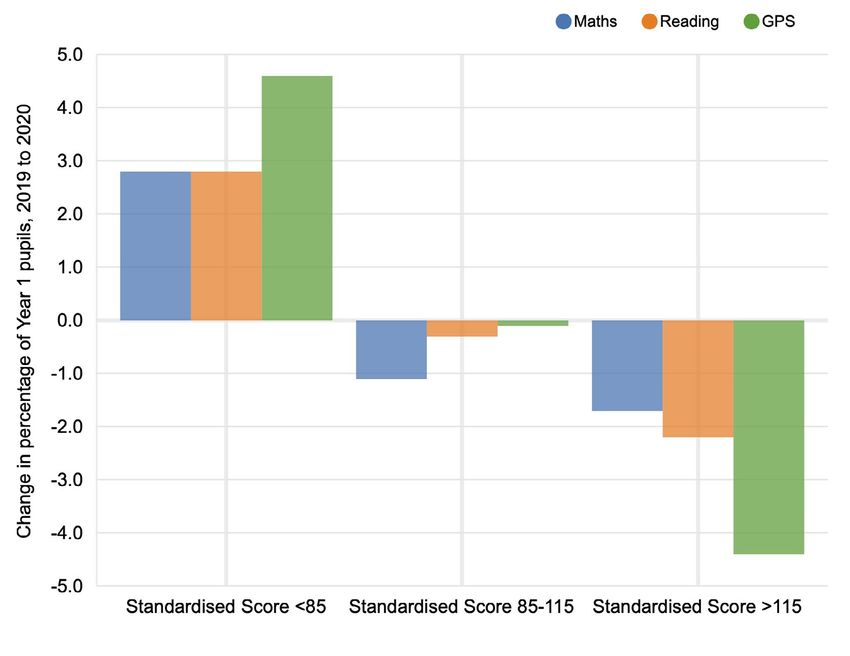
IN COLLABORATION WITH

   Another way to consider these changes is to look at the proportions of pupils who have moved in
   lowest and highest Standardised Score bands. This is shown for Year 1 pupils in Figure 4. The increase
   in the lowest band indicates a larger proportion of pupils receiving very low scores in these tests
   (roughly speaking, less than 25% of marks). This shift resulted in an increase of roughly 3-4% in
   pupils working well below age-related expectations.

   Figure 4: Changes in the percentage of pupils by attainment bands for Autumn Year 1 tests

   Sources: MARK, SchoolDash analysis.
   Sample sizes: In the range 9,200–13,600 tests per subject.

To download this white paper, visit risingstars-uk.com/whitepaper21                                         7
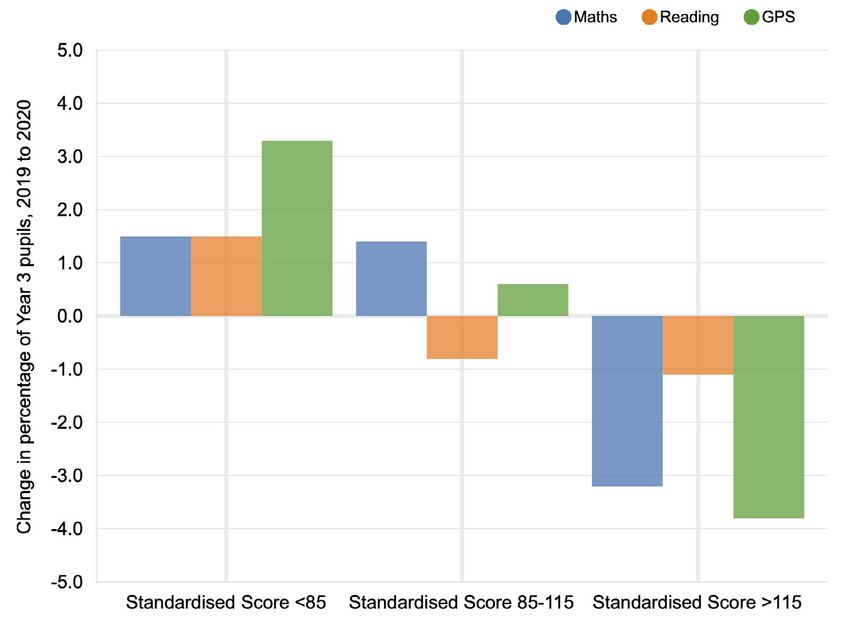
IN COLLABORATION WITH

   Figure 5 shows the same analysis for Year 3 pupils, who displayed broadly similar patterns.

   Figure 5: Changes in the percentage of pupils by attainment bands for Autumn Year 3 tests

   Sources: MARK, SchoolDash analysis.
   Sample sizes: In the range 14,300–18,700 tests per subject.

   Dee Reid and Kate Ruttle, Independent Education Consultants and Authors of Shine: Targeted
   Interventions for Primary
   “The data particularly reveals decline in scores in GPS. A possible explanation for this
   is the curriculum content that represents new blocks of knowledge and introduces
   specific terminology, whereas, broadly speaking, progress in Maths and Reading is more
   developmental. So, any reading or maths practised at home will contribute to pupils’
   progress in those subjects, but unfamiliarity of specific terminology used in the GAPS tests,
   for example relative clause or possessive pronouns, would bar pupils from answering those
   questions. It’s also true to say that some progress in reading, in particular, comes with
   maturity (which happens at home just as much as it does in school) but because of the
   nature of the subject matter, the same cannot be said for grammar, punctuation or spelling. ”

To download this white paper, visit risingstars-uk.com/whitepaper21                                8
IN COLLABORATION WITH

   Analysis by prior attainment
   A key source of concern about learning loss is that it might affect certain groups of pupils more than
   others, potentially exacerbating existing educational inequalities. This does indeed appear to be the case.

   Figure 6: Change in Standardised Score by attainment band for Autumn Year 3 tests

   Sources: MARK, SchoolDash analysis.
   Sample sizes: In the range 900–2,200 tests per subject and quintile.

   For example, Figure 6 shows the year-on-year change in attainment of Year 3 pupils based on their
   attainment in the preceding Year 2 autumn tests, by grouping pupils in to the lowest (1) to highest (5)
   attainment bands (quintiles). Baseline results were provided by the prior 2018/2019 cohort. The data
   shown in the figure indicate the degree of relative underperformance by the current cohort that sat the
   Year 2 test in 2019 (before lockdown) and the Year 3 test in 2020 (after lockdown and re-opening).

   Compared to the previous cohort, pupils in lower-attaining quintile bands (2 and 3) were more adversely
   affected than those already in higher-attaining quintiles (4 and 5). This effect was strongest for GPS
   and weakest for Maths. Interestingly, pupils already in the lowest-scoring quintile (1) were affected
   relatively little. This may be partly a statistical effect because their previous lower attainment gives
   them less scope to fall in terms of absolute Standardised Score.

   The analysis above was based on the subset of pupils who sat the autumn tests in both 2019 and 2020.
   In selecting these records, it became apparent that pupils in lower-attaining quintiles for the 2019 tests
   were somewhat less likely than those in higher quintiles to appear the 2020 test results at all. This effect
   was not large enough to compromise the statistical validity of the analysis, but raises obvious concerns
   that small but disproportionate numbers of lower-attaining pupils might, for one reason or another, be
   less fully engaged in education than they were before lockdown.

To download this white paper, visit risingstars-uk.com/whitepaper21                                               9
IN COLLABORATION WITH

   Disadvantaged pupils
   Another even more specific concern is that pupils from poorer families will fare worse than those from
   more affluent backgrounds. This an almost ubiquitous and widely studied effect in education and
   there has been much discussion that distance-learning and home schooling may have exacerbated it
   due to the widely varying circumstances in different homes.
   As well as test results, MARK also contains information about individual Pupil Premium status where
   schools have chosen to add this, or synced with their MIS. Pupil Premium5 status is used as a proxy for
   disadvantage in this analysis. The following figures show the differences in mean Standardised Scores
   between Pupil Premium and non-Pupil Premium children for cohorts who sat the tests in autumn 2019
   (before school closures) and autumn 2020 (after school closures and re-openings). Figure 7 shows
   that the pre-pandemic attainment gaps in Maths of 6-7 Standardised Score points tended to increase,
   giving a range in 2020 of 5-9 Standardised Score points. Older year groups were more adversely
   affected than younger ones.
   Using the EEF’s translation of effect sizes to months’ progress helps to put these gaps into context
   (see page 5 for methodology). This indicates that the Year 6 Pupil Premium group could now be
   around 7 months behind the non-Pupil Premium group in Maths, a widening of a further 2 months
   since 2019. The average gap across all year groups between Pupil Premium and non-Pupil Premium
   children in Maths appears to have grown from about 5 months in 2019 to about 6 months in 2020.

   Figure 7: Differences in Standardised Scores between Pupil Premium and non-Pupil Premium
   pupils for autumn tests in Maths

   Sources: MARK, SchoolDash analysis.
   Sample sizes: In the range 4,100–21,100 tests per year group.

   5
     We analysed only those schools with overall Pupil Premium percentages in MARK that were broadly consistent with the proportion
   reported publicly for that school by the Department for Education, and omitted any pupils with unknown Pupil Premium status, resulting
   in a smaller number of results for this section.

To download this white paper, visit risingstars-uk.com/whitepaper21                                                                         10
IN COLLABORATION WITH Figure 8 shows the same comparisons for Reading, which also displayed increases in the deprivation attainment gap, though less than for Maths and with no clear pattern by pupil age. Translating to months’ progress, a very similar pattern to Maths is evident, with an average gap of 5 months between the two groups in 2019, growing to 6 months in 2020 across all year groups. Results for Year 6 Reading were most stark, with a gap of around 7 months in 2020, up from 5 in 2019. Figure 8: Differences in Standardised Scores between Pupil Premium and non-Pupil Premium pupils for Autumn tests in Reading Sources: MARK, SchoolDash analysis. Sample sizes: In the range 5,020–22,800 tests per year group. Shareen Wilkinson, Primary English adviser, educational author and teacher “The gaps between Pupil Premium and non-Pupil Premium is still an issue for children. Now, more than ever, pupils need opportunities for drama, speaking and listening and high quality teaching (including explicit instruction, retrieval practice, metacognition, feedback and other evidence-based strategies.)” To download this white paper, visit risingstars-uk.com/whitepaper21 11
IN COLLABORATION WITH

   It was a similar story for GPS, as shown in Figure 9. Likewise, when translated into months’ progress,
   the average gap across all year groups grew from 5 months in 2019 to 6 months in 2020.

   Figure 9: Differences in Standardised Scores between Pupil Premium and non-Pupil Premium
   pupils for Autumn tests in GPS

   Sources: MARK, SchoolDash analysis.
   Sample sizes: In the range 4,300–12,500 tests per year group.

To download this white paper, visit risingstars-uk.com/whitepaper21                                         12
IN COLLABORATION WITH

   Local deprivation
   Of course, disadvantaged families and children are not evenly distributed around the country and it is
   also possible to look at the effects of poverty by local area. Figure 10 shows year-on-year changes in
   mean Standardised Score by local deprivation rate6. For all year groups, the declines in poorer areas
   were much greater that those in more affluent areas.

   Figure 10: Change in mean Standardised Score in Maths by local deprivation rate

   Sources: MARK, Department for Education, Office for National Statistics, SchoolDash analysis.
   Sample sizes: In the range 1,700–7,300 tests per year group and deprivation level.
   Note: Areas with a mean IDACI of more than 0.23 are considered high deprivation, while those with a mean score of less than 0.16 are
   considered low.

   6
       As defined by the Income Deprivation Affecting Children Index, or IDACI, from the Office for National Statistics.

To download this white paper, visit risingstars-uk.com/whitepaper21                                                                       13
IN COLLABORATION WITH Figure 11 shows the same analysis for Reading. Whilst many of the declines were smaller than for Maths, the overall patterns were similar. Note also that for older year groups, pupils from the lowest deprivation areas actually showed slight increases in attainment relative to the previous year’s cohort. Figure 11: Change in mean Standardised Score in Reading by local deprivation rate Sources: MARK, Department for Education, Office for National Statistics, SchoolDash analysis. Sample sizes: In the range 2,200–8,400 tests per year group and deprivation level. Note: See note to Figure 10. Shareen Wilkinson, Primary English adviser, educational author and teacher “Interestingly, the biggest gap here is for younger pupils. Indeed, the best strategies to support pupils will be to ensure teachers read aloud (including reading aloud across the curriculum), to promote reading for pleasure, systematic synthetic phonics instruction and explicit teaching.” To download this white paper, visit risingstars-uk.com/whitepaper21 14
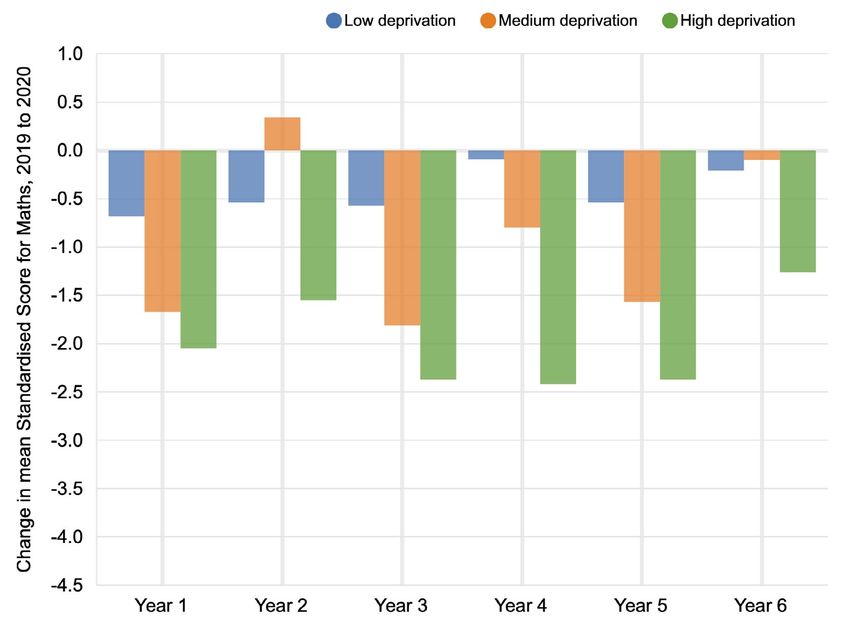
IN COLLABORATION WITH

   For GPS, shown in Figure 12, the effects of local deprivation were stark, especially for younger year
   groups.

   Figure 12: Change in mean Standardised Score in GPS by local deprivation rate

   Sources: MARK, Department for Education, Office for National Statistics, SchoolDash analysis.
   Sample sizes: In the range 1,800–9,400 tests per year group and deprivation level.
   Note: See note to Figure 10.

   Dee Reid and Kate Ruttle, Independent Education Consultants and Authors of
   Shine: Targeted Interventions for Primary
   “The general consensus that school closure would hit children living with
   deprivation hardest, is sadly endorsed by this data. The features of their
   disadvantage (which teachers are very familiar with) all contribute to making
   learning at home more challenging. Again, in the lockdown of spring 2021,
   more vulnerable and disadvantaged primary aged children are in school, so it
   may be that the impact of the lockdown will be less than for the previous one.”

To download this white paper, visit risingstars-uk.com/whitepaper21                                                        15
IN COLLABORATION WITH

   Regional analysis
   Given the well-known variations in average deprivation level across England, we might also expect to
   see differences in educational impact by region. This is indeed the case, but there are some surprising
   disparities by subject. As shown in Figure 13, the Midlands showed by far the largest falls in Maths
   attainment. This does not appear to arise from sampling bias: the effect remained even when schools
   were further subdivided by factors such as deprivation level, size, Ofsted rating and so on. We do not
   have a ready explanation for why schools in the Midlands should have fallen so much further in Maths
   than other regions.

   Figure 13: Change in mean Standardised Score in Maths by region

   Sources: MARK, Department for Education, Office for National Statistics, SchoolDash analysis.

   Sample sizes: In the range 1,900–8,600 tests per year group and region.
   Note: The South consists of the East of England, London, the South East and the South West. The Midlands consists of the East Midlands
   and West Midlands. The North consists of the North East, North West and Yorkshire and The Humber.

To download this white paper, visit risingstars-uk.com/whitepaper21                                                                         16
IN COLLABORATION WITH

   Figure 14 shows the same analysis for Reading. This follows a slightly more predictable pattern in
   which the relatively affluent South fares better than the Midlands and the North. However, note that
   Midlands alone appears to account for almost all of the declines seen for Years 4 to 6.

   Figure 14: Change in mean Standardised Score in Reading by region

   Sources: MARK, Department for Education, Office for National Statistics, SchoolDash analysis.
   Sample sizes: In the range 2,300–9,400 tests per year group and region.
   Note: See note to Figure 13.

   Shareen Wilkinson, Primary English adviser, educational author and teacher
   “Although there are some disparities across the regions, this data unequivocally demonstrates
   the urgent support needed for younger pupils. All pupils now need the best teaching, which
   includes explicit instruction, vocabulary teaching, reading aloud and systematic synthetic
   phonics for year 1 pupils. All the above alongside opportunities for dance, drama, learning
   through play, speaking and listening and developing social skills.”

To download this white paper, visit risingstars-uk.com/whitepaper21                                                        17
IN COLLABORATION WITH

   Finally, Figure 15 shows a regional comparison for GPS. In this case, the North performed worst,
   followed by the Midlands and then the South, but with some variation by year group.

   Figure 15: Change in mean Standardised Score in GPS by region

   Sources: MARK, Department for Education, Office for National Statistics, SchoolDash analysis.
   Sample sizes: In the range 3,000–9,000 tests per year group and region.
   Note: See note to Figure 13.

To download this white paper, visit risingstars-uk.com/whitepaper21                                                        18
IN COLLABORATION WITH

   Combined effects of school and pupil types
   It is clear, then, that the effects of recent educational disruptions have differed by both type of
   pupil and type of school. But what, if anything, can we say about the ways in which these two
   factors interact?

   Figure 16 shows the year-on-year changes in Maths attainment across all year groups by school
   deprivation level and Pupil Premium status. Perhaps surprisingly, those eligible for the Pupil Premium
   did not always fall further than their peers: in high-deprivation schools they fared better. This was a
   consistent finding across Reading and GPS too. It suggests two potentially counterintuitive principles
   for remedial intervention:

   • First, Pupil Premium-eligible children at less deprived schools may be in need of greater additional
     support than those in more deprived schools.

   • Second, children who are not eligible for the Pupil Premium, but who attend schools with medium
     or high levels of deprivation, may also be at increased risk of falling behind.

   Figure 16: Change in mean Standardised Score for Maths by school deprivation rate and Pupil
   Premium status

   Sources: MARK, Department for Education, SchoolDash analysis.
   Sample sizes: In the range 1,700–20,300 tests per group shown.
   Note: Schools at which more than 35% of pupils are eligible for free school meals are considered high deprivation, while those at which less
   than 20% of pupils are eligible are considered low.

To download this white paper, visit risingstars-uk.com/whitepaper21                                                                               19
IN COLLABORATION WITH The latter point is reinforced by looking at results by local (as opposed to in-school) deprivation levels, as shown for Maths in Figure 17. (These use the IDACI measure of childhood deprivation mentioned above.) Higher-deprivation areas showed greater reductions in attainment, but this effect was strongest for non-Pupil Premium children. Indeed, of all the school type / pupil type combinations we examined, non-Pupil Premium children attending schools in deprived areas fell the furthest behind, perhaps because they are likely to be relatively poor, but without the additional funding and attention usually (and sensibly) directed at those eligible for the Premium. Again, this effect was consistent across Reading and GPS too. Figure 17: Change in mean Standardised Score for Maths by local deprivation rate and Pupil Premium status Sources: MARK, Department for Education, SchoolDash analysis. Sample sizes: In the range 6,400–16,000 tests per group shown. Note: See note to Figure 10. To download this white paper, visit risingstars-uk.com/whitepaper21 20
IN COLLABORATION WITH

   Concluding remarks
   The results presented here give cause for both optimism and concern. When compared with our
   previous analysis of tests sat immediately after the end of the first lockdown in spring and summer
   2020, pupils appeared to catch up quite rapidly during the autumn term, when most schools were
   open. However, there is no room for complacency. The effects were uneven and have tended to
   increase established educational disparities, notably with respect to poverty and indicate that
   mitigation measures would do well to take into account not just pupil or school characteristics, but
   both together. Furthermore, as we write, schools are once again closed for the 2021 spring term
   and it is not yet clear whether they will be able to reopen before the Easter holiday. Whilst there
   appears to have been much progress since last year in the provision of remote learning, the fact
   remains that in-person, in-school teaching has been suspended and it therefore seems very likely
   that children are once again slipping further behind compared to previous cohorts.

   We are acutely aware that the test results we have reported here do not constitute the sum
   of children’s academic, social and psychological development. There are other intellectually
   important areas – including science, art and music – as well as activities such as sport, drama and
   play that enhance social skills. And all of these together, along with the essential ingredient of
   unmediated human contact, support various aspects of psychological wellbeing and happiness.

   So the picture we provide here is partial, but, we believe, a valuable one nonetheless. We hope that
   it will prove useful to educators, policymakers, families and others in better understanding and
   mitigating the effects of the COVID-19 pandemic on our schools and children.

To download this white paper, visit risingstars-uk.com/whitepaper21                                       21
IN COLLABORATION WITH

   Appendix
   We have previously analysed aggregate, anonymous data to reveal national attainment trends
   across schools in England, including variations by pupil age, season of birth and gender, as well as
   by subject and even individual topics within each subject. See risingstars-uk.com/whitepaper for
   these previous analyses. In order to protect the confidentiality of the institutions and individuals
   concerned, results have been analysed and presented in an anonymised aggregate form.
   All data has been processed in line with MARK terms and conditions which can be found
   at risingstars-uk.com/markterms.

   Represented schools

   This analysis is limited to mainstream state primary schools in England. All regions and major
   school types are included, and the sample is broadly representative.

   Tests and scores

   The data used in this report comes from standardised, termly tests Autumn Papers: PiRA, PUMA
   and GAPS. The tests were taken in autumn 2019 and 2020 and entered into MARK, a free
   marksheet and reporting service. The termly tests are marked by teachers using a robust mark
   scheme, and raw scores are converted to Standardised Scores automatically in MARK. We have
   analysed only results from fully completed tests, with non-zero scores sat by a pupil within the
   correct age range. Tests sat at the wrong time of year have been omitted.

   When analysing results by individual Pupil Premium status, we included only those schools with
   overall Pupil Premium percentages in MARK that were broadly consistent with the proportion
   reported publicly for that school by the Department for Education, and omitted any pupils with
   unknown Pupil Premium status.

   Where results are presented as a change in score, autumn 2019 is treated as the baseline
   comparison point.

To download this white paper, visit risingstars-uk.com/whitepaper21                                       22
You can also read