Swiss Payment Monitor 2021 - How does Switzerland pay? - Short Report Issue 1/2021 Study authors Sandro Graf, Nina Heim, Marcel Stadelmann, Tobias ...
←
→
Page content transcription
If your browser does not render page correctly, please read the page content below
Swiss Payment Monitor 2021 - How does
Switzerland pay?
Short Report Issue 1/2021

Study authors
Sandro Graf, Nina Heim, Marcel Stadelmann, Tobias Trütsch
Version from 6 May 2021
www.swisspaymentmonitor.ch
Swiss Payment Monitor 1/2021                                             University of St.Gallen/ZHAW

Abstract
The effects of the corona pandemic have changed the payment behaviour of the Swiss
population. Since the outbreak of the coronavirus, cash use has decreased significantly, while
digital means of payment have gained in importance. Contactless payment by card and mobile
phone is the new payment standard. The user base of neobanks is growing. The practical
handling, the quick transfer of funds and the constant availability of these app-based banks
are the main reasons for their use. Cash remains the dominant means of payment on site in
retail shops in terms of number of transactions, while mobile payment solutions account for
the largest share of transactions in distance businesses.

                                                                                                   2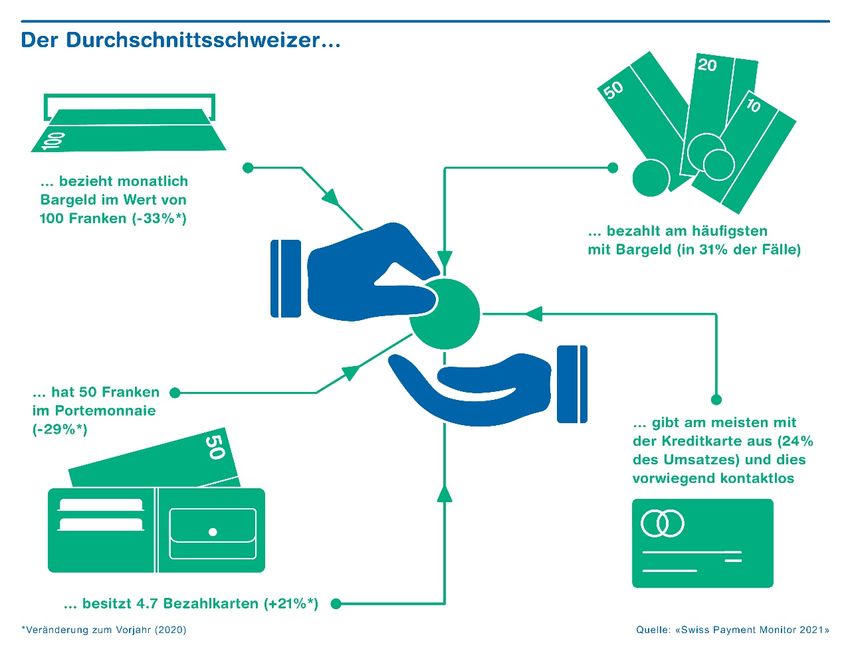
Swiss Payment Monitor 1/2021                                                                                          University of St.Gallen/ZHAW

Table of contents
1     Introduction ................................................................................................................................... 5
2     Study design .................................................................................................................................. 6
    2.1       Micro perspective ................................................................................................................. 7
      2.1.1      Online survey .................................................................................................................... 7
      2.1.2      Payment diary ................................................................................................................... 7
    2.2       Macro perspective ................................................................................................................ 8
3     Payment behaviour in the light of the corona pandemic ........................................................ 8
    3.1       Behaviour change explained by respondents................................................................... 8
    3.2       Effective behaviour change ............................................................................................... 11
    3.3       Behavioural change in a macroeconomic context .......................................................... 14
4     Mobile payment........................................................................................................................... 17
5     A look into the wallet ................................................................................................................. 18
6     Neobanks ...................................................................................................................................... 19
    6.1       Awareness and use............................................................................................................. 19
    6.2       Reasons and purpose of use.............................................................................................. 20
7     Concluding remarks ................................................................................................................... 21

                                                                                                                                                      3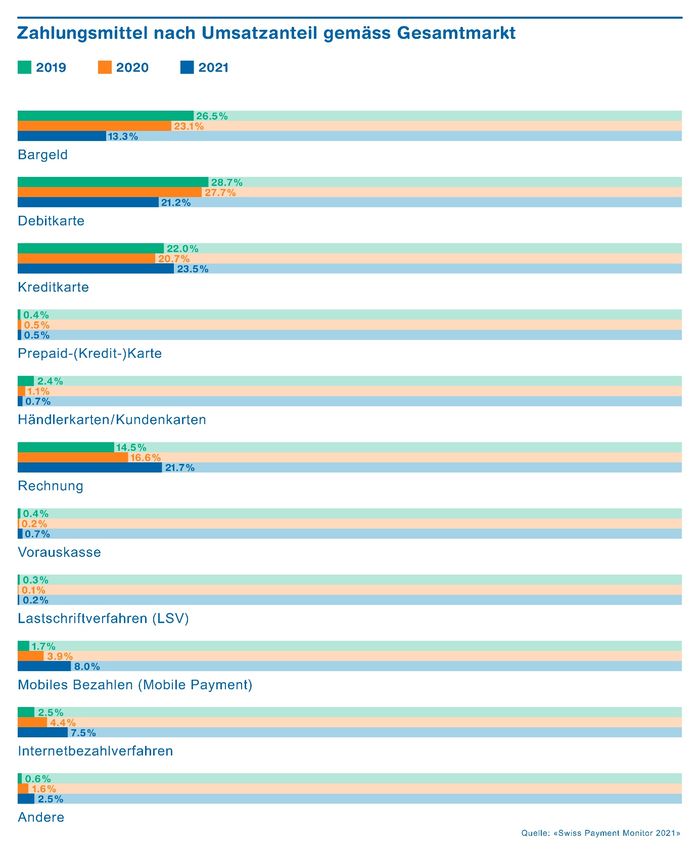
Swiss Payment Monitor 1/2021                                                                           University of St.Gallen/ZHAW

List of figures
Figure 1: Study design of the Swiss Payment Monitor ................................................................... 6
Figure 2: Change in payment behaviour due to the corona pandemic ........................................ 9
Figure 3: Change in consumption behaviour due to the corona pandemic ............................... 10
Figure 4: Cash shares by domestic turnover .................................................................................. 12
Figure 5: Cash shares by number of transactions .......................................................................... 13
Figure 6: Transaction frequency of domestic credit cards ............................................................ 15
Figure 7: Transaction frequency of domestic debit cards ............................................................. 15
Figure 8: Turnover of domestic credit cards................................................................................... 16
Figure 9: Domestic debit card turnover .......................................................................................... 16
Figure 10: Popularity of mobile payments...................................................................................... 18
Figure 11: View into the wallet of an "average Swiss .................................................................... 19
Figure 12: Awareness and use of neobanks .................................................................................... 20
Figure 13: Reasons for using the services of neobanks ................................................................. 21

List of tables
Table 1: Overview of the payment diary........................................................................................... 8

                                                                                                                                  4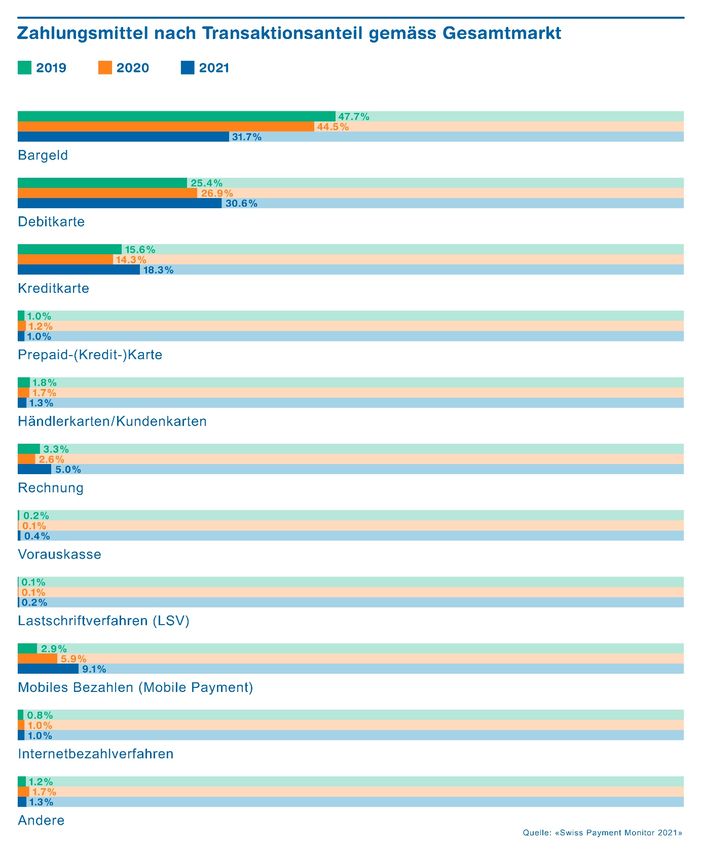
Swiss Payment Monitor 1/2021                                               University of St.Gallen/ZHAW

1 Introduction
The dynamics in the Swiss payment landscape have experienced a significant boost due to the
Corona virus. At the same time, consumer spending has plummeted due to the limited
consumption options. How has this changed payment behaviour in Switzerland in concrete
terms?
This question is addressed in the fourth edition of the Swiss Payment Monitor (SPM), which
is published jointly by the Swiss Payment Research Center (SPRC) of the ZHAW School of
Management and Law and the Swiss Payment Behaviour Lab (SPBL) of the University of
St.Gallen. In addition to mapping current payment behaviour and its development over time,
the SPM, as usual, offers insight into the attitudes of the Swiss population in connection with
various payment methods and payment service providers.
From the end of November to mid-December 2020, over 1400 people aged between 18 and 75
from all three parts of the country were recruited via an online access panel to be
representative of the Swiss population, interviewed and then invited to take part in a three-
day diary survey. This brief report summarises the most important findings from the interview
and diary survey. The results are also available on the project homepage
www.swisspaymentmonitor.ch. In addition, with the help of an interactive dashboard, the
homepage provides a continuous graphic insight into the current data on digital payment
traffic published by the Swiss National Bank. All in all, the project homepage enables a holistic
analysis of the payment behaviour of the Swiss population.
In addition to the two research institutions ZHAW and the University of St.Gallen, the SPM is
funded by the Swiss Payment Association (industry organisation of all major Swiss issuers of
credit cards of the international card organisations) and the industry partners Concardis and
Worldline SIX Payment Services.
This report is structured as follows: Chapter 2 shows the underlying study design. Chapter 3
discusses the change in the subjects' payment behaviour in light of the corona virus. Chapter
4 discusses the developments of mobile payment solutions, while Chapter 5 takes a figurative
look into the average wallet of the Swiss population. The awareness and use of neobanks are
part of chapter 6. Chapter 7 summarises the most important findings and gives an outlook on
future developments.

                                                                                                     5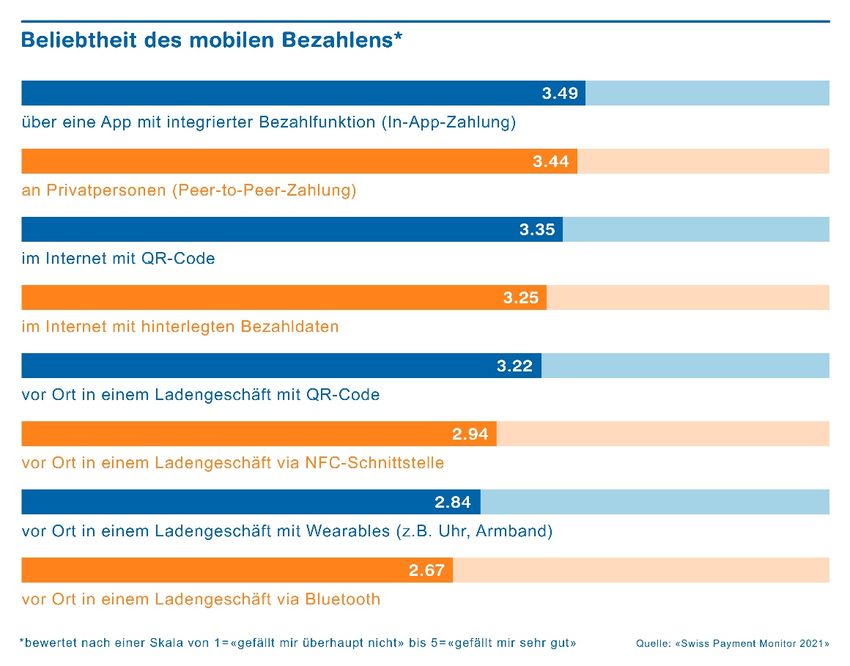
Swiss Payment Monitor 1/2021                                                 University of St.Gallen/ZHAW

2 Study design
The goal of the Swiss Payment Monitor is to comprehensively illuminate the Swiss payment
landscape from different perspectives. By combining different research methods, the study
offers an integrated view of the payments market and enables new developments to be
recorded and relevant drivers to be identified over time through regular data collection.
The study comprises two parts: Firstly, the micro perspective consisting of a standardised
online survey with questions on payment behaviour in general and a payment diary to be
completed by the respondents over three days. Secondly, the macro perspective based on the
analysis of the publicly available data material on electronic payment transactions of the Swiss
National Bank (cf. Figure1).

                           Figure 1: Study design of the Swiss Payment Monitor

                                                                                                       6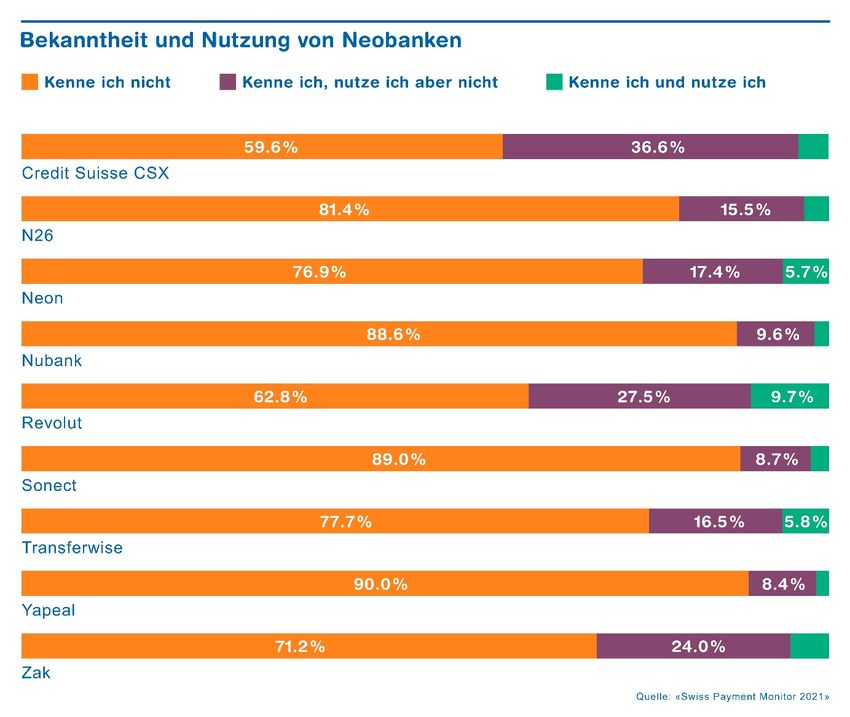
Swiss Payment Monitor 1/2021                                              University of St.Gallen/ZHAW

2.1 Microperspective
The micro perspective reflects the consumer view and captures payment habits, ownership of
traditional and new payment instruments as well as the Swiss population's perceptions and
attitudes towards different payment instruments and payment service providers. In addition,
behavioural changes in connection with the corona pandemic are examined.
As part of the fourth SPM, 1442 people aged between 18 and 75 from German, French and
Italian-speaking Switzerland completed the online survey. 701 of the respondents
subsequently recorded all their transactions over three days using the diary journal. The
sample is representative of the Swiss population in terms of gender, age, language region and
level of education. The study participants were recruited via an online access panel.

2.1.1    Online survey

In the first step, the participants were asked to answer questions about the topic of "payment"
online. The focus was on the respondents' self-perception and assessment of various aspects
of their payment behaviour. The survey lasted approximately 25 minutes and was conducted
in a staggered manner in the second half of November 2020.

2.1.2    Payment diary

In the second step and following the online survey, the participants documented their
payment behaviour in the form of a payment diary over a period of three consecutive days
(see Table1). The participants recorded and classified all payments and cash withdrawals that
occurred during the course of the day - with the exception of recurring expenditures -
according to predefined characteristics. The payment diary was kept with a mobile app, which
enabled the timely recording of transactions and cash withdrawals.

In total, the 701 respondents recorded 4232 transactions with a total amount of around Fr.
308,000 in Switzerland and abroad (cf. Table1). 1 This corresponds to an average of two
transactions per person per day and an average amount of around CHF 73. The average values
are slightly lower when considering only the domestic values (1.9 transactions and CHF 70.45
amount). Compared to the Swiss Payment Monitor 2020, the respondents in Switzerland made
around two thirds more transactions with an average amount per transaction that was around
half as high. In addition to a general change in shopping behaviour, this could also be due to
a change in consumer behaviour due to the corona pandemic or the survey date closer to
Christmas compared to the previous year.

1The foreign currency amounts were converted into Swiss francs according to the average monthly
exchange rate.

                                                                                                    7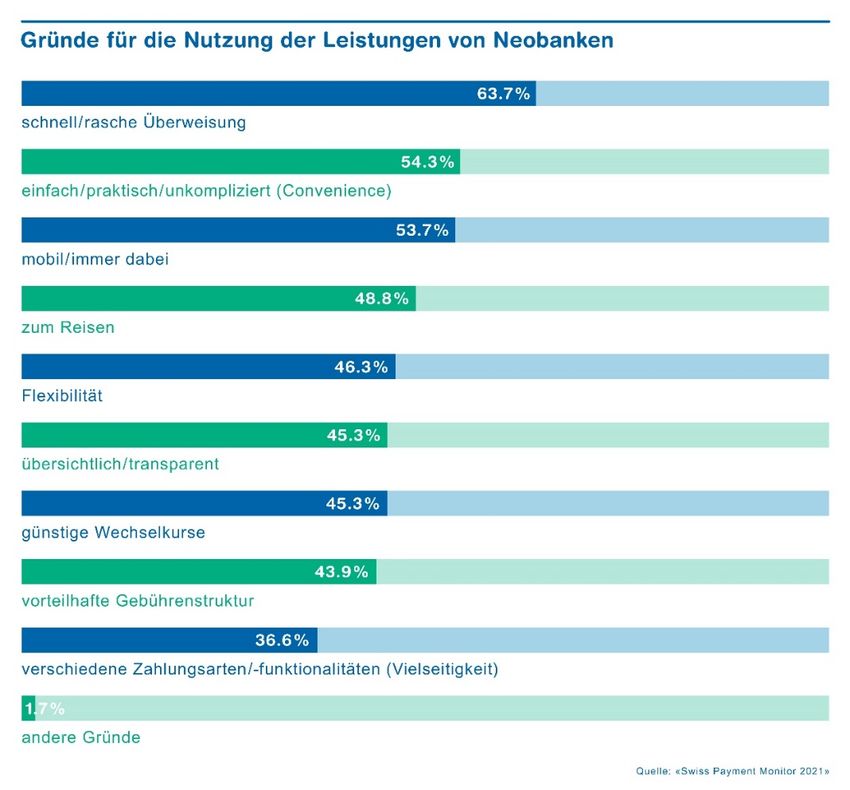
Swiss Payment Monitor 1/2021 University of St.Gallen/ZHAW
Table 1: Overview of the payment diary
Duration of the diary survey 3 days
Number of completed diaries 701
Turnover volume in CHF
Domestic 281'149 Fr.
Domestic and foreign 308'134 Fr.
Domestic transaction volume 3’991
Domestic and foreign 4’232
Average number of transactions per person per
dayInternational and domestic 1,9
2,0
Average amount per transactionInland
and abroad 70.45 Fr.
72.80 Fr.
2.2 Macro perspective
The macro perspective refers to the macroeconomic variables and records payment
transactions at an aggregated level based on the publicly accessible data material of the Swiss
National Bank. It provides an up-to-date picture of cashless payment transactions in
Switzerland and with Swiss payment cards abroad. In addition, it provides information on
effective cash withdrawals with payment cards. The data can be viewed interactively on the
project homepage www.swisspaymentmonitor.ch.
3 Payment behaviour in the light of the corona pandemic
3.1 Behaviour change explained by respondents
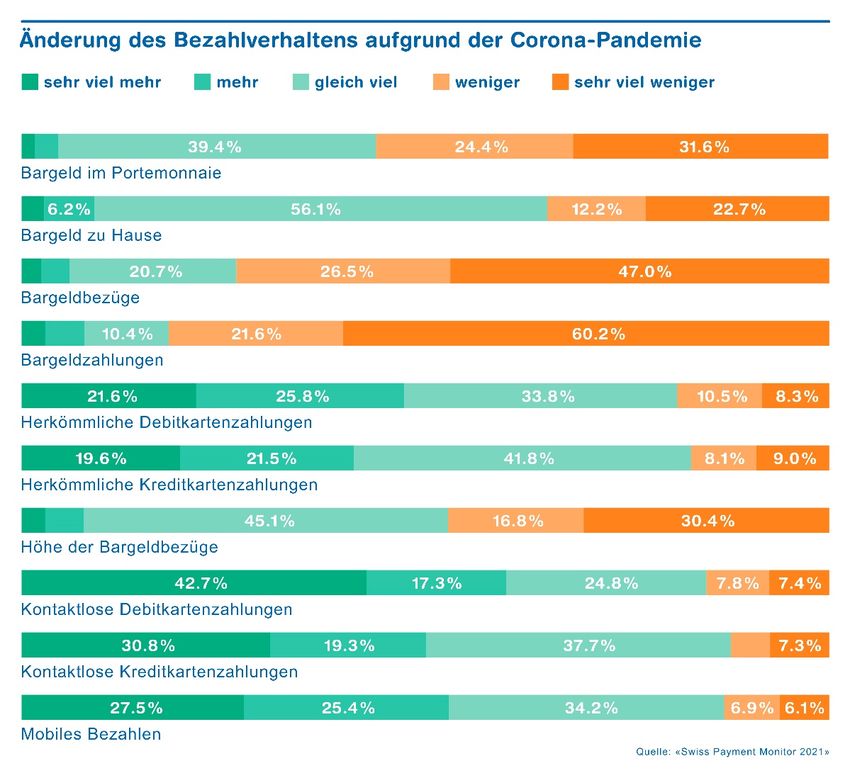
Figure2 shows the respondents' answers to the question about the change in payment
behaviour due to the coronal pandemic. Overall, it can be seen that an overwhelming majority
of people have stated that they have made far fewer cash payments (60%) and cash
withdrawals (47%) since the outbreak of the coronal pandemic, and that they carry far less
cash in their wallets (32%). This is in line with the actual amount of cash in the wallet, which
has decreased by around 30% compared to the previous year (see chapter 5). Most people
reported keeping the same amount of cash or less cash at home (91%) and withdrawing the
same amount or less cash (92.3%) compared to before the pandemic. However, the actual data
on cash use indicate that respondents keep more cash at home year-on-year and withdraw less
8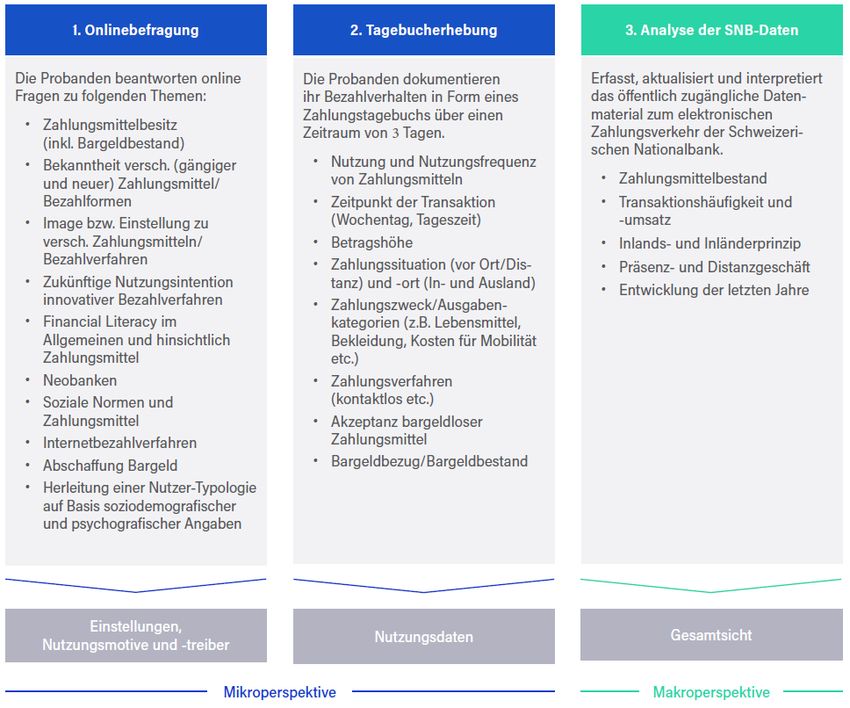
Swiss Payment Monitor 1/2021                                                 University of St.Gallen/ZHAW

cash per month on average (see chapter 5). Women were statistically significantly more likely
than men to report having less cash in their wallets, drawing less cash and paying less with
cash. Conversely, the German-speaking Swiss have more cash in their wallets than
respondents from the Italian-speaking part of Switzerland.
A majority of respondents said they pay more or very much more with contactless debit and
credit cards (60% and 50% respectively) than before the corona pandemic. 52% of respondents
said they used mobile payment solutions more. The German-speaking Swiss in particular used
conventional debit cards less frequently than respondents from the French-speaking part of
Switzerland.

                Figure 2: Change in payment behaviour due to the corona pandemic

            Question: To what extent has the corona virus changed your payment behaviour?

                                                                                                       9
Swiss Payment Monitor 1/2021 University of St.Gallen/ZHAW
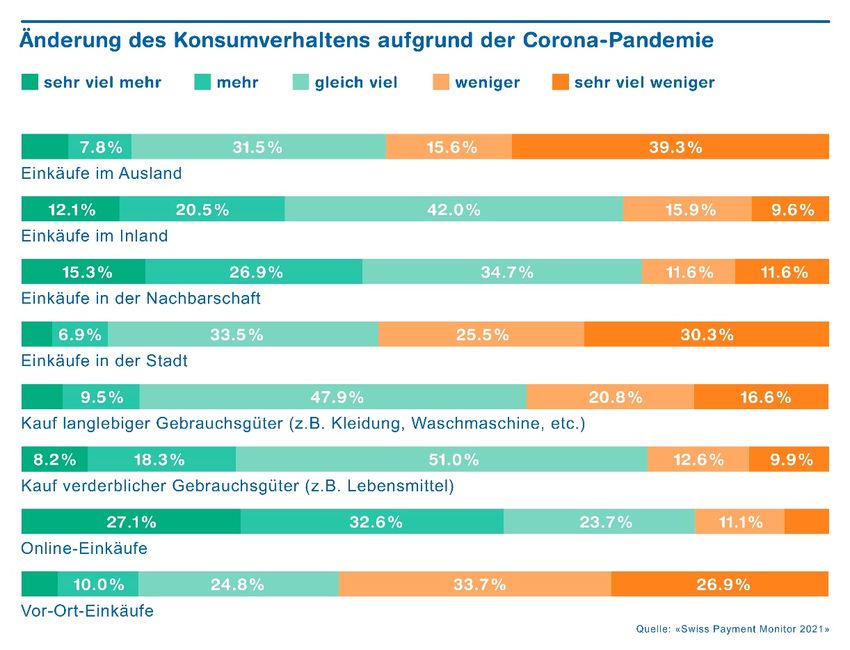
Figure 3: Change in consumption patterns due to the corona pandemic
Question: To what extent has the coronavirus changed your consumption behaviour?
Payment behaviour correlates strongly with consumption behaviour. In the first step,
decisions are made about how to satisfy needs (consumption) and only in the second step how
these services and goods are paid for. For this reason, the Swiss population was also asked
within the framework of the SPM to what extent they had changed their consumption
behaviour as a result of the corona pandemic. The results show that women have changed
their consumption and payment behaviour to a statistically significantly greater extent than
men due to the coronal pandemic.
Figure3 makes it clear that over half of the people said they had made fewer purchases locally
in the shop (61%), in town (56%) and abroad (55%) than before the corona pandemic. Women
in particular were significantly more likely than men to say they had reduced their on-site
purchases. Sixty percent and 42% of respondents said they had shopped significantly more
online and in the neighbourhood. 2 High-income individuals in particular increased their
online and on-site purchases. A majority additionally stated that they had purchased about
the same amount of durable and perishable consumer goods as before the outbreak of the
corona pandemic.
2These findings are in line with the aggregated dataof payment cards evaluated by the project
"Monitoring Consumption Switzerland".
10Swiss Payment Monitor 1/2021 University of St.Gallen/ZHAW
3.2 Effective behaviour change
With the help of the diary survey, the effective changes in behaviour with regard to payment
habits can be mapped. Figures4 and 5 show the development of the share of turnover
(measured against total expenditure) and the share of transactions (measured against the total
number of transactions) of different payment methods over time. 3The values from previous
years are based on the data in the Swiss Payment Monitor 2019 and 2020.
The credit card is the payment method with the highest turnover in Switzerland (cf. Figure4):
people spend the most money with it, namely 24% of their expenditure. It is followed by the
bill (22%), the debit card (21%) and cash (13%). The share of sales from mobile devices (above
all with mobile phones) ranks fifth with 8 per cent, followed by internet payment methods
such as Paypal (7.5%).
Compared to the previous year, the credit card (+3 percentage points [PP] share of turnover)
has thus replaced the debit card (-7 PP) from the top position. The bill (+5 PP) has displaced
cash (-10 PP) from second place. This is undoubtedly due to the fact that during the corona
pandemic and the associated limited consumption options, the Swiss population increasingly
shopped online, where people generally order more frequently by credit card and on account,
especially for higher amounts. In addition, there were not yet many new debit cards in
circulation during the survey period that could be used for online payments.
Measured by the number of transactions, cash is still the most frequently used means of
payment with a share of 32 percent (cf. Figure5), just ahead of the debit card (31%) and the
credit card (18%). 9 per cent of total transactions are carried out with mobile devices. However,
cash use declined by around 13 pp compared to the previous year in terms of number of
transactions, while the share of debit and credit cards increased by around 4 pp and that of
mobile payments by around 3 pp. Cash payments decreased especially in the small-value
segment (less than CHF 20).
3The results from the SPM show how this expenditure is distributed among the various means of
payment. The absolute figures on the amount of total expenditure or the total number of transactions
with non-cash means of payment are classified in chapter 3.3 using the publicly available data.
11Swiss Payment Monitor 1/2021 University of St.Gallen/ZHAW
Figure 4: Cash shares by domestic turnover
Remarks: According to diary entries, only domestic payments
12Swiss Payment Monitor 1/2021 University of St.Gallen/ZHAW
Figure 5: Cash shares by number of transactions
Remarks: According to diary entries, only domestic payments
13Swiss Payment Monitor 1/2021 University of St.Gallen/ZHAW
3.3 Behavioural change in a macroeconomic context
A comparison of the results of the current Swiss Payment Monitor shows that in the last three
years there has been a shift in the shares from cash to cashless means of payment (see figures4
and 5). However, this still says nothing about the absolute development of the number of
transactions and total spending with debit and credit cards.
Figure6 to Figure9 show the development of payments with Swiss debit and credit cards in
the overall economic context according to data from the Swiss National Bank. In 2020, around
515 million transactions were made with credit cards in Switzerland for a total amount of
around CHF 40 billion. Fr. were made with credit cards. It can be seen that the corona
pandemic halted the growth trend compared to 2019 and instead led to a decline in credit card
transaction frequency and turnover of -2.8 and -15.4 per cent respectively. This was mainly
due to the significant decline in foreign payments, both in terms of number of transactions (-
15.2%) and revenue (-35.1%). Travel restrictions and the absence of shopping tourism were the
main reasons for this decline. Conversely, credit card transactions and turnover in Switzerland
increased by around 5 and 1 percent respectively (cf. figures6 and 8). This shows that Swiss
credit card holders also increasingly paid smaller amounts by credit card in 2020.
In contrast to the credit card, the 2020 corona pandemic had an overall positive impact on the
steady growth in the number of debit card transactions and turnover, which has been ongoing
for years. The number of transactions with debit cards in Switzerland rose by an above-
average 13.3 per cent to 1.183 billion compared to 2019. Turnover increased by 11.4 per cent to
CHF 58 billion. Fr. On the one hand, the Swiss population paid more frequently with the debit
card instead of cash during the corona pandemic, and on the other hand, they spent more on
goods (for everyday needs), which are often paid for with the debit card.
In contrast, similar to the credit card, the number and turnover of foreign payments with debit
cards declined in 2020 compared to 2019 (-26.6% and -31,2%). In the case of the debit card,
however, foreign business already accounted for only a small share before 2020 and was still
around 3% of transactions and around 5% of turnover in 2020 (cf. figures7 and 9).
14Swiss Payment Monitor 1/2021 University of St.Gallen/ZHAW
Figure 6: Transaction frequency of domestic credit cards
600
529.6 514.5
500 465.4
400.7 200 170
400 344.6 183
296.5
m.
269.7 159
300
240.2 140
215.7
190.3 125
200 168.0 120
129.8 141.5 151.8 109 345
107.4 113.6 97 329
72 86 282
55 62 241
100 48 52 204
45 150 172
104 119 131
66 78 86 90 96
62
0
2005 2006 2007 2008 2009 2010 2011 2012 2013 2014 2015 2016 2017 2018 2019 2020
Domestic credit card transactions abroad
Domestic credit card transactions within the country
Total domestic credit card transactions
Figure 7: Transaction frequency of domestic debit cards
1400
1'182.9
1200
1'060.7
34
1000 934.3
47
817.1
737.5 41
800
668.9 37
Mio.
32
600 508.8 28
460.9
400.8 435.6
324.4 352.2 373.7 23
400
259.4 274.6 290.6 13 17 20
7 9
4 5
200 3 4
257 271 286 319 345 365 388 419 441 486 641 705 780 893 1'014 1'149
0
2005 2006 2007 2008 2009 2010 2011 2012 2013 2014 2015 2016 2017 2018 2019 2020
Domestic debit card transactions abroad
Domestic debit card transactions within the country
Total domestic debit card transactions
15Swiss Payment Monitor 1/2021 University of St.Gallen/ZHAW
Figure 8: Domestic credit card turnover
50 46.6
43.9
45
40.3 39.5
40 36.8
34.5 34.9
35 32.7 21
30.8 21
29.2 14
30 27.3 26.8 28.4 19
25.9 17
Mia. Fr.
22.9 17 17
25 21.1 16
14 15
12 12 13
20 12
11
15 10
23 25 26
10 20 21
16 17 18 18
14 15 15 15 16
5 12 12
0
2005 2006 2007 2008 2009 2010 2011 2012 2013 2014 2015 2016 2017 2018 2019
Domestic credit card turnover abroad
Domestic credit card turnover in the country
Total domestic credit card sales
Figure 9: Domestic debit card turnover
70
58.1
60
53.6
50.9
47.9 3
50 44.3 46.0 4
4
3
40 36.1 3 3
33.3 34.3
Mia. Fr.
30.3 31.4
27.5 28.6 2
30 2
23.6 25.2 1
2
21.8 1
1 1
20 1 1
0
10
21 23 25 27 28 29 30 31 32 34 42 43 44 47 50 55
0
2005 2006 2007 2008 2009 2010 2011 2012 2013 2014 2015 2016 2017 2018 2019
Domestic debit card turnover Domestic debit card turnover abroad
Total domestic debit card sales
16Swiss Payment Monitor 1/2021 University of St.Gallen/ZHAW
4 Mobile payment
In mobile payments, the transaction is made with or on a mobile device such as a mobile
phone. As can be seen in Figure4, such mobile payments already account for 8 per cent of
turnover and have thus more than doubled within one year. The number of transactions with
mobile devices has also increased by more than half to 9 percent (see Figure5). These shares
are relatively stable across all amounts. In the case of very small and small amounts (amounts
smaller than CHF 5 or CHF 20) as well as online payments, the growth was particularly
pronounced compared to the previous year. Smaller amounts are also increasingly being paid
by mobile phone.
In the distance business (online trade), mobile payment even accounts for the largest share
with almost 30% of transactions, followed by invoice (29%) and credit card (23%). Measured
by the share of turnover, invoice (45%), internet payment methods (17%) 4and credit cards
(15%) dominate in online retail.
Mobile payments are most frequently made via apps with integrated payment functions (21%
of transactions via mobile devices). One example of this is the purchase of tickets in apps of
public transport companies. In addition, many people use their mobile phones to pay in shops
via QR code (20%), via contactless data transfer (NFC) (13%) and for transfers to private
individuals (10%). Most money is spent online with mobile devices (28% of turnover via
mobile devices), followed by spending in an app with an integrated payment function (22%)
and in a shop via QR code (13%).
Twint is by far the most used mobile payment solution in Switzerland: 74 per cent of turnover
and 78 per cent of transactions with mobile devices are processed with Twint. Apple Pay, on
the other hand, accounts for around 13 per cent of turnover and 9 per cent of transactions with
mobile devices.
In-app payments are the mobile payment form that people like best, followed by transfers to
private individuals via payment apps such as Twint, as well as paying on the internet via QR
code and with stored payment data (cf. Figure10). Less popular are the two mobile forms of
payment via QR code and NFC in shops. Payment with wearables (e.g. watch or wristband)
and with a mobile phone via Bluetooth in a shop are in the last two places. Among people over
60, all forms of mobile payment are statistically significantly less popular than among younger
people.
4 For example, Paypal, Sofortüberweisung or Giropay.
17Swiss Payment Monitor 1/2021 University of St.Gallen/ZHAW
Figure 10: Popularity of mobile payments
Question: Quite spontaneously: How well do you like mobile payment ...?
Note: Mean values, scale from "I don't like it at all" (1) to "I like it very much" (5).
5 A look into the wallet
A look in the wallet also clearly shows that the changes in consumption and payment
behaviour explained by the respondents due to the corona pandemic are also reflected in cash
withdrawals and cash holdings (cf. Figure11). While the average 5 person living in Switzerland
still drew 150 Swiss francs in cash per month in the previous year, the monthly cash
withdrawal in the latest survey fell by 33 per cent to 100 Swiss francs. The average amount of
cash in the wallet also fell by about a third compared to the last survey, from 70 Swiss francs
to 50 Swiss francs.
The growing importance of cashless payment transactions is also evident in the development
of the number of payment cards. The number of payment cards in the wallets of Swiss people
rose again this year, from 3.9 to 4.7 cards per person, an increase of 21 percent. However, the
increase in the number of cards is less pronounced compared to the growth of the previous
year (2020: +33%). It is also noticeable that more than two-thirds of all card payments are now
processed contactlessly. As already described in chapter 3.2, the credit card has gained in
5 Throughout the section "A look in the wallet", median values are shown for the "average Swiss".
18Swiss Payment Monitor 1/2021 University of St.Gallen/ZHAW
importance compared to the other means of payment and is the means of payment with which
the average Swiss spends the most money.
Despite these developments and the current situation, cash is still of central importance to the
vast majority of Swiss people. Thus, less than one in ten respondents (8%) completely renounce
the possession of cash. In addition, chapter 3.2 has shown that the average Swiss still pays
most frequently with cash compared to the other means of payment.
Figure 11: View into the wallet of an "average Swiss
6 Neobanks
6.1 Awareness and use
Overall, around two-thirds of people in this country know at least one of the most popular
neobanking providers. The best-known providers, as shown in Figure12, are Credit Suisse's
CSX (40% awareness share), Revolut (37%) and Zak (29%).
One fifth of Swiss people have already used new online banking solutions from a new bank at
least once. Men and German-speaking Swiss use neobanks statistically significantly more
often than women and people from Latin-speaking Switzerland. Revolut is used most
frequently (10% of respondents), followed by TransferWise (like Revolut, a British provider)
19Swiss Payment Monitor 1/2021 University of St.Gallen/ZHAW
and the Swiss provider Neon (6% of respondents each). The large gap between those who
know Credit Suisse CSX and those who use it can be explained by the fact that this offering
was only launched in October 2020 and publicised with a broad marketing campaign. In
addition, the name of the well-known big bank is part of the name of the digital banking
offering CSX, which could have led to an overestimation of the proportion of CSX
connoisseurs.
Figure 1213: Awareness and use of neobanks
Question: Please indicate for each provider which of the respective statements applies to you.
6.2 Reasons and purpose of use
According to Figure13, the main reasons for using neobanks are quick transfer of funds (64%),
easy and practical handling (54%) and constant availability (54%). Interestingly, the
advantageous fee structure and especially the favourable exchange rates of neobanks, which
were at the top of the most important reasons for use in previous years, were replaced in the
current survey.
20Swiss Payment Monitor 1/2021 University of St.Gallen/ZHAW
Three-fifths of neobank users use neobank online banking services in addition to traditional
providers for certain selected purposes. More than a quarter of users already use neobanks as
their primary means of payment or as their main banking connection, with respondents from
French-speaking Switzerland being proportionally overrepresented in this group. Around
11% of users stated that they had cancelled the services of a traditional provider due to the
new online banking services. Another 30 percent intend to do so in the future. Young, well-
educated respondents in particular have already cancelled parts of their traditional banking
services, whereas older users of new banks with higher incomes have taken this step (even)
less frequently.
Figure 14: Reasons for using the services of neobanks
Question: What is the reason or reasons for use? Multiple answers possible.
7 Closing words
The aim of this fourth edition of the Swiss Payment Monitor was to record the changes in the
payment behaviour of the Swiss population and the latest developments in the payment
market against the background of the corona pandemic. With the help of a representative
online survey and subsequent diary recording of all payments by the participants, in
combination with the analysis of macroeconomic payment card data, various findings were
obtained as follows.
21Swiss Payment Monitor 1/2021 University of St.Gallen/ZHAW
The use of cash by the Swiss population declined significantly due to the corona pandemic in
favour of digital payment solutions such as payment cards and mobile payment solutions. On
the one hand, this was due to changes in consumer habits such as increased online shopping,
which is why more people paid by invoice, and on the other hand, there was a substitution of
cash payments by cashless means of payment at physical points of sale. As a result, the credit
card became the payment method with the highest turnover, whereas cash is now only just
ahead of the debit card in terms of the number of transactions. Compared to the previous year,
the average Swiss carries less and less cash and withdraws smaller amounts per cash
withdrawal.
Overall, credit card spending and transactions have decreased in 2020 compared to 2019,
especially due to the strong decrease in foreign business because of the Corona pandemic. In
contrast, debit card sales and number of transactions have increased above average due to the
substitution of cash payments at physical points of sale and changing consumer behaviour.
Mobile payment options, especially Twint, have established themselves. Regardless of the
amount, they now account for almost 10 per cent of turnover and the number of transactions
(excluding peer-to-peer payments). In particular, growth in the small-value segment and in
online commerce has been enormous. In the distance business, payment with mobile devices
dominates in terms of the number of transactions. Mobile payments are most common in an
app and at the stationary point of sale. The most popular types of mobile payment are in-app
payments and transfers to private individuals.
One fifth of the Swiss population has used services from a neobank at least once, especially
from Revolut, TransferWise and Neon. The simple and practical handling as well as the quick
transfer of funds and the constant availability of neobanks are the main reasons for their use.
A majority uses neobanks as a supplement to existing services. Around one third are thinking
about cancelling services from an existing provider.
Are the changes in payment behaviour described above, which were triggered by the corona
pandemic, persistent? How will mobile payments continue to develop? Will neobanks replace
conventional offers step by step? The increasing dynamism in the market, which is reflected
in these questions, has prompted us to study the payment behaviour of the Swiss population
every six months in future (instead of annually up to now). The next survey will take place in
May 2021, after which the fifth edition of the Swiss Payment Monitor will be published in a
similar form as version 2/2021.
22Swiss Payment Monitor 1/2021 University of St.Gallen/ZHAW
Study authors
Sandro Graf, Lecturer Marketing, Head of Service Lab & Swiss Payment Research Center,
Institute of Marketing Management, ZHAW School of Management and Law
Dr Nina Heim, Senior Research Consultant, Institute of Marketing Management, ZHAW
School of Management and Law
Dr Marcel Stadelmann 6, Senior Research Consultant, Project Manager Swiss Payment
Research Center, Institute of Marketing Management, ZHAW School of Management and
Law. E-mail: marcel.stadelmann@zhaw.ch
Dr Tobias Trütsch6, Head of Economics Division & Swiss Payment Behaviour Lab,
Executive School of Management, Technology and Law, University of St.Gallen. E-mail:
tobias.truetsch@unisg.ch
Suggested citation:
Graf, S., Heim, N., Stadelmann, M. and Trütsch, T. (2021): Swiss Payment Monitor 2021 – How
does Switzerland pay?, Short Report Issue 1/2021, University of St.Gallen/Zurich University
of Applied Sciences.
6 Corresponding authors
23You can also read