Third Quarter 2020 Earnings Presentation

Page created by Carolyn Nunez
 
CONTINUE READING
Third Quarter 2020 Earnings Presentation
Third Quarter 2020
                   Earnings Presentation

October 22, 2020
Third Quarter 2020 Earnings Presentation
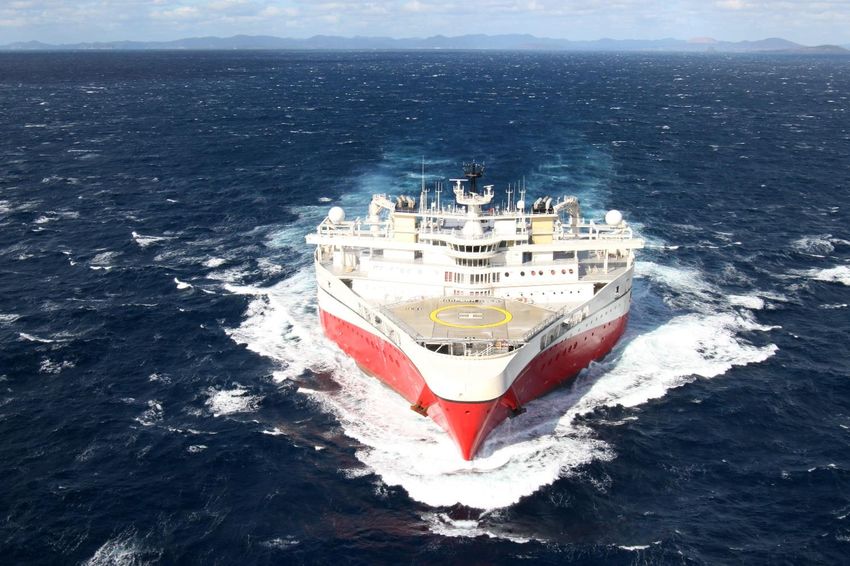
Cautionary Statement

      This presentation contains forward looking information

      Forward looking information is based on management
       assumptions and analyses

      Actual experience may differ, and those differences may be material

      Forward looking information is subject to significant uncertainties
       and risks as they relate to events and/or circumstances in the future

      This presentation must be read in conjunction with the press release
       for the third quarter 2020 results and the disclosures therein

                                                                               -2-
Third Quarter 2020 Earnings Presentation
Q3 2020 Takeaways:
Actively Addressing a Challenging Market

                                      Seismic market remained challenging in Q3
                                           – Revenues significantly impacted
                                           – Almost exclusively MultiClient acquisition

                                      Realizing substantial cost reductions already in Q3
                                           – New organization fully operational

                                      Signed binding agreements with majority of lenders
                                       to defer debt maturities and amortization by ~2
                                       years

                                      Expect higher revenues from vessel operation and
                                       MultiClient sales going forward

                                                                                             -3-
Third Quarter 2020 Earnings Presentation
Financial Summary
                                                           Segment Revenues                                                                                                                Segment EBITDA*

              300                                                                        288                                                                                                                         194
                                                                                                                                                     200

                                                 245                                                                                                                                                        160
                                                                             234                                                                                                155
                                                                   216                                                                               150        136
                              199                                                                                                                                      133                         135
                     198
USD million

              200                       192

                                                                                                                                       USD million
                                                                                                     168
                                                                                                                                                                                                                                         99
                                                          142                                                  139                                         92
                                                                                                                                                     100                                                                                          88
                                                                                                                                                                                                                               81
                                                                                                                           116
                                                                                                                                                                                          67
              100
                                                                                                                                                      50

               0                                                                                                                                       0

              100
                                                               Segment EBIT**                                                                                                   Cash Flow from Operations
                                                                                                                                                     200
               80                                                                   70                                                                                                                                        176

                                                                                                                                                                                                            152
               60
                                                 48
                                                                                                                                                     150               133
                                                                           38                                                                                   122             117      119
               40
USD million

                                                                                                                                     USD million
                                                                                                                                                                                                  108
                                                                                                                                                                                                                      95
                                                                  18                                                                                 100
               20               14
                                                                                                           7                                               73
                                                                                                                                                                                                                                        68       66
                                                                                                                     0.5
                0
                                        -3                                                                                                            50
               -20                                                                             -16
                      -23
                                                         -29
               -40                                                                                                                                     0

              *EBITDA, when used by the Company, means EBIT excluding Other charges, impairment and loss/gain on sale of long-term assets and depreciation and amortization as defined in Note 14 of the Q3 2020 earnings release published on October 22. 2020.
              **Excluding impairments and Other charges.                                                                                                                                                                                                      -4-
Third Quarter 2020 Earnings Presentation
Maintaining Order Book Level

              300

                                Order book of USD 160 million at
                                 September 30, 2020
                                  – USD 52 million relating to
              200
                                    MultiClient
USD million

                                Vessel booking*
              100
                                  – Q4 20: 11 vessel months
                                  – Q1 21: 6 vessel months
                                  – Q2 21: 1 vessel month

                0

  *As of October 14, 2020.                                          -5-
2020 Guidance

     Group gross cash cost below USD 450 million
      – Excluding ~USD 35 million restructuring costs

     MultiClient cash investments of ~USD 225 million
      – ~65% of 2020 active 3D vessel time allocated to MultiClient

     Capital expenditures below USD 40 million

                                                                      -6-
Financials
                   Unaudited Third Quarter 2020 Results

October 22, 2020
Consolidated Key Financial Figures
                                                                                                                                              Q3                        Q3                     Year to date             Year to date     Full year
                         USD million (except per share data)                                                                                 2020                      2019                       2020                     2019            2019
                         Profit and loss numbers Segment Reporting
                         Segment revenues                                                                                                           116.1                     234.2                           423.1             591.7           880.1
                         Segment EBITDA                                                                                                              88.4                     160.1                           268.1             362.0           556.1
                         Segment EBIT ex. Impairment and other charges, net                                                                           0.5                      37.9                            (8.3)            26.3             96.4

                         Profit and loss numbers As Reported
                         Revenues and Other Income                                                                                                   85.1                     276.5                            304.3             598.2          930.8
                         EBIT                                                                                                                       (4.3)                     50.3                           (166.6)              0.4           54.6
                         Net financial items, other                                                                                                (24.3)                    (12.9)                           (87.1)            (66.7)         (92.2)
                         Income (loss) before income tax expense                                                                                   (28.6)                     37.4                           (253.7)            (66.3)         (37.6)
                         Income tax expense                                                                                                         (4.0)                      (5.9)                            (7.6)           (16.3)         (34.1)
                         Net income (loss) to equity holders                                                                                       (32.6)                     31.5                           (261.3)            (82.6)         (71.7)
                         Basic earnings per share ($ per share)                                                                                   ($0.08)                    $0.09                           ($0.69)           ($0.24)        ($0.21)

                         Other key numbers
                         Net cash provided by operating activities                                                                                   65.9                    151.9                         309.3                379.5           474.3
                         Cash Investment in MultiClient library                                                                                      56.8                     75.7                         189.2                203.5           244.8
                         Capital expenditures (whether paid or not)                                                                                   8.4                     10.7                          24.7                 41.4            59.1
                         Total assets                                                                                                             2,137.8                  2,262.4                       2,137.8              2,262.4         2,301.7
                         Cash and cash equivalents                                                                                                  193.7                     36.0                         193.7                 36.0            40.6
                         Net interest bearing debt                                                                                                  919.7                  1,015.9                         919.7              1015.9          1,007.5
                         Net interest bearing debt, including lease liabilities following IFRS 16                                                 1,078.8                  1,220.3                       1,078.8              1,220.3         1,204.6

                          As Reported Q3 and YTD 2020 revenues lower than Segment due to difference in when revenues are recognized
                                   –       Difference expected to reduce substantially in Q4
The accompanying unaudited financial information has been prepared under IFRS. This information should be read in conjunction with the unaudited third quarter 2020 results, released on October 22, 2020.                                              -8-
Q3 2020 Operational Highlights
                                                    Contract revenues                                                                                            Segment MultiClient revenues
              120.0                                                                                               100%                 200                                                                                                          200%
                                                                                   104                            90%
              100.0                                                94
                                                                                                                  80%
                                                                                           85
                                                                                                                                       150                                                                                                          150%
                                                                           76                                     70%
                  80.0
USD million

                                                                                                                         USD million
                                                                                                                                                        69
                                                                                                                  60%                                             56                                     54       113
                                                                                                                                                                         164
                  60.0                                                                                            50%                  100    84                                                                                                    100%
                                                                                                                                                                                               46
                           45                      41      44                                                     40%                                                                                                               36
                  40.0                     34
                                                                                                   31             30%                                                                61                                                      28
                                    30                                                                                                                                                                                     34
                                                                                                                                        50              94        96                                     95                                         50%
                                                                                                                  20%
                  20.0                                                                                                                        59                                               67                 65                66
                                                                                                            9                                                                                                                                50
                                                                                                                  10%                                                    34                                                41
                                                                                                                                                                                     30
                   0.0                                                                                            0%                     0                                                                                                          0%
                          Q1 18   Q2 18   Q3 18   Q4 18   Q1 19   Q2 19   Q3 19   Q4 19   Q1 20   Q2 20   Q3 20                              Q1 18    Q2 18     Q3 18   Q4 18      Q1 19     Q2 19      Q3 19    Q4 19   Q1 20    Q2 20    Q3 20

                                   Contract revenues               % active 3D capacity allocated to contract                                MultiClient pre-funding           MultiClient late sales           Pre-funding as % of MC cash investments
                                                                                                                                                                                                                Targeted pre-funding level 80-120%

                        Total Segment MultiClient revenues of USD 78.7 million                                                         Other Income of USD 23.6 million
                           –      Pre-funding level of 89%                                                                                    –       Primarily ~USD 23.2 million of government grants
                           –      Late sales of USD 28.3 million

                        Contract revenues of USD 9.3 million
                           –      Only 2% of total time used for Contract acquisition
                                                                                                                                                                                                                                                          -9-
Pre-funding and Late Sales Revenues Combined:
Segment MultiClient Revenues by Region

              200

              175

                                                                                                                                    Middle East, Europe and
              150
                                                                                                                                     North America main
                                                                                                                                     contributors to pre-funding
USD million

              125

                                                                                                                                     revenues in Q3 2020
              100

              75
                                                                                                                                    Europe and South America
              50
                                                                                                                                     main contributors to late
                                                                                                                                     sales
              25

                0
                    Q1 18   Q2 18      Q3 18        Q4 18     Q1 19     Q2 19      Q3 19        Q4 19      Q1 20   Q2 20   Q3 20

                                    Europe     Africa   Middle East   N. America   S. America     Asia Pacific
                                                                                                                                                                   10
Seismic Streamer 3D Fleet Activity in Streamer Months:
 Vessel Allocation* and Utilization
                                                      Quarterly vessel allocation

   100%

    80%
                                                                                                                               71% active vessel time in Q3 2020

    60%
                                                                                                                               Five vessels in operation in Q3
                                                                                                                                  – Plan to keep five vessels through
    40%
                                                                                                                                    winter season

    20%
                                                                                                                               Expect some standby time in Q4

     0%
             Q1 18       Q2 18       Q3 18         Q4 18       Q1 19    Q2 19       Q3 19   Q4 19    Q1 20    Q2 20   Q3 20

                                        Contract         MultiClient   Steaming      Yard   Stacked/Standby

* The vessel allocation excludes cold-stacked vessels.
                                                                                                                                                                        -11-
Cost* Focus Delivers Results
                                                                          Gross cash cost ex. steaming deferral
                                                                                                                                                                                                              Implemented cost reductions to
                                                                                                                                                                                                               achieve annualized gross cash
                              156             156             154                                                             154                             154
                 150                                                                                          148
                                                                                                                                              142
                                                                                                                                                                                                               cost run rate below USD 400
                                                                              136             136
                                                                                                                                                                                                               million from Q3 2020
                                                                                                                                                                              110
USD million

                                                                                                                                                                                                              Substantial Q3 gross cash cost
                 100

                                                                                                                                                                                               82

                                                                                                                                                                                                               reduction

                  50

                                                                                                                                                                                                              Full year 2020 gross cash cost
                                                                                                                                                                                                               expected to be below USD 450
                   -
                             Q1 18           Q2 18           Q3 18           Q4 18           Q1 19           Q2 19           Q3 19           Q4 19           Q1 20           Q2 20           Q3 20
                                                                                                                                                                                                               million
                                         Cost of Sales                  Research and development costs                         Selling, general and administrative costs

              *Gross cash cost are defined as the sum of reported net operating expenses (excluding depreciation, amortization, impairments, deferred steaming and Other charges) and the cash operating costs capitalized as investments in the MultiClient library as wel l as capitalized development costs”
                                                                                                                                                                                                                                                                                                                  -12-
Consolidated Statements of Cash Flows Summary
                                                                                                                  Q3                       Q3                    Year to date             Year to date             Full year
          USD million                                                                                            2020                     2019                        2020                     2019                  2019
           Cash provided by operating activities                                                                          65.9                   151.9                       309.3                    379.5                 474.3
           Investment in MultiClient library                                                                             (56.8)                   (75.7)                     (189.1)                  (203.5)               (244.8)
           Capital expenditures                                                                                           (0.3)                   (22.2)                      (23.8)                      (50.4)             (62.0)
           Other investing activities                                                                                     (2.0)                    (4.4)                       18.3                        57.4               54.3
           Net cash flow before financing activities                                                                       6.8                     49.6                      114.7                    183.0                 221.8
           Net proceeds from issuance of debt                                                                                 -                        -                     124.2                            -                   -
           Interest paid on interest bearing debt                                                                        (22.0)                   (14.0)                      (54.6)                      (42.9)             (60.9)
           Repayment of interest bearing debt                                                                                 -                   (12.9)                     (240.3)                      (38.5)             (51.2)
           Net change drawing on RCF                                                                                          -                    (5.0)                     170.0                        (95.0)             (85.0)
           Payment of lease liabilities (recognized under IFRS 16)                                                       (14.1)                   (14.9)                      (41.0)                      (45.1)             (58.6)
           (Increase) in non-current restricted cash related to debt service                                             (11.9)                        -                      (11.9)                          -                   -
           Proceeds from share issue                                                                                          -                        -                       91.9                           -                   -
           Net increase (decr.) in cash and cash equiv.                                                                  (41.2)                     2.8                      153.0                        (38.5)             (33.9)
           Cash and cash equiv. at beginning of period                                                                  234.9                      33.2                       40.6                        74.5                 74.5
           Cash and cash equiv. at end of period                                                                        193.7                      36.0                      193.7                        36.0                 40.6

           Q3 2020 cash flow impacted by lower earnings
           Increase in non-current restricted cash of USD 11.9 million
                   –      Amounts transferred to retention accounts for ECF debt service remain on such accounts following agreement with ECF lenders not to pay
                          September installment
                   –      When debt rescheduling transaction completes, funds will be used to service interest on ECF debt

           Received ~USD 23.2 million of government grants in Q3 2020
 The accompanying unaudited financial information has been prepared under IFRS. This information should be read in conjunction with the unaudited third quarter 2020 results released October 22, 2020.                               -13-
Balance Sheet Key Numbers

                                                                                                                                      September 30                      September 30                         December 31
       USD million                                                                                                                            2020                              2019                            2019
       Total assets                                                                                                                                   2,137.8                           2,262.4                     2,301.7
       MultiClient Library                                                                                                                               689.4                             652.3                       558.6
       Shareholders' equity                                                                                                                              452.6                             615.9                       637.1
       Cash and cash equivalents (unrestricted)                                                                                                          193.7                               36.0                       40.6
       Restricted cash                                                                                                                                     57.5                              41.8                       43.0
       Liquidity reserve                                                                                                                                 194.1                             216.0                       210.6
       Gross interest bearing debt                                                                                                                    1,170.9                           1,093.7                     1,091.1
       Gross interest bearing debt, including lease liabilities following IFRS 16                                                                     1,330.0                           1,298.1                     1,288.2
       Net interest bearing debt                                                                                                                         919.7                          1,015.9                     1,007.5
       Net interest bearing debt, including lease liabilities following IFRS 16                                                                       1,078.8                           1,220.3                     1,204.6

         Liquidity reserve of USD 194.1 million held in cash

         All interest bearing debt, excluding lease liabilities, classified as current pending finalization of the debt
          rescheduling transaction
                –      When finalized, re-classification will be reversed

 The accompanying unaudited financial information has been prepared under IFRS. This information should be read in conjunction with the unaudited third quarter 2020 results released on October 22, 2020.                     -14-
Summary of Debt and Drawing Facilities
  Existing Agreements Before Rescheduling of Debt – Facilities are in Default
     As of September 30, 2020:

     Long-term Credit Lines and Interest Bearing Debt                                                                  Nominal Amount                       Total Credit Line                 Financial Covenants

     Term Loan B (“TLB”), due March 2024                                                                                     USD 520m                                                         None, but incurrence test: total net leverage
     Libor +600-700 bps (linked to total leverage ratio – “TGLR”)*                                                                                                                            ratio ≤ 2.00x**

     Term Loan B, due March 2021                                                                                               USD 2m
     Libor +250 basis points

     Revolving credit facility (“RCF”), due September 2023                                                                   USD 215m                            USD 215m                     Maintenance covenant: total net leverage ratio
     Libor + margin of 450-600 bps (linked to TGLR)* + utilization fee                                                                                                                        ≤ 2.75x** and minimum liquidity the higher of
                                                                                                                                                                                              USD 75 million or 5% of net interest bearing
                                                                                                                                                                                              debt
     USD 135 million RCF due September 2020                                                                                  USD 135m                            USD 135m
     Libor + margin of 325-625 bps (linked to TGLR) + utilization fee

     Japanese ECF, 12 year with semi-annual instalments. 50%                                                                 USD 298m                                                         None, but incurrence test for loan 3&4:
     fixed/ 50% floating interest rate                                                                                                                                                        Total leverage ratio ≤ 3.00x** and Interest
                                                                                                                                                                                              coverage ratio ≥ 2.0x**

*If rating below B3/B- (stable outlook) from Moody’s or S&P, respectively, TLB margin 7.50% and RCF margin 6.50%.
**Total Net Leverage Ratio is the ratio of consolidated indebtedness (including IFRS lease liabilities) of PGS ASA net of consolidated unrestricted cash and cash equivalents and restricted cash held for debt service in respect of the Export Credit
Financing divided by 12 month rolling EBITDA adjusted for non pre-funded MultiClient investments.
                                                                                                                                                                                                                                                          15
Agreements to Reschedule Debt(1)

   Lock-up agreement (the “Lock-Up Agreement”)(2) with lenders representing 79.6% of the aggregate of the $350 million RCF and ~$522 million
    TLB

   Consent and amendment agreement (the “Consent and Amendment Agreement”)(3) with the finance parties under the ~$300 million ECF

   The Lock-Up Agreement and the Consent and Amendment Agreement outline the agreed amendments and also maintain the forbearance
    arrangements previously agreed

   Unless 100% of the RCF and TLB Lenders consent to the Transaction, the amendments to the RCF and TLB will be implemented pursuant to
    an English law scheme of arrangement upon approval of the English Court, after obtaining the necessary majority creditor consent (being 75%
    by value and a majority in number of the total RCF and TLB voting in the Scheme) (the “Scheme”)

   The Scheme will enable the Transaction in respect of the RCF and TLB to be implemented and bind all RCF and TLB lenders (including those
    who vote against or do not vote)

   To date, lenders holding a sufficient amount of RCF and TLB debt to meet the relevant Scheme approval levels have already signed the Lock-
    up Agreement

   The agreed amendments to the RCF, TLB and ECF facilities are inter-conditional and subject to customary conditions and remain subject to
    the implementation processes described above

Notes:
1. Reference is made to the separate release issued by the Company on October 21, 2020
2. The terms of the Lock-Up Agreement are effective immediately and subject to customary undertakings and termination events
3. The terms of the Consent and Amendment Agreement, other than the amendment terms, are effective immediately and are subject to customary termination events. The amendment terms will become effective upon the consummation of the Transactions.

                                                                                                                                                                                                                                                       16
Main Terms of the Transaction
 No scheduled debt maturities until September 2022
       –        The $350 million RCF(1) to be converted into a new TLB on the same terms as the 2024 TLB
       –        The 5% annual amortization in 2021 and 2022 on the existing 2024 TLB is removed
       –        The combined TLB facilities of ~$872 million(2) maturing in March 2024 will have following amortization profile:
                  • ~$135 million amortization payment in September 2022
                  • $200 million amortization payment in September 2023
                  • ~$9 million quarterly amortization starting March 2023
       –        ECF amortization totalling ~$106 million due over the next two years deferred and repaid over four quarters starting December 2022

 Excess liquidity sweep
       –        Excess liquidity sweep for liquidity reserve above $200 million at each quarter end to be applied to the deferred amortization amounts under the ECF and the ~$135
                million TLB amortization until both have been repaid
       –        Thereafter, excess liquidity sweep for liquidity reserve above $175 million to applied against the remaining TLB

 Financial maintenance covenants
       –        Maximum net leverage ratio of 4.5x through June 30, 2021, 4.25x through December 31, 2021, 3.25x through December 31, 2022 and 2.75x thereafter

 Convertible Bond
       –        Issuance of an up to ~NOK 116.2 million 3-year 5% unsecured convertible bond (the “CB”) convertible into new PGS shares at NOK 3 per share (maximum of
                38,720,699 shares/10% of the currently outstanding shares)
       –        Lenders under the RCF and TLB facilities will have a pro rata preferential right to subscribe for the CB against conversion of a corresponding amount of their existing
                loans
       –        Certain lenders under the TLB have undertaken to subscribe for 80% any unallocated amount for cash with a right to also subscribe for the remaining 20%
       –        PGS can require that bondholders convert the CB into shares if the PGS share price exceeds NOK 6 for 30 consecutive trading days

 Other
       –        Fees to lenders of up to ~$7.6 million payable in cash and up to ~$9.9 million payable in kind (excludes costs for legal and financial advisors for PGS and the lender
                groups)
       –        Strengthening of security package

(1)   $135 million maturing September 2020 and $215 maturing September 2023
(2)   Subject to any increases in principal due to payment-in-kind fees and any reduction in principal due to lenders electing to exchange part of their existing debt into new convertible bonds

                                                                                                                                                                                                    17
Agreements to Reschedule Debt
  PGS Pro Forma Debt Repayment Profile

                                           Current amortization profile                                                               Pro forma amortization profile (1)
 USD millions                                                                                               USD millions

    600                                                                                                        600

                                                                                                                                                                      47
    500                                                                                                        500
                                                                                47

    400                                                                                                        400

    300                                                                                                        300                                           138

                                                                         47
                                                                                                                                                                     499
                                                                         26     439
    200                                                                                                        200

                 24                                                                                                                             28
                  3
                                                                                                                                                             237
    100                                                                 215                                    100
                                                                 215
                135                                                                                                                             135
                               47
                                             24            24                           42                                                                                   42
                               26            13            13                                  26     18                                                                            26     18
       0                                                                                                         0
              2H 20          2021         1H 22          2H 22         2023    2024    2025   2026   2027              2H 20   2021    1H 22   2H 22         2023    2024   2025   2026   2027

                                             2020 RCF            2023 RCF      TLB    ECF                                                              TLB     ECF

   Quarterly excess liquidity sweep above USD 200 million to TLB and ECFs until USD 135 million first amortization for TLB and deferred
    amortizations for ECFs are repaid in full
   Thereafter, TLB to benefit from a quarterly excess liquidity sweep above USD 175 million, which will replace the current excess cash flow sweep
Notes:
1. Prior to PIK fees and convertible notes issued as part of additional fees                                                                                                                     18
Agreements to Reschedule Debt
Selected Financial Model Numbers Provided to Lenders(1)
                                          2019A                  2020E                 2021E                 2022E                  2023E                  2024E

    Segment revenue growth                  5.5%               (28 - 34)%              0 – 10%              20 – 25%               15 – 20%             Similar to 2019
                                                                                                                                                                            To facilitate discussions with lenders PGS has shared
                                                                                                                                                                             certain financial modelling numbers with members of
                                                                                                                                                                             the Ad Hoc Committee of TLB lenders
         Avg. number of
                                              8                6.00 – 6.50           4.75 – 5.75           5.75 – 6.75             6.75 – 7.75               7–8
         active vessels

                                                                                                                                                                            Pursuant to agreed cleansing mechanisms, PGS shall
            Utilization                     82%                ~70 – 75%                                                  ~85%                                               publicly disclose these financial model numbers

                                                                                                                                                                            The financial model numbers are disclosed to satisfy
          Active vessel
        time allocation to                 50/50%               ~35/65%                                                  ~50/50%
         contract vs. MC
                                                                                                                                                                             public disclosure obligations in respect of material non-
                                                                                                                                                                             public information that has been shared with the Ad Hoc
         EBITDA margin                      63%                 65 – 68%              61 – 63%              63 – 65%               65 – 67%                65 – 67%          Committee as part of the discussions

          MC investment                  ($245 MM)            ~($225 MM)          ($150 – 175 MM)        ($180 – 210 MM)       ($220 – 250 MM)       ($230 – 260 MM)        The financial model numbers disclosed are used by the
                                                                                                                                                                             Company’s management internally, based on current
    Net cash used in investing
                                                                                                                                                                             expectations about future events, and are subject to
     activities, excluding MC             ($8 MM)              ~($35 MM)            ($50 – 60 MM)         ($60 – 80 MM)          ($80 – 105 MM)         ($90 – 105 MM)       risks and uncertainties which relate to factors that are
           investment (2)
                                                                                                                                                                             beyond management’s ability to control or estimate
                                                                                   Working capital
                                                                                                                                                                             precisely and that could cause actual results to differ
           Change in
        working capital (3)
                                         ($45 MM)              ($0-20 MM)        release of $50 – 80
                                                                                                     Working capital to build as revenues grow broadly in line with
                                                                                                              2019 normalised net working capital levels
                                                                                                                                                                             materially from those expressed therein
                                                                                         MM

   Payment of severance and
                                                               ~($30 MM)              ~($5 MM)                            Not expected to be material
    other restructuring cost

Notes:
1. No payments relating to debt, leases or taxation are included in the above financial model numbers
2. Includes net investment in property and equipment, intangible assets and other investing cash flow such as asset sales and change of long term restricted cash
3. Includes change of accounts receivables, accrued revenues and other receivables, deferred revenues, accounts payable, as well as other current and long-term items relating to operating activities. The amount excludes provision for and payment of severance and other restructuring
   cost. The drop in business activities in 2020 followed by stabilisation from 2021 is expected to result in a reduction of both receivables and payables, but the effect on the receivable side is delayed due a combination of factors including (i) an agreement with a customer to pay
   approximately $30m in January for the pre-funding license on a survey acquired in Q1-Q2 2020 and (ii) the forecasted seasonal distribution of revenues in 2020 (which is more back-ended than the average). This results in a more moderate release of receivables in 2020 than we would
   otherwise expect. We expect that the seasonal distribution will return to historical levels from 2021
                                                                                                                                                                                                                                                                                              19
Operational Update &
                   Market Comments
                   Unaudited Third Quarter 2020 Results

October 22, 2020
Fleet Activity October 2020

                                                       Ramform Tethys
                                                       (Steaming to next job)

                                                                                      Ramform Hyperion
                              Ramform Titan                                                     (Egypt)
                              (Steaming to next job)

                                                                    Ramform Atlas
                                                                           (Angola)

                                                                                Ramform Sovereign
                                                                                 (South Africa – Standby)

                                                                                                            -21-
Integrated Service Offering Drives MultiClient Activity in 2H 2020
                                               The Ramform Hyperion mobilized for a MultiClient
                                                Campaign offshore Egypt early in Q3

                                               The program primarily covers held acreage
                                                awarded in recent license round
                                                 –   Acquisition commenced shortly after block
                                                     ratification providing significant timing advantage

                                               Integrated service offering makes PGS agnostic
                                                to the MultiClient or Contract business model
                                                 –   Playing across both models delivers the best
                                                     commercial value for the client and PGS

                                               The Ramform Tethys will commence acquisition
                                                imminently expanding the MultiClient campaign

                                               Expect to have two vessels in Egypt into Q1 2021

                                                                                                           22
Encouraging 2021 Contract Leads Volume
              2500

              2000

                                                                                                                                    Bids and leads withdrawn from the
              1500
                                                                                                                                     market in Q1/Q2 re-emerging for
USD million

                                                                                                                                     execution in 2021
              1000

                                                                                                                                    Q4 2020 contract activity expected to be
               500
                                                                                                                                     low

                 0

                     Active Tenders Marine Contract         All Sales Leads Marine Contract (Including Active Tenders)

                                        PGS In-house Contract Bids+Leads
                 Contract bids to go (in-house PGS) and estimated $ value of bids + risk weighted leads as of end September 2020
                                                                                                                                                                                23
Lowest 3D Streamer Supply Since Mid 1990s
 Number of
 streamers
   600
                                                                                             Average 2020 capacity is ~20% lower
                                                                                              vs. average 2019
   500

   400
                                                                                             Deteriorating utilization vs. 2019 levels

   300
                                                                                             Expect below 15 vessels in operation
                                                                                              during winter season
   200
                                                                                               – Expect moderate capacity increase for
                                                                                                 2021 summer season
   100

     0
         Q1 13            Q1 14     Q1 15   Q1 16   Q1 17   Q1 18   Q1 19   Q1 20   Q1 21

   Source: PGS internal estimates

                                                                                                                                          24
Summary

           Seismic market remained challenging in Q3

           Realizing substantial cost reductions already
            in Q3
             – New organization fully operational

           Signing binding agreements with majority of
            lenders to defer debt maturities and
            amortization by ~2 years

           Expect higher revenues from vessel operation
            and MultiClient sales going forward

                                                            25
Thank You - Questions

October 22, 2020
Appendix
  Main Yard Stays* Next Six Months

                                     Vessel    When      Expected   Type of Yard
                                                         Duration   Stay

                                     Ramform   Q1 2021   19 days    7.5 year docking
                                     Atlas

*Subject to changes                                                                    -27-
Summary Terms of the Transaction (1)

    Heading                                                       ECF                                                                                         TLB (including former 2020 RCF and former 2023 RCF)
                          Deferral of quarterly amortization starting from Sep-20                                   The $135m RCF due 2020, the $215m RCF due 2023 and the c.$2m TLB due 2021 will each be converted into
                           until and including Sep-22 (total of $106m) with regular                                   a new TLB on the same terms as the c.$520m 2024 TLB with the post transaction total debt under these credit
                           quarterly amortizations to resume from Dec-22                                              facilities of c.$872m (subject to any increases in principal due to PIK (payment-in-kind) fees and any reduction
                                                                                                                      in principal depending on lenders’ decision to exchange part of their existing debt into new convertible bonds, in
                            – Deferred amounts to be repaid on earlier of (i)                                         relation to which see further below) maturing in March 2024 with the following amortization profile payable pro-
                              refinancing of $200m TLB amortization payment and                                       rata to all TLB lenders:
  Repayment                   (ii) four quarterly payments from Dec-22 to Sep-23
   schedule                                                                                                             - c.$135m amortization payment due in September 2022
 amendments
                                                                                                                        - $200m amortization payment due in September 2023

                                                                                                                        - c.$9m quarterly amortization starting March 2023

                                                                                                                     Quarterly amortization payments of up to 5% per year of original principal amount of the ~$520m 2024 TLB due
                                                                                                                      until December 2022 will be deferred and replaced by the new amortization schedule described above

                          ECF to benefit from share of excess liquidity sweep                                       Current excess cash flow sweep to be replaced by excess liquidity sweep
                           together with TLB Lenders (see under TLB)
                                                                                                                     From first quarter-end post-closing to full repayment of deferred amounts for ECFs and the first c.$135m TLB
                                                                                                                      amortization, quarterly excess liquidity sweep of any amount above $200m liquidity to be used to repay TLB
      Excess                                                                                                          and ECF deferred amounts (to be allocated pro rata based on outstanding amount at the time of (i) c.$135m
     liquidity                                                                                                        TLB amortization due Sep-22 and (ii) accumulated deferred amortizations for ECFs)
      sweep
                                                                                                                     Following full repayment of deferred amounts for ECFs / c.$135m TLB amortization, quarterly excess liquidity
                                                                                                                      sweep of any amount above $175m liquidity for repayment of TLB only

                                                                                                                     All liquidity sweep applied against amortizations in a chronological order

Notes:
1. Only main economic terms shown
2. Subject to principal reduction of up to c.$13m depending on lenders’ decision to exchange part of existing debt into new convertible bonds and increase as a result of the PIK fees
                                                                                                                                                                                                                                           28
Summary Terms of the Transaction (1)
     Heading                                                     ECF                                                                                        TLB (including former 2020 RCF and former 2023 RCF)
                          Unchanged                                                                               2021 TLB / 2020 RCF / 2023 RCF margins amended to equal current 2024 TLB terms (see below)
                          Accrued default interest waived                                                         Accrued default interest waived

                                                                                                                                                                         Applicable Margin for Term Loans(2)

                                                                                                                        Total Gross Leverage Ratio                                           ABR Loans                                 Term Loan LIBOR Rate Loans
     Interest
                                                                                                                                        ≤ 1.25x                                                  5.00%                                                  6.00%
                                                                                                                                       > 1.25x,
                                                                                                                                                                                                 5.50%                                                  6.50%
                                                                                                                                       ≤ 1.75x
                                                                                                                                        > 1.75x                                                  6.00%                                                  7.00%

                          Further strengthening of current security package through, among other things, new intermediate holding companies share pledges and enhanced asset security
     Security

                          Financial covenants to apply to both TLB and ECF (the latter until repayment of the deferred amortization amount)
                          $75m minimum liquidity covenant (at all times, reported quarterly)
    Financial
   Covenants              Quarterly net leverage covenant re-profiled as follows: i. 4.50x until 30-Jun-21 (inclusive), ii. 4.25x until 31-Dec-21 (inclusive), iii. 3.25x until 31-Dec-22 (inclusive), iv. 2.75x
                           thereafter
                          Financial covenant breach capable of cure through equity injection

Notes:
1. Only main economic terms shown
2. In addition, for so long as the corporate rating of the Norwegian Borrower is not at least B3 and B- from Moody’s and S&P, respectively (in each case with a stable outlook), the Applicable Margin with respect to the Term Loans shall be 6.50% for ABR Loans and 7.50% for LIBOR
   Loans (it being understood that the pricing grid above will not apply). For so long as the corporate rating of the Norwegian Borrower is at least B3 and B- from Moody’s and S&P, respectively (in each case with a stable outlook) but not at least B2 and B from Moody’s and S&P,
   respectively (in each case with a stable outlook), the Applicable Margin with respect to the Term Loans shall not be lower than 5.50% for ABR Loans and 6.50% for LIBOR Loans (it being understood that if Level I in the above chart would otherwise apply, Level II shall apply
   instead). Each change in the Applicable Margin pursuant to the foregoing sentence with respect to the Term Loans shall be effective on and after the first Business Day following a public announcement by Moody’s and/or S&P of a change in the corporate rating of the Norwegian
   Borrower that would give rise to any required change in the Applicable Margin with respect to the Term Loans. Notwithstanding the foregoing, for so long as the Norwegian Borrower is unable to obtain ratings, then the Applicable Margin with respect to the Term Loans shall be
   6.50% for ABR Loans and 7.50% for LIBOR Loans

                                                                                                                                                                                                                                                                                         29
Summary Terms of the Transaction (1)

     Heading                                                     ECF                                                        TLB (including former 2020 RCF and former 2023 RCF)
                          25bps early bird fee lenders who sign Consent and                    25bps early bird fee payable at closing on all amounts locked-up at closing to lenders who sign Lock-up
                           Amendment Agreement by applicable early bird fee                      Agreement by applicable early bird fee deadline and comply with its undertakings to support the implementation
                           deadline                                                              of the transaction
 Early bird fee

                          71bps consent fee in cash                                            40bps consent fee including 15bps in cash and 25bps in PIK
  Consent fee

                                                                                                Aggregate $1.2m work fee to be shared amongst certain members of TLB ad hoc group
    Work fee

                                                                                                A choice of (i) 1% PIK fee, or (ii) 50bps PIK fee + a pro rata preferential right to subscribe with a portion of
                                                                                                 existing debt for a PGS convertible bonds (see next page)
   Additional
     Fees

Notes:
1. Only main economic terms shown. Lenders are advised to refer to the full legal term sheet

                                                                                                                                                                                                                    30
Convertible Bonds Summary Terms

         Heading                                                                              Terms

          Issuer             PGS ASA

  Aggregate nominal value    Up to NOK 116,162,097

         Maturity            3 year from issuance (at completion)

     Conversion price        Conversion price NOK 3 / share (i.e. aggregate up to maximum of 38,720,699 PGS ASA shares (10% of current outstanding shares))

    Conversion period        Any time until maturity, subject to customary notice periods

                             PGS to have option to force conversion of the Convertible Bonds should the PGS share price be at NOK 6 / share or higher for 30
        Issuer call
                              consecutive trading days

         Coupon              5% per annum, paid semi-annually

         Security            Unsecured

                             To the extent the CB is not fully subscribed, certain lenders under the TLB will (i) subscribe for 80% of the unallocated amount for cash
         Backstop
                              and (ii) have the right to subscribe for the remaining 20% of the unallocated amount for cash

                                                                                                                                                                          31
You can also read