INVESTOR PRESENTATION FOR FULL YEAR 2016 RESULTS - April 2017
←
→
Page content transcription
If your browser does not render page correctly, please read the page content below
INVESTOR PRESENTATION FOR FULL YEAR 2016 RESULTS

                     April 2017
Disclaimer
This document (the “Presentation’’) has been prepared for the sole purpose of the use at meetings with prospective investors to be held in
connection with the private placement of bonds by SIA ExpressCredit, which, together with its subsidiaries, is further referred to herein as the
“Company”.
This Presentation is of selective nature and is made to provide an introduction and overview of the Company’s business. Unless stated
otherwise, the information in this Presentation is provided from consolidated perspective, except for customer and loan issuance data which
excludes operations under MoneyMetro brand, launched in October 2016.
This Presentation does not purport to contain all the information that a prospective investor may require in evaluating the Company.
Participants to the meeting should read publicly available information regarding the Company as well as the full prospectus describing the
bonds issue (“the Prospectus’’). Prospective investors’ attention is drawn to the risk factors described in the section “Risk Factors’’ of the
Prospectus.
This Presentation contains forward-looking information that may involve risks and uncertainties concerning the Company’s growth and
profitability in the future. No reliance should be placed on any statements, estimates and projections regarding future performance or
developments, including, without limitation, in relation to expected market developments, estimated financial figures of the Company, or any
other forward-looking statements. Actual events or results may materially differ from those described in this Presentation. No one should
therefore unduly rely on these forward-looking statements as they reflect only the judgment of the Company’s management at the date of this
Presentation and are not intended to give any assurances or comfort as to future results. The facts and information contained in the
Presentation might be subject to revision in the future. Neither the delivery of this Presentation nor any further discussions of the Company with
any of the recipients shall, under any circumstances, create any implication that there has been no change in the affairs of the Company since
such date.
None of the Company or any of its parents or subsidiaries or any of their directors, officers, employees and advisors nor any other person (i)
accepts any obligation to update any information contained herein or to adjust it to future events or developments; (ii) makes any representation
or warranty, express or implied, as to the accuracy or completeness of the information contained in this Presentation; (iii) shall have any liability
whatsoever, in negligence or otherwise, for any loss howsoever arising, directly or indirectly, from the use of this Presentation.
This Presentation does not constitute an offer or an invitation for the sale or purchase of securities or assets in any jurisdiction, and neither this
document, nor anything contained herein, shall form the basis of, or be relied upon in connection with any contract or commitment whatsoever.
2
Who we are?
Originally established in 2009 2nd largest non-bank consumer
as a pawn broking chain lender in Latvia1
The leading consumer financial
services chain in Latvia
Loans
42% issued by 58%
value,
Pawn 2016
Consumer
loans loans
300,000+ 279 390,000+ 65%
Total unique registered Employees, Number of loans issued, Growth in net loans y-o-y,
customers 31.12.2016. 2016 2016A
2,200,000+ 91 EUR 32.8m EUR 2.8m
Total number of loans Branches, Value of loans issued, EBITDA, 2016A
issued 31.12.2016. 2016
1) Based on reported annual revenue of licenced non-bank consumer lenders in 2015
3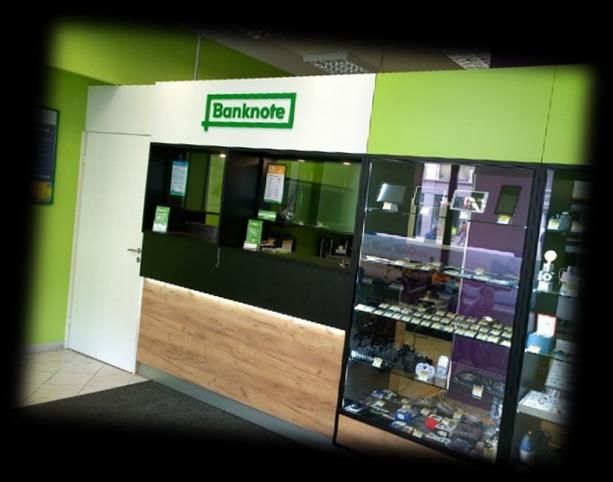
What we believe in?
Mission
Satisfy consumer needs for easily accessible financial services
Vision
To create a new market segment in Latvia, one-stop shop for all consumer financial needs
To be the unrivalled leader in this segment by providing excellent customer service and product
quality and maintaining perfect reputation
Values
Simplicity, Accessibility, Dignity
What is our story?
                                  10.0                    2011                            2015               2016
                                                          Payday                          Acquisition of     Launch of a
                                                          lending                         Riga City          new brand
                                                                                2013
 Loans issued per quarter, EURm

                                                          launched                        Pawnshop
                                   8.0                                          Secured
                                                                                bonds
                                         2009                        2012       issued
                                         First pawn                  Consumer
                                   6.0   shop                        lending
                                         opened                      launched

                                   4.0       2010                                              2015              2015
                                             50th pawn                                         Launch of a       Rebranding
                                             shop                                              new product
                                                         50
                                   2.0       opened

                                   0.0

•                         Impressive growth on the back of successful positioning, introduction of new products, and rebranding

                                                                                                                                  5
Our customers1
Business
related Other 18-19
60+
Lifestyle
No emergency funding available 8% 9% 1%
expenses 13% 20-29
27%
Households savings rate -2% in Latvia vs. 10% 9% Regular
Loan 50-59 16%
in the EU for 20152 usage
40% bills Age
34% 20% 24%
30-39
Key demand drivers
Unexpected 40-49
expenses
Low levels of income
50% of working population have gross monthly EUR 279 EUR 54
salary < EUR 700 Consumer loan, customer Pawn loan,
2016 average3 profile 2016 average4
Riga 32%
41% Female
Reduced availability of financial services in
Region Gender
the regions 59%
68%
Outside
Number of bank customer service locations in
Riga
Latvia down from 654 in 2007 to 265 now
Male
1) Data as at 31.12.2016. Customer profile based on active customers as at 31.12.2016., except for loan
usage which is based on survey results conducted in Banknote’s branches during 21.11.-25.11.2016.
Source: Eurostat, Central Statistical Bureau of 2) Gross saving divided by gross disposable income. Gross saving is the part of the gross disposable 6
Latvia, Latvian Association of Commercial Banks income not spent as final consumption expenditure
3) Average loan size per customer in the portfolio as at 31.12.2016
4) Average loan size per issue transaction in 2016
Our customers
306
Sizable and growing customer base 300 279
245
15.7% of total population in Latvia, growing at 240 210
'000
c.2,300 per month1 180 163
Growth driven by rebranding, use of new 120
113
marketing channels, and new product launch 33 39 44 48 47 52
60
0
Exceptional customer loyalty 2011 2012 2013 2014 2015 2016
Total registered unique customers Active customers
More than 80% of loans (by value) issued to
repeat customers 100%
Loyalty achieved by excellent customer
90% 84% 84% 83%
service and attractive product structuring
78%
80% 75%
70% 65%
Significant potential for cross-selling
60%
Only less than 25% of registered customers
have used both types of loans 50%
Potential for cross-selling money transfers and 2011 2012 2013 2014 2015 2016
loan products Share of loans issued to repeat customers by value
Source: Central Statistical Bureau of Latvia 7
1) As of 31.12.2016.
Regulation of our industry
Consumer loans Pawn loans
Regulatory framework rapidly evolving following industry Already well developed and stable regulatory framework,
growth, stabilised in 2016: effective since 2011:
Minimum capital requirements and strict licensing Minimum capital requirements and strict licensing
Cap on total effective loan costs Advanced security procedures at pawnshop premises
No advertising promoting irresponsible borrowing Stringent control procedures over pawn item origin
Adjustments to business strategy to Stringent internal procedures
successfully adopt to a regulatory already in place before required by
change the regulation
welcomes appropriate
Active cooperation with the regulation Acting as a responsible lender
regulator through industry implementing sustainable and
association transparent business practices
8Our market
2
Industry
Loan portfolio of 280 8 8
Consumer
Loan portfolio, EURm
Loan portfolio, EURm
Latvian non-bank loans 186 201 6
210 170 6
156 4
lenders 133 4 4
Fast-growing 140 4
n/a
segment 2
70 2
Banknote grows 0 0
even faster
EUR 201
3% market share1
241 487m,
2016 H1
8 7 7 7 3
7
Loan portfolio, EURm
6
Loan portfolio, EURm
7
38 Pawn loans 6
2 2 2 2 2 2
Stable segment 4
n/a
1
Consumer (incl. online) 1
Pawn Banknote is the 2
Mortgage leading player 0 0
Leasing, car title
26% market share1
Source: Consumer Rights Protection Centre
1) Based on loan portfolio as at the end of 2016 H1 9
2) Loan portfolio data based on SIA ExpressCredit standalone net consumer and pawn loan portfolio excl.
accrued interestOur product
1 Consumer loans1 2 Pawn loans
Share from loans
issued, 2016 58% 42%
Up to 95% of the pawn value
Loan size EUR 50-1,600
(jewellery, mobile phones, other electronics etc.)
Average loan size,
EUR 2792 EUR 543
2016
Up to 30 days (single payment loan) Up to 30 days (single payment loan)
Term
4-36 months (instalment loan) 2-24 months (instalment loan)
Weighted average
369 days 47 days
term, 31.12.2016.
Interest rate per
6.0%-11.8% 9.9%-28.0%
month
Application and signing in the branch,
Process Application and signing in the branch
online application possible
3 Money transfers with
1) Standard pricelist. Banknote has a special pricelist for seniors
2) Average loan size per customer in the portfolio as at 31.12.2016
10
3) Average loan size per issue transaction in 2016Operations: Process
Marketing Application Underwriting Funding Collection
Extensive branch Fast and effective Quick assessment Loan issued within Highly automated
network as application of creditworthiness 15 minutes after collection process
outdoor process on-spot in headquarters filling the at initial stages
advertising in the branch using state-of-the- application Strong collection
Data-driven Professional art scoring system Visual assessment rates in-house,
marketing advice to find the Quick pawn item of the customer transfer to
strategy on the best solution for valuation by serves as the final external collectors
back of internal the customer branch employee check only if not possible
CRM system Online application using tailor-made Agreement signed to reach the client
Targeted TV option available ERP system on-spot in the Well-developed
marketing branch procedures for
campaigns Money transferred profitable retail
to bank account or trade of foreclosed
disbursed in cash pawn items
(client preferences)
11Our product: Consumer loans
20 136 150
120 State-of-the-art scoring system, with 68%
15 97 rejection rate of applications from new
76 80 90 customers in 2016
EURm
000’
10
40 60
5 Outstanding payment discipline, with only
30 90+ 8.0% of loans issued over 2016 9M having
9
0.7 4.4 8.7 11.1 11.9 18.9 more than 90 days overdue payments1
0 0
2011 2012 2013 2014 2015 2016
Loans issued, EURm Number of loans issued
Strong in-house debt collection
competence, with more than 880,000
300 279 communication attempts made by
211
158 168 178 ExpressCredit in 2016
150 106
115 139 123 139
78 109 Price paid by external debt collectors
0
2011 2012 2013 2014 2015 2016 >0 exceeded net book value in all precedent
2 cession transactions
Average loan tranche size, EUR
Average loan size, EUR 3
1) Status as at 31.12.2016. of consumer loans issued in Jan 2016-Sep 2016 (by value of loans issued)
2) Average loan tranche size per issue transaction during the period
12
3) Average loan size per customer in the portfolio as at the end of the periodOur product: Pawn loans
20 325 335 360
313
274 Expertise in dealing with a wide range of
257
15
217
270 pawn items, with the pledge book consisting
of goods (55%) and jewelry (45%) as at the
EURm
end of 2016
000’
10 180
5 90 High pledge redemption rate, with 72% of
pawn items being redeemed or extended
7.7 10.6 12.2 13.8 14.9 13.9 within 3 months since issuance in 20161
0 0
2011 2012 2013 2014 2015 2016
Loans issued, EURm Number of loans issued
ExpressCredit’s policy is to sell inventory
54 within 2 months
60
48
39 41
45 36 37
Profitable retail trade of foreclosed pawn
30
2011 2012 2013 2014 2015 2016 % items, with average mark-up on goods of 52%
in 2016
Average loan size, EUR 2
1) By value of loans issued excl. item purchasing 13
2) Average loan size per issue transaction during the periodOperations: Organisation
279
Employees
3
Board
Operational 56 208 Headquarter 12
Operations
support operations
Unsecured 29 5 Operations 1 Finance & 8
loans & Debt Workshop
management Data analysis
collection
Security & 9 5 10 Marketing, proj. 4
Branch
Facilities Training, HR management &
management
management Admin
8 197
Branch
IT
employees
14Operations: Branch network
91 Largest branch network in Latvia
39
Branches in Latvia among financial service providers Cities and towns covered
by the branch network
6,635 m2 2
Riga 8
Ventspils
Total branch space 2 39 Branches merged with
Jurmala 2 Ogre other branch in 2016
6 Liepaja Jelgava 3
2
Jekabpils
Daugavpils
73 m2 4 91
Average branch space Branches profitable at
EBITDA level
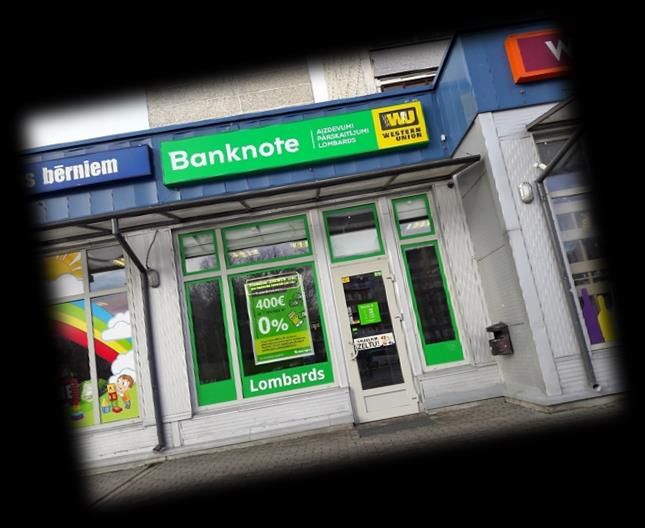
15Operations: Branch network
High-quality locations Appealing interior
Located in places with high Uniform branch layout
customer flow intensity
Pleasant and attractive
Easily visible and mostly interior, ensuring
based on the ground floor customer-friendly
with direct entrance environment
16Operations: Branch network
Effective knowledge transfer in the company
Approach to branch operations management
Standardized operations governed by internal
procedures
Rigorous ongoing employee training program Excellent Document
customer processing and
service funding
Branch
Established quality control system employee is
Organizing regular tests for branch employees a full-profile
and middle management financial expert
Controlling customer service quality
Professional Identification
valuation of of fraudulent
Strong employee motivation system pawn items cases
Competitive remuneration package with fixed
hourly rate and KPI-based variable component
Organisational culture relying on co-operation,
loyalty, and innovation
17Financial highlights1
Key financials, EURm 2014A 2015A2 2016A2 Financial ratios
Interest income 8.6 9.9 9.8
Gross profit from sale of foreclosed items 2.1 2.1 2.2 6.0x
4.0x
EBITDA 3.1 3.1 2.8 4.0x 3.2x 3.0x
Net profit 1.4 1.5 1.0 4.0x
Equity 2.1 2.3 2.8 2.0x
2.3x 2.3x
Net Debt 6.9 7.1 11.1 0.0x
Net loan portfolio 6.3 7.0 11.6 2014A 2015A 2016A
Total assets 11.0 10.7 16.0
Net Debt / EBITDA Net Debt / Equity
Strong growth following
rebranding and regulatory change
35% 40% 3.0x 2.5x
2.0 29% 2.3x
27%
24% 30% 1.9x
1.5 23%
EURm
18% 2.0x
1.0 20%
0.5 10% 1.0x
1.3 1.7 2.0 1.1 1.1 1.7 2014A 2015A 2016A
0.0 0%
2014 H1 2014 H2 2015 H1 2015 H2 2016 H1 2016 H2 Interest coverage ratio 4
EBITDA EBITDA margin3
1) Based on consolidated financial statements
2) Part of Interest income reclassified as Gross profit from sale of foreclosed items for comparability with
historic data
18
3) Calculated as EBITDA / (Interest income + Gross profit from sale of foreclosed items)
4) Calculated as EBIT / Interest expenseWhat we are proud of?
1 The leading consumer financial services chain in Latvia with a unique value proposition
The leading
market Rapidly gaining market share in the fast-growing consumer loan segment
position #1 player in pawn loans
2
Sizeable and 300,000+ unique registered clients, growing by c. 2,300 per month
recurring client Outstanding customer loyalty, with more than 80% of loans issued to repeat customers
base Significant potential for cross-selling
3
91 branches country-wide in high-quality locations
Excellent sales
Largest branch network in Latvia among financial service providers
platform
All branches are profitable at EBITDA level
4
Exceptional Rigorous employee training programs and effective quality control system
customer Customer-friendly branch environment, fast and effective application process
service Branch employees acting as full-profile financial experts
5
Continuous y-o-y increase in the amount of loans issued since the company’s foundation
Solid financial
Adjusted business strategy to successfully adopt to a regulatory change
performance
Stable EBITDA level at around EUR 3m
19Current financing structure
Liabilities 31.12.2016, EUR’000 Interest rate, % Maturity
Secured bonds 2,000 14.0% 11.2018
Unsecured bonds 3,250 15.0% 12.2020
Newly issued unsecured notes (up to EUR 5m) 982 14.0% 10.2021
Mimicking term structure
Peer-to-peer lending platform 4,227 11.0%-13.5%
of underlying loans
Private loans 1,748 12.9%-14.0% Up to 05.2018
Leases 165 3.5% + EURIBOR Up to 3 years
TOTAL 12,372
20Newly issued unsecured notes
Issue overview Covenants
Type Unsecured notes
1 No change of business areas (consumer lending, sale of
Issue size EUR 5,000,000 goods and debt collection)
Date of issue 7 October 2016 2 No loans to shareholders
Price Issued at par 3 Any borrowings from shareholders shall be unsecured and
Face value EUR 1,000, 5,000 securities payments made after Notes maturity date
Coupon 14% per annum, paid monthly 4 No transactions with related parties which are not arm’s length
Amortization Lump sum at maturity 5 No investment in minority shareholdings (below 51%)
Maturity 25 October 2021 6 Consolidated Net Debt / Equity less than 4.0x
Call option to repay principal prior to maturity 7 Loans to related parties less than EUR 1.4m
Call option of the on 25 October 2017, 2018, 2019, 2020 with
Issuer 1% premium, fully or partially (at least EUR 8 Payout ratio less than 40% of the last audited net profit
100 per one note with next step of EUR 100)
9 Dividends above 40% of net profit transferred for repayment of
Put option of the Note Put option to demand early repayment of the loans to related parties
holders principal on 25 October 2019
10 No new borrowings at a higher rate than the Coupon rate
Same priority of claims as for other unsecured
Collateral
creditors 11 No sale or lease of registered brand names
Registration Latvian Central Depository 12 No reorganization, liquidation or decrease in share capital
Use of funds Ordinary business operations
21APPENDICES
Financial statements1
Income statement, EUR’000          2014A     2015A2    2016A2      2015 H1 2016 H12 %, y-o-y                                  2015 H22 2016 H22 %, y-o-y
Interest and similar income         8,640     9,944     9,793            4,868               4,035           (17.1%)                5,076               5,758              13.4%
Gross profit from sale of goods3    2,106     2,114     2,181               956                 919            (3.8%)               1,158               1,262                   9.0%
Gross profit                       10,746    12,059    11,975            5,824               4,954           (14.9%)                6,235               7,020               12.6%
Selling expense                    (4,631)   (5,081)   (5,729)        (2,682)             (2,231)            (16.8%)              (2,399)             (3,498)              45.8%
Administrative expense             (1,883)   (2,738)   (2,006)        (1,071)             (1,039)              (2.9%)             (1,667)                (966)           (42.0%)
Net other operating expense        (1,170)   (1,125)   (1,445)             (52)              (547)           950.6%               (1,073)                (898)           (16.3%)
EBITDA                              3,062     3,114     2,795            2,019               1,137           (43.7%)                1,096               1,658               51.3%
Depreciation                        (249)     (245)     (195)            (121)               (118)             (3.2%)                (124)                 (78)          (37.4%)
Interest and similar expense       (1,216)   (1,162)   (1,396)           (599)               (601)                0.3%               (563)               (795)             41.3%
Taxes                               (195)     (194)     (243)            (286)                  (84)         (70.6%)                      91             (159) (274.1%)
NET PROFIT                          1,402     1,512       961            1,012                  335          (66.9%)                    500                 626             25.1%

                                                                 1) Based on consolidated financial statements
                                                                 2) Part of Interest income reclassified as Gross profit from sale of foreclosed items for comparability with    23
                                                                 historic data
                                                                 3) Sale of foreclosed items
Financial statements1
Balance sheet, EUR’000 2014A 2015A 2016A Cash flow statement, EUR’000 2014A 2015A 2016A
Fixed and intangible assets 394 644 582 EBITDA 3,062 3,114 2,795
Loans to related parties 1,504 981 1,386 Taxes (195) (194) (243)
Net loan portfolio 6,292 7,001 11,555 Interest payments (1,216) (1,162) (1,396)
Change in Net loan portfolio (1,392) (709) (4,554)
Inventory and scrap 1,345 1,138 701
Change in NWC 231 62 390
Other assets 228 476 489
Cash flow from operations 490 1,111 (3,009)
Cash 1,198 494 1,279
TOTAL ASSETS 10,961 10,734 15,992 CAPEX (193) (495) (133)
Change in Loans to related parties 951 523 (405)
Share capital and reserves 427 427 1,500 Cash flow from investing 758 27 (538)
Retained earnings 296 388 345
Change in interest-bearing debt 259 (533) 4,814
Profit/loss for the current year 1,402 1,512 961 Change in share capital 0 0 1,073
Equity 2,124 2,327 2,806 Dividends (1,100) (1,310) (1,555)
Interest-bearing debt 8,091 7,558 12,372 Cash flow from financing (841) (1,843) 4,332
Trade payables and other liabilities 746 850 815
TOTAL CASH FLOW 407 (704) 786
Liabilities 8,837 8,407 13,186
TOTAL EQUITY AND LIABILITIES 10,961 10,734 15,992
1) Based on consolidated financial statements
24You can also read