INVESTOR PRESENTATION 2019 - Full-Year Results March 05, 2020 - Rönesans Gayrimenkul
←
→
Page content transcription
If your browser does not render page correctly, please read the page content below
INVESTOR PRESENTATION
2019 - Full-Year Results
March 05, 2020

                           1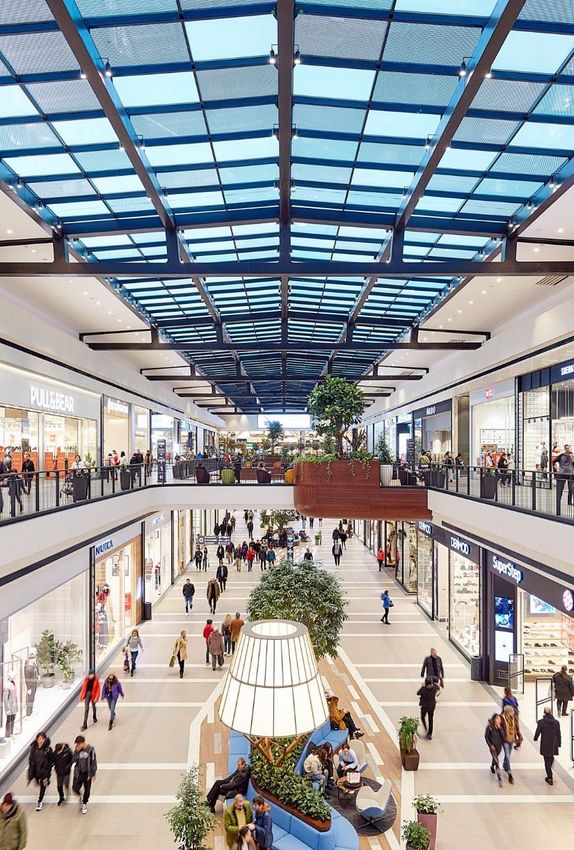
Disclaimer

This document was prepared by Rönesans Gayrimenkul Yatırım (“RGY” or “the Company”) solely for use of presenting the financial and operational results for financial
year of 2019, published on March 05, 2020. This document is not to be reproduced or distributed, in whole or in part, by any person other than the Company. The
Company takes no responsibility for the use of these materials by any person.

The information contained in this document has not been subject to independent verification and no representation, warranty or undertaking, express or implied, is
made as to, and no reliance may be placed on, the fairness, accuracy, completeness or correctness of the information or opinions contained herein.

Neither the Company nor its shareholders, its advisors, its representatives or any other person shall be held liable for any loss arising from any use of this document or
its contents or otherwise arising in connection with this document. In the event of any discrepancies between the information contained in this document and the public
documents, the latter shall prevail.

This document does not constitute an offer to sell or an invitation or solicitation of an offer to subscribe for or purchase any securities, and this shall not form the basis
for or be used for any such offer or invitation or other contract or engagement in any jurisdiction.

                                                                                                                                                                                 2
Business Highlights                             2019 Full-Year Results

  €2.4bn                               €1.3bn                              €106m                                €102m
      Portfolio                                                            Net Operating
                                          EPRA NAV                                                                   EBITDA
      Valuation                                                               Income

 765k m2                              96 mill.                             94.3%                                  1.5%
                                                                           Year-Average
 Gross Leasable                                                                                                Net Bad Debt
                                             Visitors                         Retail
      Area                                                                                                         Ratio
                                                                            Occupancy

                                                                                                                                          Küçükyalı Hilltown

Proportionate figures for the assets fully consolidated and the ownership at share of the assets accounted for using the equity method.
                                                                                                                                                               3
Business Highlights         2019 Full-Year Results

Strong business performance despite challenging market conditions: Net operating income of € 106m which is slightly under the
budgeted figure for 2019 (-1.8%) due to the lag in cancellation of temporary discounts for 3-6 months.

Major operating target in 2019 was keeping the occupancy high. Year-average retail occupancy stood at 94.3% (95.9% at the end
of Jan-20) which is both close to the long term trend and above 2019 budget of 93%.

Stabilization of inflation and increased consumer lending have boosted consumer activity in the second half of 2019. Tenants
recorded like-for-like growth of 18.9% during the year, outperforming the year-average inflation of 15.2%.

Karşıyaka Hilltown was successfully opened in 18th October 2019 with 97% occupancy and several prime brands such as Inditex,
H&M, Decathlon, Tommy Hilfiger, CGV, Victoria’s Secret, Vakko, Beymen, and CarrefourSA.

Leasing activity in office business has been quite high since the beginning of 2019. Total of 11,300 sqm of vacant are was leased
in Küçükyalı Hilltown and Mecidiyeköy RönesansBiz offices while expiring contract with Turkcell (36,611 sqm) in Küçükyalı
RönesansBiz was extended to 2025.

Şanlıurfa Piazza’s remaining 50% shares are acquired from AGP and the asset became a wholly owned subsidiary in Sep-19.

                                                                                                                                    4
Financial Highlights                            2019 Full-Year Results

           Strong business performance despite challenging market conditions and currency depreciation

                        107.1            105.9           Net Operating                                                                    Gross Asset           2,445   2,393
                                                               Income                                                                     Value         2,103
        63.6

                                                              € 106m                                                                       € 2.4bn

         2017            2018             2019                                                                                                          2017    2018    2019

                                                                                                           2020
                                                                                                           2019

                        102.2            102.4                        EBITDA                                                              EPRA NAV      1,475   1,390
                                                                                                                                                                        1,289

        62.4

                                                              € 102m                                                                       € 1.3bn

         2017            2018             2019                                                                                                          2017    2018    2019

Proportionate figures for the assets fully consolidated and the ownership at share of the assets accounted for using the equity method.
EPRA NAV is not adjusted for derivative assets and liabilities.
                                                                                                                                                                                5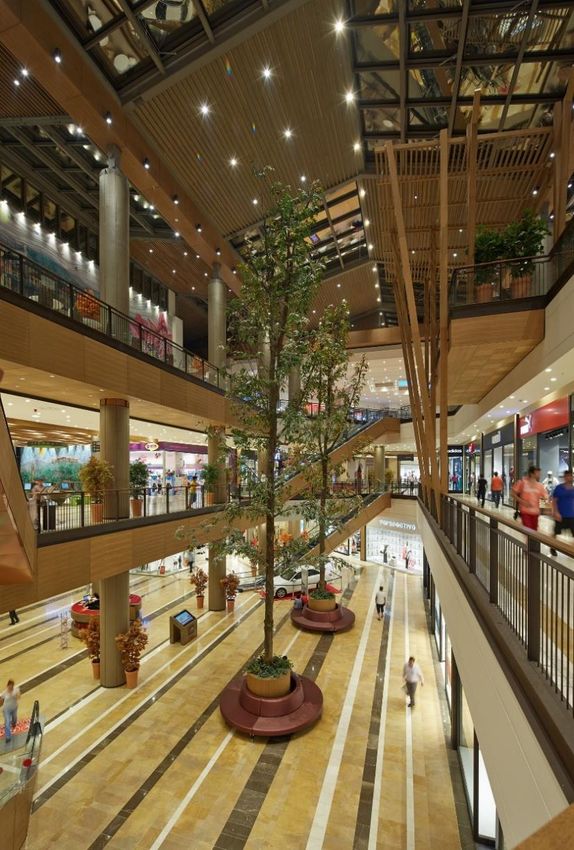
Financial Highlights                            Valuations

           Property valuation has declined by 6.3% on LFL basis while development exposure is reduced to zero.

     Property valuations has fallen by 2.2% in 2019                                                                                            Property Valuation (mEUR)
     where acquisition of 50% shares of Şanlıurfa                                                                                                   Dec-18 vs. Dec-19
     Piazza and capex for Karşıyaka Hilltown project                                                                                      39               62                    153
     partially offsetted like-for-like decrease of
     6.3%.                                                                                                                            1.6%                2.5%                   -6.3%

                                                                                                            2,445                                                                            2,393

     The major change in company profile in this
     period was that the latest development project,                                                      2018 GAV                Ş.Urfa Piazza     Karşıyaka Hilltown      LFL Valuation   2019 GAV
     Karşıyaka Hilltown, is successfully completed                                                                                 Acquisition           CAPEX                Decrease

     and now there is no development exposure in
     the portfolio.
                                                                                                                                           GAV by Status and Property Type
                                                                                                                                                        Dec 2019

                                                                                                                            Landbank                                             Retail
                                                                                                                               8%                                                 83%
                                                                                                                          Development
                                                                                                                              0%                                                 Office
                                                                                                                                                                                  8%
                                                                                                                          Yielding                                       Other
                                                                                                                            92%                                           1%

Proportionate figures for the assets fully consolidated and the ownership at share of the assets accounted for using the equity method.
                                                                                                                                                                                                       6
Future Outlook               Main Themes of 2020

       De-risking: Change of company profile from developer to operator

No New Development                                                                        No Bullet Payment
After several years of concurrent                                                There is not any bullet payment
development projects, this will                                                  or refinancing risk in 2020 apart
be the first year without any                                                      from € 50m of project finance
property under construction and          2020                             2020                 loan amortization.
with 14 yielding properties.

                                                           2020

Cleaner Balance Sheet                                                                            Deleveraging
Exposure to non-strategic JVs                                                     Since all development projects
has been reduced to zero after           2020                             2020            have started generating
acquisition of Şanlıurfa Piazza’s                                                  revenue, there is no need for
50% shares in 2019. Except for                                                    further indebtedness and RGY
3 JVs with GIC, all yielding                                                         will reduce its existing debt.
properties are now fully owned
by RGY and fully consolidated to
the financials.

                                                                                                                      7
Future Outlook                                  Operational Expectations for 2020

           Solid business performance is expected in 2020 with 14 yielding properties.

     2020 will be a milestone in RGY history since                                                                           Net Operating Income Projection for 2020 (mEUR)
     this will be the first time that 14 yielding
     properties will contribute to the income for the                                                                                                    1.7
                                                                                                                                                                              5.0
                                                                                                                                                                                             125.8
     entire year.                                                                                                                         13.2
                                                                                                                                                                            +4.8%
     Net operating income in 2020 is expected to be                                                         105.9
                                                                                                                                                        +1.6%

     c. EUR 126m with the incremental affect of                                                                                     +12.5%
     Şanlıurfa Piazza’s full consolidation and
     Karşıyaka Hilltown’s full-year operation as well
     as the cancellation of temporary discounts
     provided to the tenants.
     EBITDA expectation for 2020 is EUR 123m.
     Tenant sales at the shopping centers are
     expected to grow by 14.3% on a like-for-like
     basis while year average retail occupancy is
     budgeted as 96.3%.
     Average EUR/TRY expectation for 2020 is 6.85,
                                                                                                                              Karşıyaka Hilltown Acquisition of 50% of   Cancellation of
     equal to the average forward rate closed for                                                                                  Opening          Ş.Urfa Piazza      Temporary Discounts
     64% of EBITDA in 2020.                                                                                  NOI                    (Oct-19)           (Sep-19)                               NOI
                                                                                                            (2019)                                                                           (2020)

Proportionate figures for the assets fully consolidated and the ownership at share of the assets accounted for using the equity method.
                                                                                                                                                                                                      8
Shopping Centers          Occupancy

   Occupancy level remained close to long-term trend despite increasing number of tenants having difficulties.

Keeping stores occupied was the main business                                               Retail Occupancy
theme in 2019 for long-term and sustainable                                                    Period-Average
                                                                             96.9%                                                                  97.0%
performance.                                                 95.4%                          95.9%             95.8%              95.5%
                                                   95.0%                                                                                                         850
                                                                             96.9%          95.9%                                                   95.9%
                                                             95.4%                                            95.4%              94.3%
                                                   90.0%                                                                                                         650
Year-average occupancy at shopping centers         85.0%                                                                                             640         450
                                                                                                                                  594
was realized as 94.3%, that is not far from                   374            374             398
                                                                                                                530
                                                   80.0%                                                                                                         250
long term trend. Currently, it stands at 95.9%.               2015           2016            2017              2018               2019              Jan-20
                                                             Retail GLA (000sqm)        Occupancy inc Maltepe Park             Occupancy exc. Maltepe Park

Except Maltepe Park that is still under re-
tenanting to improve the mix, all shopping                                           Occupancy by Shopping Centers
centers have an occupancy above 90%.                                                            January 2020

                                                     99.6% 99.5% 98.9%
                                                                            97.2% 97.0% 95.9% 95.9%                                                          95.9%
                                                                                                    95.3% 94.9% 94.9% 93.9%

                                                                                                                                                    87.0%

                                                    Optimum Optimum Samsun Optimum Optimum Ş. Urfa   K. Maraş Karşıyaka Küçükyalı Maltepe   Kozzy   Maltepe Portfolio
                                                     Adana   Izmir   Piazza Istanbul Ankara Piazza    Piazza Hilltown Hilltown Piazza                Park

                                                                                                                                                                        9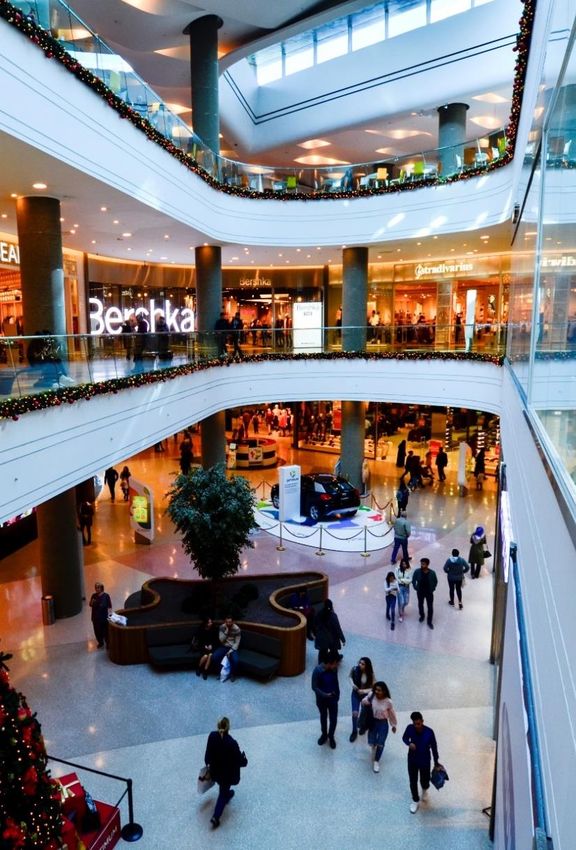
Shopping Centers                                Tenant Sales

           Growth in tenant sales have been outperforming annual inflation since 3Q19.

     Currency depreciation and increased inflation                                                                                                    Growth in Tenant Sales (1)
     had impeded consumer activity in 2018 and                                                                                                Like-for-like Malls - Year-over-Year Monthly
     1H19.                                                                                                                            24.2%
                                                                                                                                                                                        28.3% 28.7%             27.8%
                                                                                                    20.4% 19.7% 19.7% 19.5%                                                                           22.5%
                                                                                                                                              18.7% 16.7% 18.6% 19.4%

                                                                                                                       18.7%          18.7% 15.7%
     Along with stabilization of inflation and                                                                10.9%            9.5%
                                                                                                                                                  14.3% 15.0%
                                                                                                                                                                              9.3%      8.6%    10.6% 11.8% 12.2%
                                                                                                     5.4%
     increased consumer lending, tenant activity has                                                  Jan      Feb      Mar    Apr    May       Jun          Jul       Aug     Sep      Oct     Nov       Dec    Jan
     showed significant progress in the second half of                                                                                                2019                                                      2020
     the year. Tenant sales have been outperforming
                                                                                                                                            LFL Change               Annual Inflation
     annual inflation since August and the trend is
     expected to continue until at least next July.
                                                                                                                                         Growth in Tenant Sales (1)
                                                                                                                                            Like-for-like Malls - Annual
     For the entire year, tenants recorded like-for-like                                                                                                16.3%
                                                                                                                                                                                                  18.9%
     growth    of    18.9%       during   the     year,
                                                                                                                     11.1%
     outperforming the average inflation of 15.2%.                                                                                                                                                15.2%
                                                                                                                                                        12.9%
                                                                                                                     9.1%

                                                                                                                     2017                                2018                                     2019
                                                                                                                                  Average Inflation                LFL Change in Tenant Sales

(1) Only the malls that are operational at both T and T-12 are taken into account at each individual month.
                                                                                                                                                                                                                        10
Shopping Centers Occupancy Cost Ratio
Tenants’ affordability has restored to the long-term trend with temporary incentives and growth in sales.
Tenants’ affordability has improved to 13.2% Portfolio OCR (1)
as of Jan-20 after reaching historical high level Last 12 Months
in 2019. 15.6% 15.6% 15.5% 15.4%
15.2% 15.0%
14.8% 14.5%
14.2%
13.8% 13.5%
13.4% 13.2%
Conversion of contracts into Turkish Lira has
also reduced the indirect exposure of tenants to
currency risks due to the mismatch between
Jan Feb Mar Apr May Jun Jul Aug Sep Oct Nov Dec Jan
euro-linked leases and local-currency revenue.
2019 2020
Portfolio OCR (1)
Yearly
15.5%
13.4%
12.7%
2017 2018 2019
(1) Occupancy Cost Ratio = (Base rent + turnover rent + service charges [incl. management costs] + marketing contribution) / tenants’ sales in preceding 12 months
11Shopping Centers Footfall
Number of visitors have started to increase subsequent to economic recovery and increase in consumer lending.
Increased consumer confidence has showed Change in Footfall (1)
itself in the number of visitors. In the second Like-for-like Malls - Year-on-Year
half of 2020, more consumers have visited our 8%
6% 4%
shopping centers compared to previous year. 1% 1%
-1%
2%
-3% -1% -1%
-4% -4%
-10%
After decline in footfall for two years, we think
that we saw the bottom in 2019. Considering
Jan Feb Mar Apr May Jun Jul Aug Sep Oct Nov Dec Jan
the lack of new supply in the market and annual
population growth of Turkey by 1%, we might 2019 2020
see an increase in coming years.
Change in Footfall
Like-for-like Malls - Annual
-0.4%
-5.0%
-9.4%
2017 2018 2019
(1) Only the malls that are operational at both T and T-12 are taken into account at each individual month.
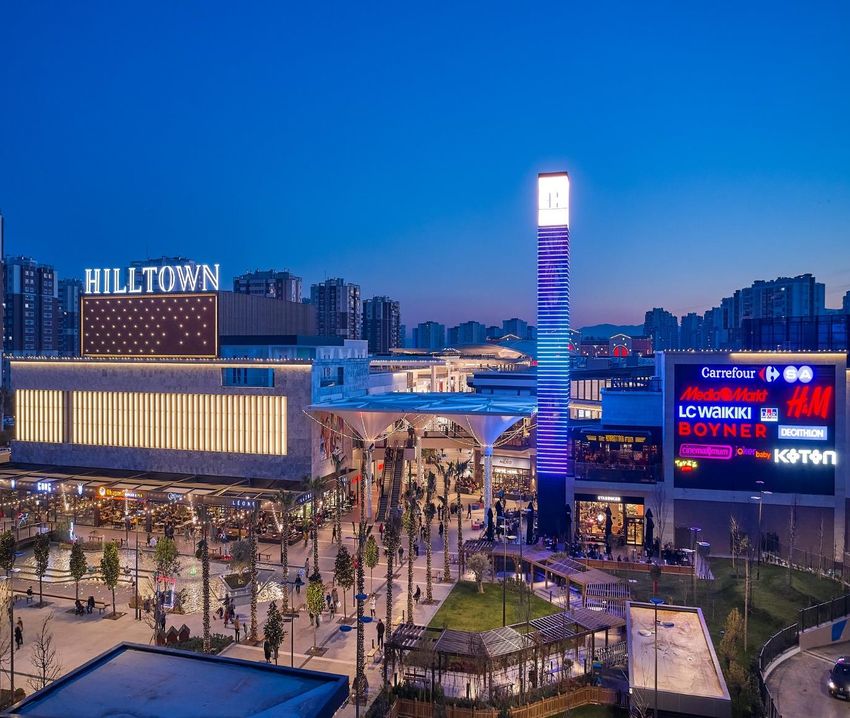
12Shopping Centers Karşıyaka Hilltown Opening
Karşıyaka Hilltown opened its door on 18th of October with 97% occupancy.
Karşıyaka Hilltown’s grand opening on October 2019
became the most unparalleled opening in recent years.
The hybrid project that is partly open partly and partly
closed air has already placed in top three in the portfolio
with regard to sales productivity.
After this opening, RGY now operates two of Izmir’s the
strongest shopping centers.
GLA Occupancy
63,000 sq 97% (1)
(1) Signed and agreed
13Shopping Centers Lease Profile
Long term rental contract profile is maintained with a WAULT of 6.7 years
The strategy to negotiate long term rental Lease Expiry Schedule by GLA
contracts provides a weighted average Retail - Dec 2019
unexpired lease term of 6.7 years. 55%
The share of contracts to be renewed in the WAULT is 6.7 years.
next 3 years hold only 20% of total portfolio.
17%
98% of the contracts include turnover rent 9%
7% 8%
clause, which enables RGY to capture a better 5%
margin from the overperforming tenants.
0 to 1 year 1 to 2 years 2 to 3 years 3 to 4 years 4 to 5 years 5+ years
Type of Contracts by GLA
Retail - Dec 2019
88%
2%
10%
Base Rent Base + Turnover Rent Turnover Rent
14Offices Occupancy
Vacant units in office buildings are being filled with local and global names
Occupancy in office buildings has risen to Office Occupancy
97.3% excluding Maltepe Piazza (34,266 sqm) 99.6% 99.0%
Period-end
97.3%
96.8% 94.8%
which is totally vacant. (70.7% including 100.0%
92.1%
Maltepe Piazza) 80.0% 99.6% 99.0% 96.8% 94.8%
220
60.0% 170
66.9% 70.7%
40.0% 120
20.0% 125 125 70
66 66 66 82
0.0% 20
2015 2016 2017 2018 2019 Feb-20
Office GLA (000sqm) Occupancy inc. Maltepe Piazza Occupancy exc. Maltepe Piazza
Occupancy by Offices (1)
February 2020
100.0% 100.0% 100.0% 97.3%
73.8% 70.7%
--
Küçükyalı Maltepe Park Mecidiyeköy Hilltown Office Piazza Office Portfolio Portfolio
RönesansBiz Office RönesansBiz excluding
Maltepe Piazza
(1) Including a new rental agreement (1,895 sqm – 20%) which has not been signed yet in Hilltown Office
15Offices New Leasings & Re-Leasings
Highly active office business with nearly 11,000 sqm (1) of new leasing and extension of Turkcell contract to 2025
RönesansBiz Mecidiyeköy Küçükyalı Hilltown Office Küçükyalı RönesansBiz
New Leasing New Leasing (2) Re-Leasing
4,299 sqm 6,984 sqm 36,611 sqm
Occupancy Occupancy (2) Occupancy
70% 100% 0% 74% 100%
(1) Since the beginning of 2019
(2) Including a new rental agreement (1,895 sqm – 20%) which has not been signed yet
16Financings Loan Maturity Profile
Discussions with local banks for the refinancing of loans maturing in 2020-2021 has been going on.
RGY has total financial debt of EUR 1,198m as Loan Maturity Profile (mEUR) (1)
of end of Feb-20. (Net: EUR 1,086m) Dec-19 – RGY's Share
Corporate Loans
Corporate Bonds
Since the beginning of 2020 where TL lending is Optimum Adana
abundant, we have been injecting TL loans to 10 years relationship
Samsun & Ş.Urfa
22 Project Finance Bullet Payments -
the company either via new utilization or with the same
project lenders Piazza
Other Assets
refinancing of existing corporate loans in hard Non-recourse loan 20% LTV at the Project Finance Bullet Payments -
currency. The interest rates of these new TL Prime quality asset maturity
GIC JVs
Project Finance Amortization
loans amounting EUR 37.5m vary between 9- with an occupancy Dominant assets in
12% while the term is 15 to 36 months. of 99.6% their cities
272
16
We are in talks with local banks for the 17
refinancing of upcoming bullet payments in 89
2021-2022 including Optimum Adana (May-21),
Samsun Piazza (Apr-22) and Şanlıurfa Piazza 54
(Sep-22). We focus on procuring long-term 110 162 90
project finance loans to refinance upcoming 6 91
bullet payments. In the second quarter of the 75
50 49
year, we expect to prepay at least one of them 34 31 38
with the excess cash. 2020 2021 2022 2023 2024 2024+
56 264 195 487 38 165
(1) Utilizations and repayments made after the end of December 2019 are included.
17Financings Liquidity & Hedge Position
We are piling up cash to both handle upcoming refinances and reduce our currency mismatch risk.
Both through unwinding of MtM position and RGY's Cash Position (mEUR)
new loan utilization, cash level has reached EUR Dec-19 vs. Feb-20
112m at the end of Feb-20. 23.2 4.0
31.3
We have opened forward positions for 2020
(EUR 79m at an average EUR/TRY rate of 6.85) 112.1
and 2021 (EUR 6m at an average EUR/TRY rate
53.6
of 7.26).
Subsequent the recent loan utilizations, TL loans Cash MtM Unwinding Net Change in Operations Cash
amount EUR 54m, which makes of 4.5% of (Dec-19) Corporate Loans (Feb-20)
total loan portfolio.
Including RGY and all SPVS, cash in hard Loan Breakdown Loan Breakdown FX Hedge Position
currency amounts EUR 106m which makes up 2018-12 2020-02 2020-02
Forwards
95% of total cash. TL Fx 6% Unhedged
- Liquidity Loans
All in all, our hedged position including liquidity TL
EUR 9% 80%
82.1
in hard currency, loans in TL and open forward USD 4.5% %
4.1% EUR
positions amounts EUR 234m where total loan 95.9
amount is EUR 1.2bn. Accordingly, 20% of total % USD
TL
13.4
loan is hedged from currency risk. % Loans
5%
18Financings Covenants
All covenants at both project finance loans and Eurobond are satisfied without any breach and sufficient headroom.
Combined LTV (1) Combined Coverage Ratio (1) Unencumbered Asset Value Ratio (1) (2)
2.29x
3.38x 2.11x
60%
2.83x
2.14x
44% 46%
1.20x
37%
1.50x
2017 2018 2019 2017 2018 2019 2018 2019
Combined Loan-to-Value Combined Coverage Ratio Unencumbered Asset Value Ratio
Eurobond Covenant Eurobond Covenant Eurobond Covenant
(1) Based on the methodology in Eurobond offering circular
(2) The ratio in 2017 is not taken into account due to lack of substantial amount of unsecured debt then.
19Sustainability BREEAM In-use Certificate
Five buildings under RGY ownership have been awarded with ‘Outstanding’ BREEAM In-use Certificate in 2019.
RGY has a goal to employ sustainable
management activities in its existing properties.
“To obtain BREEAM In-Use Part 2 Building
Management certificates (at Excellent or above)”
is set as business objective for all RGY’s existing
buildings.
Recently 5 buildings in RGY’s portfolio have been
awarded with ‘Outstanding’ BREEAM In-use
Certificate.
Pass
Good
Very Good
Excellent
Outstanding
20APPENDIX
Company Overview                            Shareholding Structure

                                                                                                 GIC
                                                Rönesans Emlak                                   21.44%
                                              Geliştirme Holding
                                                        74.24%                                   Government of Singapore Investment
                                                                                                 Corporation (GIC) is a global investment
                 Rönesans Holding is a shareholder of RGY,                                       management company established in 1981
                 via Rönesans Emlak Geliştirme Holding.                                          to manage Singapore's foreign reserves.

                 Rönesans Holding operates in the sectors                                        GIC is also 50% partner with RGY in three
                 of construction, real estate, energy and                                        joint ventures holding Optimum İstanbul,
                 PPP in healthcare.                                                              Optimum Ankara, and Optimum İzmir.

                 Flagship        operation,       Rönesans
                 Construction, is the world’s 33 largest
                                                 rd

                 international contracting company.                                           Other
                                                                                             4.32%

                                                                                   Management team   (1)

(1) Kamil Yanıkömeroğlu, Chairman of RGY and Murat Özgümüş, Vice Chairman of RGY
                                                                                                                                             22
Company Overview Rönesans Holding – Key Partnerships
Investor Since Scope Details
Member of the World Bank • USD 215m equity investment for 5.25% stake
International Finance Institution (IFI) that • c. USD 4bn pre-money valuation
2016 Rönesans Holding
focuses exclusively on the private sector in • Extensive financial, corporate, environmental and social
developing countries due diligence
Sovereign wealth fund established by the
Government of Singapore RGY • EUR 250m equity investment for 21.44% stake (4Q14)
2013 (Turkish real estate • Acquired 50% in 3 prime operational retail assets in
Worldwide investor of real estate across the platform) Turkey prior to platform transaction between 2013 - 2014
entire capital structure
• Partnered at development stage in Adana, Yozgat, Elazig
RSY
and Bursa Hospital PPP projects
(Turkish PPP
France based asset manager EUR6bn AuM 2013 • >4k beds to be built and operated under a 25-year
investment platform)
concession from the MoH
Hospital PPP projects
• Yozgat, Adana and Elazığ hospitals are in operation
• Partnered at development stage for the 2,682 bed
capacity Ikitelli Hospital to be built & operated under a
RSY
Japan based investment and trading company 2017 25-year concession from MoH
Hospital PPP project
• Financial close with JPY163bn (JPY200bn total capex) in
Jul’17
23Property Portfolio Yielding Properties
# Property Partner Location Opening Type Encumbrance GAV (m€) (1) GLA (sqm) Occupancy (2)
1 Karşıyaka Hilltown - Karşıyaka / İzmir October 2019 Retail Yes 252.7 63,000 95.3%
2 Maltepe Piazza - Maltepe / İstanbul April 2018 Retail / Office / Residence Yes 301.2 53,000 / 34,000 94.9% / -
3 Küçükyalı Hilltown - Maltepe / İstanbul October 2017 Retail / Office Yes 301.7 63,000 / 9,500 94.9% / 73.8%
4 Şanlıurfa Piazza - Eyyübiye / Şanlıurfa October 2013 Retail Yes 70.4 42,000 95.9%
5 Kahramanmaraş Piazza - Onikişubat / K.Maraş April 2013 Retail No 99.6 48,000 95.9%
6 Samsun Piazza - Canik / Samsun March 2013 Retail / Hotel Yes 205.0 62,000 98.9%
7 Optimum İzmir GIC (50%) Gaziemir / İzmir March 2012 Retail Yes 410.6 84,000 99.5%
8 Optimum Adana - Yüreğir / Adana April 2011 Retail Yes 189.7 60,000 99.6%
9 Kozzy - Kadıköy / İstanbul April 2010 Retail Yes 35.7 14,000 93.9%
10 Optimum İstanbul GIC (50%) Ataşehir / İstanbul November 2008 Retail Yes 236.4 41,000 97.2%
11 Maltepe Park - Maltepe / İstanbul January 2005 Retail / Office No 207.6 73,000 / 15,000 87.0% / 100%
12 Optimum Ankara GIC (50%) Etimesgut / Ankara October 2004 Retail Yes 179.2 38,000 97.0%
13 RönesansBiz Küçükyalı - Maltepe / İstanbul December 2014 Office / School No 93.8 52,000 100%
14 RönesansBiz Mecidiyeköy - Şişli / İstanbul March 2013 Office No 35.0 14,500 100.0%
(1) IFRS figures as of Dec-19
(2) As of Jan-20
24Property Portfolio Land Assets
# Property Partner Location Encumbrance GAV (m€) Area (sqm)
15 Antalya Beachtown Land - Konyaaltı / Antalya No 33.2 121,000
16 Konak Land Tekfen Group (50%) Konak / İzmir No 56.8 49,000
17 Mamak Land - Mamak / Ankara No 12.1 46,000
18 Silivri Land - Silivri / Istanbul No 5.6 42,000
19 Optimum Antalya Land - Muratpaşa / Antalya No 20.4 31,000
20 İzmit Land - Körfez / İzmit No 2.9 30,000
21 Bursa Land - Nilüfer / Bursa No 17.5 25,000
22 Bayraklı Land - Bayraklı / Izmir Yes 44.8 24,000
23 Ümraniye Land Doğan Group (50%) Ümraniye / Istanbul No 26.4 23,000
24 Antalya Land - Muratpaşa / Antalya No 3.4 13,000
25 Ayazağa Land - Sarıyer / Istanbul No 6.3 7,000
25Property Portfolio Karşıyaka Hilltown
Project Overview
Type Retail
Location Karşıyaka / İzmir
Opening October 2019
Partner -
DST (1) 850 m
GLA (sqm) 63,000
Occupancy 95.3%
GAV € 252.7m
Major Tenants
(1) Distance from station refers to distance to metro, light or high speed train
26Property Portfolio Maltepe Piazza
Project Overview
Type Retail & Office & Residence
Location Maltepe / İstanbul
Opening April 2018
Partner -
DST (1) Direct
GLA (sqm) 53,000 / 34,000
Occupancy 94.9% / 0% / 91.0% (2)
GAV € 301.2m (3)
Major Tenants
(1) Distance from station refers to distance to metro, light or high speed train
(2) Share of residences sold
(3) Residences are not included
27Property Portfolio Küçükyalı Hilltown
Project Overview
Type Retail & Office
Location Maltepe / İstanbul
Opening October 2017
Partner -
DST (1) 300 m
GLA (sqm) 63,000 / 9,500
Occupancy 94.9% / 73.8%
GAV € 301.7m
Major Tenants (2)
(1) Distance from station refers to distance to metro, light or high speed train
(2) Trelleborg, Tavuk Dünyası And Polisan are office tenants.
28Property Portfolio Şanlıurfa Piazza
Project Overview
Type Retail
Location Eyyübiye / Şanlıurfa
Opening October 2013
Partner -
DST (1) N/A (2)
GLA (sqm) 42,000
Occupancy 95.9%
GAV € 70.4m
Major Tenants
(1) Distance from station refers to distance to metro, light or high speed train
(2) No metro or light train line in the city
29Property Portfolio Kahramanmaraş Piazza
Project Overview
Type Retail
Location Onikişubat / K.Maraş
Opening April 2013
Partner -
DST (1) N/A (2)
GLA (sqm) 48,000
Occupancy 95.9%
GAV € 99.6m
Major Tenants
(1) Distance from station refers to distance to metro, light or high speed train
(2) No metro or light train line in the city
30Property Portfolio Samsun Piazza
Project Overview
Type Retail & Hotel
Location Canik / Samsun
Opening March 2013
Partner -
DST (1) 100 m
GLA (sqm) 62,000
Occupancy 98.9%
GAV € 205.0m
Major Tenants
(1) Distance from station refers to distance to metro, light or high speed train
31Property Portfolio Optimum İzmir
Project Overview
Type Retail
Location Gaziemir / İzmir
Opening March 2012 (2)
Partner GIC (50%)
DST (1) 50 m
GLA (sqm) 84,000
Occupancy 99.5%
GAV € 410.6m
Major Tenants
(1) Distance from station refers to distance to metro, light or high speed train
(2) Extension part was opened in March 2017.
32Property Portfolio Optimum Adana
Project Overview
Type Retail
Location Yüreğir / Adana
Opening April 2011
Partner -
DST (1) 350 m
GLA (sqm) 60,000
Occupancy 99.6%
GAV € 189.7m
Major Tenants
(1) Distance from station refers to distance to metro, light or high speed train
33Property Portfolio Kozzy
Project Overview
Type Retail
Location Kadıköy / İstanbul
Opening April 2010
Partner -
DST (1) 1,300 m
GLA (sqm) 14,000
Occupancy 93.9%
GAV € 35.7m
Major Tenants
(1) Distance from station refers to distance to metro, light or high speed train
34Property Portfolio Optimum İstanbul
Project Overview
Type Retail
Location Ataşehir / İstanbul
Opening November 2008
Partner GIC (50%)
DST (1) 650 m
GLA (sqm) 41,000
Occupancy 97.2%
GAV € 236.4m
Major Tenants
(1) Distance from station refers to distance to metro, light or high speed train
35Property Portfolio Maltepe Park
Project Overview
Type Retail / Office
Location Maltepe / İstanbul
Opening January 2005
Partner -
DST (1) 200 m
GLA (sqm) 73,000 / 15,000
Occupancy 87.0% / 100%
GAV € 207.6m
Major Tenants (2)
(1) Distance from station refers to distance to metro, light or high speed train
(2) CarrefourSA and TeknoSA are tenants on both retail and office parts.
36Property Portfolio Optimum Ankara
Project Overview
Type Retail
Location Etimesgut / İstanbul
Opening October 2004
Partner GIC (50%)
DST (1) 1,600 m
GLA (sqm) 38,000
Occupancy 97.0%
GAV € 179.2m
Major Tenants
(1) Distance from station refers to distance to metro, light or high speed train
37Property Portfolio RönesansBiz Küçükyalı
Project Overview
Type Office / School
Location Maltepe / İstanbul
Opening December 2014
Partner -
DST (1) 500 m
GLA (sqm) 52,000
Occupancy 100%
GAV € 95.2m
Major Tenants
(1) Distance from station refers to distance to metro, light or high speed train
38Property Portfolio RönesansBiz Mecidiyeköy
Project Overview
Type Office
Location Şişli / İstanbul
Opening March 2013
Partner -
DST (1) 900 m
GLA (sqm) 15,000
Occupancy 70.4% (2)
GAV € 36.2m
Major Tenants
(1) Distance from station refers to distance to metro, light or high speed train
(2) Occupancy is 80.7% including Conectys which has signed the rental contract after June 2019.
39Financial Highlights 2019 Full-Year Results
Consolidated (000 TRY) Combined (000 TRY) (1) Combined (000 EUR) (1)
2018 2019 2018 2019 2018 2019
Cash and cash equivalents 316,356 332,087 349,005 356,573 57,897 53,615
Trade & Other Receivables 89,027 99,618 160,720 113,637 26,662 17,087
Investments accounted for using the equity method 1,814,356 1,901,598 -- -- -- --
Investment Properties 11,686,567 12,891,842 14,736,605 15,916,157 2,444,692 2,393,191
VAT Receivable 395,312 427,730 408,785 439,694 67,814 66,113
Other Assets 322,108 376,295 560,173 728,182 92,929 109,491
Total Assets 14,623,726 16,029,170 16,215,288 17,554,243 2,689,995 2,639,498
-- --
Financial Borrowings 5,471,293 6,471,471 6,840,054 7,851,919 1,134,714 1,180,633
Trade & Other Payables 256,173 210,771 290,247 220,306 48,150 33,126
Deferred tax liabilities 1,035,356 1,098,866 1,478,814 1,573,993 245,324 236,669
Other Liabilities 895,569 1,131,387 640,839 791,351 106,310 118,989
Total Liabilities 7,658,391 8,912,495 9,249,954 10,437,569 1,534,498 1,569,418
Total Shareholders' Equity 57,897 53,615 57,897 53,615 57,897 53,615
Revenue 787,091 786,569 980,920 975,222 172,742 153,625
Cost of Sales (326,304) (239,687) (355,707) (268,091) (62,641) (42,232)
Gross Profit 460,787 546,882 625,213 707,131 110,101 111,393
Operating Expenses (35,954) (42,413) (44,822) (57,305) (7,893) (9,027)
EBITDA 424,833 504,469 580,391 649,826 102,208 102,366
NOI 444,017 516,986 608,442 672,013 107,148 105,861
(1) Proportionate figures for the assets fully consolidated and the ownership at share of the assets accounted for using the equity method.
40Financings Covenant Headroom Analysis
Combined Coverage Ratio Headroom Sensitivity to Combined LTV Headroom Sensitivity to Valuation Change
EUR/TL Change
60%
2.04x 2.00x 1.96x 1.92x 1.89x
1.75x 51%
46% 48%
42% 44%
6.55 6.70 6.85 7.00 7.15 7.77
Expected Rate 10% 5% Current -5% -10% -25%
Average EUR/TL in 2020 Change in Portfolio Value
41Financings Covenant Calculation
2019 TRY EUR
Related Footnotes in the Independent Auditor’s Report – December 2019
Total Current and Non-Current Financial Debt (1) 6,645,128 999,177
Less: Current Portion of Long Term Operational Lease (1) 3,778 568
(1) Note 29 (p.74)
Less: Long Term Obligation under Operational Lease (1)
169,466 25,481 (2) Share of RGY (50%) in joint ventures’ financial debts, Note 3 (p. 33)
(2)
Current Financial Debts of JVs 24,731 3,719
Non-Current Financial Debts of JVs (2)
1,355,644 203,838
(3) Second paragraph, Note 14 (p. 59)
Off Balance Sheet (3)
261,304 39,290 (4) “Combined” line, Note 4a (p.37)
Total Indebtedness 8,113,563 1,219,975
Total Assets (4) 17,554,243 2,639,498
(5) “Combined” line, Note 4e (p.41)
Combined LTV 46.2% 46.2% (6) “Combined” line, Note 4f (p.42)
Gross Profit (5) 697,131 109,846 (7) (2018 balance minus 2019 balance for companies named Bostancı, Mel2, Mel4, Bakırköy, Tarabya,
(6)
Operating Expense (47,305) (7,452)
Kuzguncuk, RGY) + (2019’s gross profit times 0.18 for companies named Salacak, Altunizade),
Combined Adjusted EBITDA 649,826 102,394
VAT Recovery (7) 42,415 6,681 Note 4d (p.40)
(8)
Interest Income 5,381 848
(9)
(8) “Combined” line, Note 4g (p.43)
Interest Expenses (328,177) (51,697)
Combined Interest Expense (328,177) (51,697) (9) “Combined” line, Note 4h (p.44)
Combined Coverage Ratio 2.14x 2.14x
(10) Note 29 (p.74) (Refers to unsecured Eurobond issued by RGY)
Short term portion of issued corporate bonds (10) 23,298 3,503 (11) Note 29g (p.75) (Refers to secured and unsecured corporate loans utilized by RGY)
(10)
Corporate bonds 1,782,060 267,955
Corporate Loans (11)
213,429 32,092
(12) Secured corporate loan utilized by RGY as per management reporting
Less: Secured Corporate Loans (12)
115,000 17,292 (13) Sum of assets of Balmumcu, Kabataş Rönesans, Nakkaştepe, Nisbetiye, Pendik, Mel3, Florya,
Combined Unsecured Indebtedness 1,903,787 286,258
Unencumbered Total Assets (13)
4,151,442 624,221
Bostancı, Bakırköy, Kavacık, Mecidiyeköy, Sancaktepe, Akatlar, Kandilli, Rönesans Gayrimenkul
Less: Encumbered Landplot Value (14)
135,570 20,385 Yatırım, Rönesans Yönetim and Other, Note 4a (p.25)
Combined Unencumbered Total Assets 4,015,872 603,836
Unencumbered Asset Value Ratio 2.11x 2.11x
(14) Optimum Antalya property value, Note 10b (p.55)
42Contact Details
Sercan Yüksel
CFO
sercan.yuksel@rgy.com.tr
Investor Relations
investor.relations@rgy.com.tr
Rönesans Gayrimenkul Yatırım A.Ş.
Küçükbakkalköy Mahallesi, Kayışdağı Caddesi No: 1, Ataşehir, İstanbul, 34750, Turkey
Phone: +90 312 430 6000
Fax: +90 312 430 6902
Portakal Çiçeği Sokak No:33 Y. Ayrancı, Çankaya, Ankara, 06540, Turkey
Phone: +90 312 840 1000
Fax: +90 312 442 5816
43You can also read