Frasers Hospitality Trust - 4Q FY2017 Financial Review for 1 Jul to 30 Sep 2017 27 Oct 2017
←
→
Page content transcription
If your browser does not render page correctly, please read the page content below
Frasers Hospitality Trust
4Q FY2017 Financial Review for 1 Jul to 30 Sep 2017
27 Oct 2017
Important Notice
Certain statements in this presentation constitute “forward-looking statements”, including forward-looking financial information. Such
forward-looking statements and financial information involve known and unknown risks, uncertainties and other factors which may cause
the actual results, performance or achievements of Frasers Hospitality Trust (“FHT”), Frasers Hospitality Asset Management Pte. Ltd. (as
the manager of Frasers Hospitality Real Estate Investment Trust) or Frasers Hospitality Trust Management Pte. Ltd. (as trustee-manager of
Frasers Hospitality Business Trust) (collectively, the “Managers”), or industry results, to be materially different from any future results,
performance or achievements expressed or implied by such forward-looking statements and financial information. Such forward-looking
statements and financial information are based on numerous assumptions regarding the Managers’ present and future business strategies
and the environment in which FHT or the Managers will operate in the future. Because these statements and financial information reflect
the Managers’ current views concerning future events, these statements and financial information necessarily involve risks, uncertainties
and assumptions. Actual future performance could differ materially from these forward-looking statements and financial information.
The Managers expressly disclaim any obligation or undertaking to release publicly any updates or revisions to any forward-looking
statement or financial information contained in this presentation to reflect any change in the Managers’ expectations with regard thereto or
any change in events, conditions or circumstances on which any such statement or information is based, subject to compliance with all
applicable laws and regulations and/or the rules of the Singapore Exchange Securities Trading Limited (“SGX-ST”) and/or any other
regulatory or supervisory body or agency. The value of stapled securities in FHT (“Stapled Securities”) and the income derived from them, if
any, may fall or rise. Stapled Securities are not obligations of, deposits in, or guaranteed by, the Managers or any of their affiliates. An
investment in Stapled Securities is subject to investment risks, including the possible loss of the principal amount invested. Investors
should note that they have no right to request the Managers to redeem their Stapled Securities while the Stapled Securities are listed. It is
intended that holders of Stapled Securities may only deal in their Stapled Securities through trading on the SGX-ST. Listing of the Stapled
Securities on the SGX-ST does not guarantee a liquid market for the Stapled Securities.
This presentation is for information only and does not constitute an invitation or offer to acquire, purchase or subscribe for the Stapled
Securities. The past performance of FHT and the Managers is not necessarily indicative of the future performance of FHT and the
Managers.
This presentation includes market and industry data and forecast that have been obtained from internal survey, reports and studies, where
appropriate, as well as market research, publicly available information and industry publications. Industry publications, surveys and
forecasts generally state that the information they contain has been obtained from sources believed to be reliable, but there can be no
assurance as to the accuracy or completeness of such included information. While the Managers have taken reasonable steps to ensure
that the information is extracted accurately and in its proper context, the Managers have not independently verified any of the data from
third party sources or ascertained the underlying economic assumptions relied upon therein.
Any discrepancies in the figures included herein between the listed amounts and total thereof are due to rounding.

                                                                                                                                                2
Content
Key Highlights
Portfolio Performance
Portfolio Growth
Risk and Capital Management
Outlook
3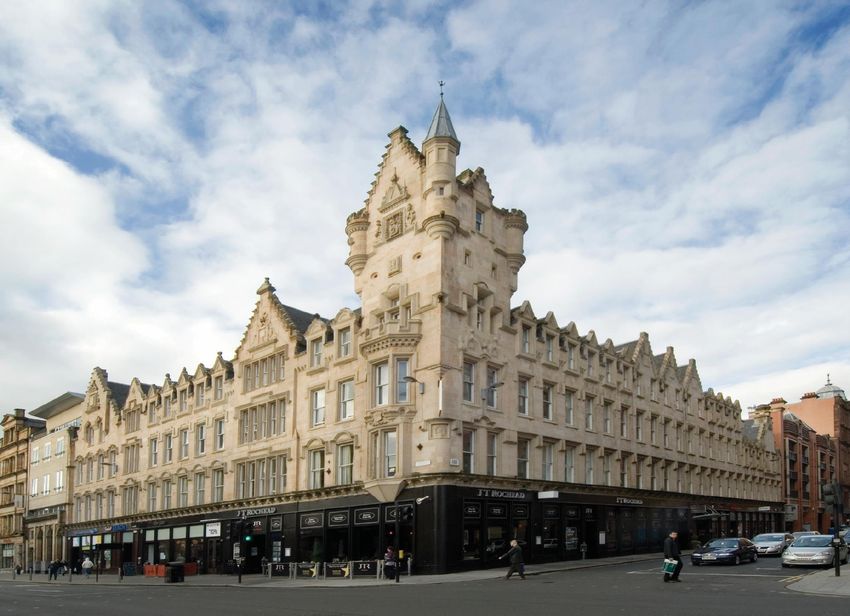
Key Highlights

                 Fraser Suites Glasgow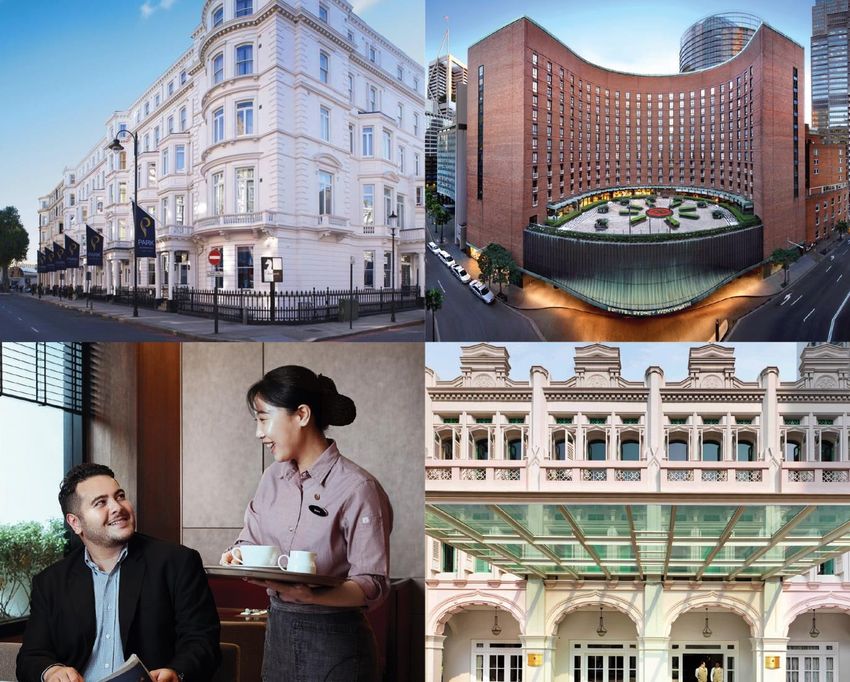
Financial Review for 4Q FY2017
    S$m                              4Q FY2017             4Q FY2016             Variance

    Gross Revenue (GR)                   41.6                 33.5                   24.2%

    Net Property Income (NPI)            31.5                 28.6                   9.8%

    Distribution Income (DI)             23.8                 21.9                   8.5%

    Distribution Per Stapled
                                     1.2763 cents         1.1903 cents               7.2%
    Security (DPS)

•    GR, NPI and DI were boosted by the addition of Novotel Melbourne on Collins. All country
     portfolios, except Singapore and Japan, also reported better yoy performance.
•    Consequently, DPS improved 7.2% yoy to 1.2763 cents.

                                                                                                5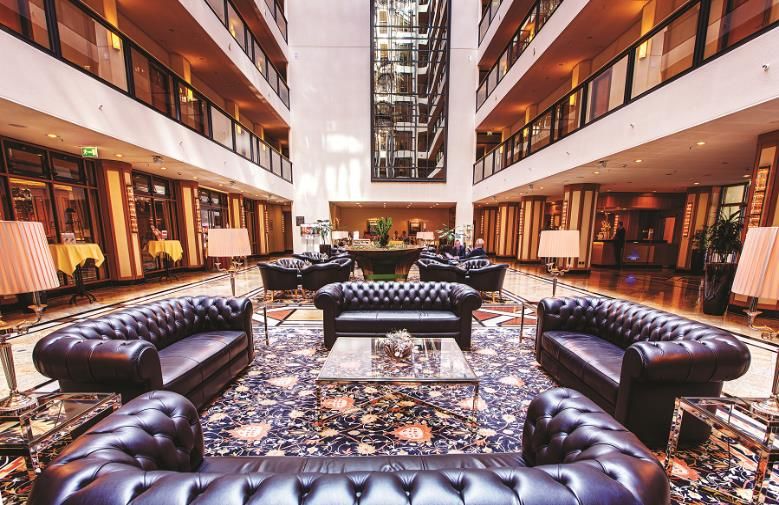
Financial Review for FY2017

    S$m                                             FY2017                        FY2016       Variance

    GR                                                158.7                            123.6     28.4%

    NPI                                               120.2                            104.2     15.3%

    DI                                                 93.5                            84.9      10.0%

    DPS                                          5.0458 cents                  5.2299 cents      3.5%

•    GR, NPI and DI were mainly boosted by the addition of Novotel Melbourne on Collins and
     Maritim Hotel Dresden as well as better overall portfolio performance.
•    Due to the enlarged stapled security base post-rights issue1, DPS was 3.5% lower at 5.0458
     cents.

1    FHT issued 441,549,281 Rights Stapled Securities at $0.603 each on 14 Oct 2016.

                                                                                                          6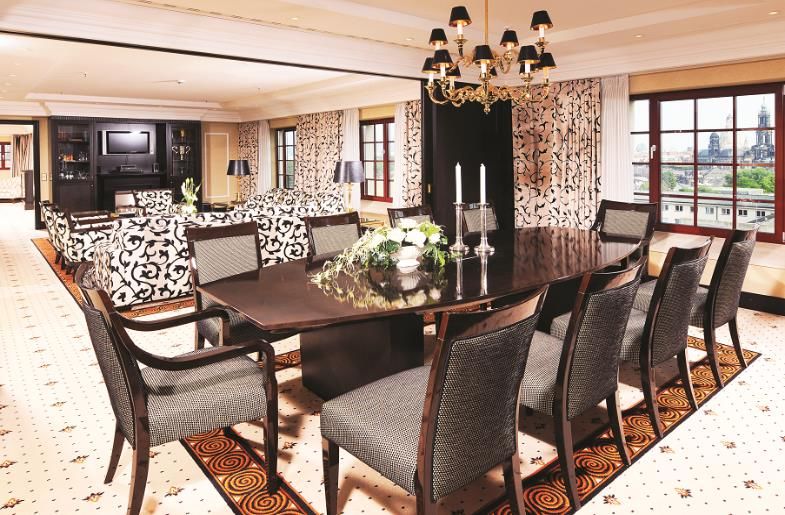
Distribution Details

Distribution Period                     1 Apr 2017 to 30 Sep 2017

Distribution Rate                    2.5137 cents per Stapled Security

Last Day of Trading on “Cum” Basis              1 Nov 2017

First Day of Trading on “Ex” Basis              2 Nov 2017

Book Closure Date                               6 Nov 2017

Distribution Payment Date                      29 Dec 2017
Portfolio Performance

                        Sofitel Sydney Wentworth
Portfolio Contribution by Country – 4Q FY2017

              Germany                               Germany
                4%                                    6%
          Malaysia
                                               Malaysia
    Japan   6%
                                                 7%
      8%                              Japan
                                       9%
                                                                      Australia
                GR      Australia                      NPI              38%
  United                  44%
 Kingdom      S$41.6m                                S$31.5m
   18%                                United
                                     Kingdom
                                       18%

           Singapore                                      Singapore
              20%                                            22%

                                                                                  9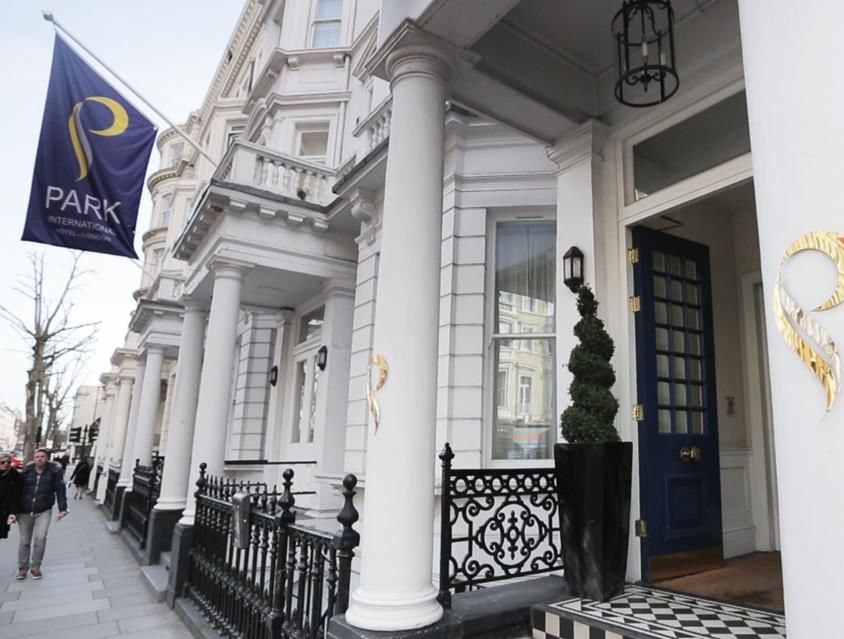
Portfolio Contribution by Country – FY2017

                 Germany                              Germany
                   4%                                   5%
             Malaysia                            Malaysia
               5%                                  6%
    Japan
     11%                                 Japan
                                          12%
                                                                Australia
                  GR       Australia                    NPI       41%
  United
 Kingdom       S$158.7m      46%                     S$120.2m
                                        United
   15%
                                       Kingdom
                                         15%

           Singapore
                                                    Singapore
              19%
                                                       21%

                                                                            10
Portfolio Highlights By Country – 4Q FY2017
4Q FY2017
Country Gross Operating Revenue (GOR) Gross Operating Profit (GOP)
Local Currency Variance Local Currency Variance
(m) (yoy) (m) (yoy)
Australia 31.4 39.6% 13.6 45.7%
Singapore 24.0 2.1% 9.2 2.0%
UK 7.3 4.8% 4.3 0.5%
Japan 1,465.7 3.9% 360.7 7.7%
Malaysia 26.1 13.8% 9.2 23.8%
Germany1 2.9 4.4 % 1.3 6.8%
1 Refers to Maritim Hotel Dresden which was acquired on 15 Jun 2016
11Portfolio Highlights By Country – FY2017
FY2017
Country GOR GOP
Local Currency Variance Local Currency Variance
(m) (yoy) (m) (yoy)
Australia 128.6 40.5% 58.3 50.1%
Singapore 88.6 0.9% 35.0 -
UK 24.9 4.8% 13.7 0.9%
Japan 6,311.6 1.9% 1,731.3 1.4%
Malaysia 96.4 6.3% 32.6 12.5%
Germany1 10.4 n.m. 4.3 n.m.
1 Refers to Maritim Hotel Dresden which was acquired on 15 Jun 2016
12Australia Portfolio Performance AUD (m) 4Q FY2017 4Q FY2016 Variance
GOR 31.4 22.5 39.6%
GOP 13.6 9.3 45.7%
❖ Novotel Melbourne on Collins (NMOC) ❖ Novotel Rockford Darling Harbour (NRDH)
❖ Fraser Suites Sydney (FSS) ❖ Sofitel Sydney Wentworth (SSW)
• NMOC contributed to the significant increase in GOR and GOP of Australia portfolio in 4Q FY2017.
• Ave RevPAR for the portfolio declined 4.9% yoy, mainly due to NRDH refurbishment hitting its peak
which in turn affected the overall portfolio occupancy.
• Sydney and Melbourne continued to enjoy a busy events calendar, with Sydney in particular
benefitting from the opening of the International Convention Centre. RevPAR for FHT’s Sydney (excl.
NRDH) and Melbourne properties increased by 3.6% and 4.0% respectively for the quarter.
ADR1 Ave RevPAR1
(AUD) Ave OCC1 (AUD)
230 223 92.7% 206
85.2% 196
4Q FY2017 4Q FY2016
1 ADR, Ave OCC and Ave RevPAR were calculated based on 4 properties in 4Q FY2017 and 3 properties in 4Q FY2016 as NMOC was
acquired on 20 Oct 2016
13Singapore Portfolio Performance SGD (m) 4Q FY2017 4Q FY2016 Variance
GOR 24.0 24.5 2.1%
GOP 9.2 9.4 2.0%
❖ Fraser Suites Singapore (FSSG)
❖ InterContinental Singapore (ICSG)
• GOR and GOP of the Singapore properties declined marginally in 4Q FY2017.
• ICSG achieved higher RevPAR on the back of occupancy gains which was offset by a decline in
banquet revenue.
• FSSG turned in lower GOR and GOP in this quarter due to continued downward pressure on ADR.
ADR Ave RevPAR
(SGD) Ave OCC (SGD)
307
300
88.1% 85.9% 263
264
4Q FY2017 4Q FY2016
14UK Portfolio Performance GBP (m) 4Q FY2017 4Q FY2016 Variance
GOR 7.3 6.9 4.8%
GOP 4.3 4.3 0.5%
❖ Fraser Suites Edinburgh (FSE) ❖ Fraser Place Canary Wharf (FPCW)
❖ Fraser Suites Glasgow (FSG) ❖ Best Western Cromwell London (BWCL)
❖ Fraser Suites Queens Gate (FSQG) ❖ Park International London (PIL)
• GOR and GOP of the UK portfolio increased 4.8% and 0.5% respectively yoy.
• Higher ADR and occupancy contributed to 6.4% growth in RevPAR.
• While the portfolio performance has improved, GOP growth remains under pressure due to higher
costs arising from the increase in minimum wage rates.
ADR Ave RevPAR
(GBP) Ave OCC (GBP)
127 124 92.1% 89.0%
116
110
4Q FY2017 4Q FY2016
15Japan Portfolio Performance JPY (m) 4Q FY2017 4Q FY2016 Variance
GOR 1,465.7 1,524.8 3.9%
GOP 360.7 390.6 7.7%
❖ ANA Crowne Plaza Kobe (CPK)
• CPK’s GOR and GOP declined by 3.9% and 7.7% respectively yoy due mainly to lower banquet
revenue from weddings. Room revenue was stable yoy.
• Apart from continuing to drive room revenue, CPK will also focus on increasing revenue from local and
international conferences and events.
ADR Ave RevPAR
(JPY) Ave OCC (JPY)
15,161 15,130 76.3% 76.6%
11,563 11,590
4Q FY2017 4Q FY2016
16Malaysia Portfolio Performance MYR (m) 4Q FY2017 4Q FY2016 Variance
GOR 26.1 22.9 13.8%
GOP 9.2 7.4 23.8%
❖ The Westin Kuala Lumpur (TWKL)
• The KL market continued its strong growth, with TWKL recording yoy RevPAR growth of 15.7%.
• Stronger transient and corporate demand contributed to the higher occupancy at TWKL while improved
consumer sentiment led to an increase in F&B outlet revenue.
• Banquet revenue of the hotel also improved, driven by an increase in corporate and social events.
ADR Ave RevPAR
(MYR) Ave OCC (MYR)
557 548 81.8% 456
394
71.9%
4Q FY2017 4Q FY2016
17Portfolio Growth
Maritim Hotel DresdenPortfolio Growth
▪ Portfolio grew 18.5% yoy due Increase/
Valuation Valuation Increase/
mainly to the addition of NMOC Decrease in
as at as at Decrease
Country Local
▪ Excluding NMOC, valuation of 30 Sep 2016 30 Sep 2017 in SGD
Currency
portfolio increased 5.5% yoy (S$m) (S$m) (%)
(%)
▪ Valuation of NMOC was 6.0% higher
than the purchase consideration Singapore 840.0 840.0 0.0% 0.0%
S$2.439b
Australia 482.31 842.7 74.7% 71.1%
S$2.058b
United
319.7 331.2 3.6% 0.7%
Kingdom
Japan 191.0 189.2 -1.0% 9.8%
Malaysia 135.2 138.2 2.2% 4.9%
Germany 90.2 98.2 8.8% 3.9%
At 30 Sep16 At 30 Sep17
Total 2,058.4 2,439.5 18.5% -
Singapore Australia
United Kingdom Japan Total
2,058.4 2,172.22 5.5%2
Malaysia Germany (same-store)
1 Valuation for the Australia properties in FY2016 excludes NMOC as its acquisition was completed in Oct 2016.
2 Same-store excludes NMOC.
19Portfolio Valuation Breakdown by Countries
▪ Well-diversified spread across regions Singapore 34.4%1 SGD mil
InterContinental Singapore 21.9% 535.0
Fraser Suites Singapore 12.5% 305.0
Australia 34.5%1 AUD mil
Sofitel Sydney Wentworth 13.4% 307.7
Sofitel
Novotel Rockford Darling Harbour 4.5% 104.8
Sydney
Fraser Suites Sydney
Wentworth 5.6% 128.5
12.4%
Novotel Melbourne on Collins 11.0% 251.3
Total United Kingdom 13.6%1 GBP mil
Park International Hotel 3.1% 41.1
Portfolio Value Best Western Cromwell 1.3% 17.9
S$2.439b Fraser Place Canary Wharf 3.0% 39.8
Fraser Suites Queens Gate 4.4% 58.5
Fraser Suites Edinburgh 1.1% 14.6
Fraser Suites Glasgow 0.7% 10.0
Japan 7.8%1 JPY mil
ANA Crowne Plaza Kobe 7.8% 15,700.0
Malaysia 5.7%1 MYR mil
The Westin Kuala Lumpur 5.7% 430.0
Germany 4.0%1 EUR mil
Maritim Dresden Hotel 4.0% 61.2
1 Composition based on SGD.
20Risk and Capital
Management
InterContinental SingaporeRisk and Capital Management
As at 30 Sep 2017 As at 30 Sep 2017
Investment Properties S$2,172.1m Weighted Average Years to Maturity 2.07 years
Property, Plant and Equipment S$267.3m Unsecured Debt 96.2%
Total Assets S$2,533.9m Effective Cost of Borrowing 2.6%
Total Borrowings S$810.9m Borrowings on Fixed Rates 74.7%
Gearing 32.1% Interest Cover 5.09 times
Net Asset Value (NAV) per Stapled Security 81.59 cents FHT’s Issuer Rating by Moody’s Baa2
SGD (m) Debt Maturity Profile Balance Sheet Hedging
600.0
GBP 55.5%
500.0 558.81
EUR 31.5%
400.0
300.0 AUD 27.4%
200.0 MYR 22.1%
100.0 124.7 120.0 JPY 15.0%1
0.01 0.0
0.0
2018 2019 2020 2021 2022 0% 20% 40% 60%
1 The JPYSGD cross currency interest rate swap contract underlying the bank borrowings of S$108.8 million was unwound in 4Q FY2017. FHT plans to
refinance this amount in FY2018, ahead of the loan maturity in Jul 2019. The loan-to-valuation ratio for JPY assets is expected to increase post-refinancing.
22Outlook
Park International LondonAustralia
• For Jan to Aug 2017, Tourism Australia reported an increase
in international arrivals of 7.4% yoy, with Chinese visitors
growing 12.1%.
• Sydney’s strong performance is expected to continue,
supported by strong corporate demand, inbound tourism
growth and a busy events calendar. Stable occupancy and
growth in ADR are expected to further push RevPAR
upwards1.
• The growth in Melbourne’s hotel occupancy is expected to
remain subdued due to more room supply. Nonetheless, its
market outlook stays positive, with both rates and occupancy
expected to remain high and stable2.
Pictures from Fraser Suites Sydney and Sofitel Sydney Wentworth.
1 Source: JLL – Asia Pacific Property Digest, Q2 2017
2 Source: Savills – Asia Pacific Hotel Sentiments Survey, 2H 2017
24Singapore
• Singapore Tourism Board reported a yoy growth of 4.0% in
visitor arrivals for Jan to Aug 2017. China and Indonesia
were the top source markets, accounting for 36% of total
arrivals.
• Singapore continues to grow its robust pipeline of MICE
events, having successfully secured 8 large congresses and
tradeshows recently. Most of these events such as Campus
Party (the world's largest technology-based festival) and the
20th International Congress of Endocrinology will make their
debut in Southeast Asia or Asia, attracting 20,000 additional
visitors to the city1.
• While pressure on hotel trading performance remains in
2017 due to new supply, this is expected to ease as new
hotel projects going forward suggest substantially slower
supply growth2.
Pictures from Gardens by the Bay, InterContinental Singapore and Fraser Suites Singapore
1. Source: Singapore Tourism Board
2. Source: JLL – Asia Pacific Property Digest, Q2 2017 and Singapore – The Next Chapter
in Hotels & Tourism, Sep 2017
25United Kingdom
• According to Visit Britain, the UK received 23.1 million
overseas visitors for Jan to Jul 2017, up 8.0% yoy.
• London’s hotel business has been boosted by recovery of the
global economy and the weaker pound which has attracted
more leisure tourists from overseas.
• These positive factors should continue to support growth in
2018 but to a lesser extent. Brexit uncertainty is a possible
dampener on business travel to the UK and the slowdown in
the economy may also subdue domestic spending on hotels1.
Pictures from Visit London, Fraser Suites Edinburgh and Fraser Suites Queens Gate.
1 Source: PwC – As good as it gets? UK hotels forecast 2018, Sep 2017
26Japan
• For Jan to Sep 2017, Japan National Tourism Organization
recorded 17.9% growth in foreign visitors, with the number of
Korean and Chinese visitors growing 40.3% and 11.0% yoy
respectively.
• The strong momentum of inbound tourism is expected to
continue going forward, supported by key events including
the Rugby World Cup 2019 in Fukuoka, 2020 Tokyo Olympic
Games and the highly anticipated integrated resort
development1.
• With the government’s efforts to develop wide-area tour
routes in regional cities, there appears to be more upside
potential for hotels outside of Tokyo1.
Pictures from IHG ANA Crowne Plaza Kobe.
1 Source: Savills – Spotlight: Japan Hospitality, Sep 2017
27Malaysia
• According to Tourism Malaysia, tourist arrivals declined
marginally by 0.9% yoy to 10.8 million for Jan to May 2017.
Chinese tourists grew 7.8% yoy for the same period.
• Tourism Malaysia is targeting 31.8 million international
arrivals for 2017.
• While hotel trading performance in Kuala Lumpur has
improved, significant new supply over the next few years is
likely to maintain pressure on room rates1.
• Continued efforts by Tourism Malaysia to promote tourism
and flight connectivity, targeting new source markets such as
the Middle East and Europe, will be key factors to
maintaining hotel demand1.
Pictures from The Westin Kuala Lumpur and Tourism Malaysia.
1 Source: JLL – Asia Pacific Property Digest, Q2 2017
28Germany
• The Federal Statistical Office of Germany recorded a yoy
increase of 3.0% in the number of domestic and foreign
overnight stays for Jan to Jul 20171.
• In Dresden, the total number of domestic and foreign visitors
rose 4.5% yoy for Jan to May 20172.
• The capital city of the Free State of Saxony continues to
grow its pipeline of MICE events including Borsentag Tag,
DATE (Design, Automation and Test in Europe), HAUS 2018
and Hematology and Oncology Conference.
Pictures from Semperoper Dresden and Maritim Hotel Dresden.
1 Source: www.destatis.de
2 Source: www.dresden.de
29Thank you
Resilient and Diversified Portfolio Across Geography
                                        Edinburgh
                                         Edinburgh
                                      Fraser Suites Edinburgh
                                         ▪ Fraser Suites Edinburgh

Glasgow
                                       Europe
▪ Fraser Suites Glasgow
                           United
                          Kingdom
                                         Germany

London                                                                                                                        Kobe Kobe
▪ Fraser Suites Queens Gate                                                                                                   ▪ ANA Crowne Plaza Kobe
▪ Fraser Place Canary Wharf                                                                                           Japan
▪ Best Western Cromwell
▪ Park International London

Dresden                                                                                                            Asia
▪ Maritim Hotel Dresden
                                                                                          Malaysia

                                                                                                     Singapore
                                                                                                                              Sydney

15                          9              3,914                                                                              ▪ Fraser Suites Sydney
                                                                                                                              ▪ Novotel Rockford Darling
                                                                                                                               Harbour
                                                                     Kuala Lumpur                                             ▪ Sofitel Sydney Wentworth
Properties                  Cities        Keys                              KualaKuala
                                                                                   Lumpur                   Australia
                                                                     ▪ The Westin      Lumpur

                                                                                                                                   Melbourne
S$1.4b                              S$2.5b                                          Singapore                                      ▪ Novotel Melbourne
                                                                                                                                    on Collins
Market Cap                          Total Assets                                    ▪ Fraser Suites Singapore
                                                                                    ▪ InterContinental Singapore
(as at 27 Oct 2017)                 (as at 30 Sep 2017)
                                                                                       Singapore

                                                                                                                                                           31
Portfolio Overview
Hotel Properties Managed by Third-Party Operators
Property Country Description Tenure Class Rooms
Only 5-star luxury hotel in
InterContinental Singapore to preserve Peranakan
Singapore 75 years Luxury 406
Singapore heritage in a shop house style
setting
Novotel Rockford 4.5-star hotel located within close
Australia proximity of Sydney’s Darling 84 years Mid-scale 230
Darling Harbour Harbour & Chinatown
Iconic 5-star hotel in Sydney’s
Sofitel Sydney core CBD within a short walk to
Australia 75 years Luxury 436
Wentworth major office buildings, tourist
attractions and transport hubs
Novotel Melbourne on Strategically located within
Australia Melbourne’s core CBD area Freehold Upscale 380
Collins along Collins Street
Best Western Cromwell United Distinctive white Victorian façade
75 years Mid-scale 85
London Kingdom located in the heart of London
32Portfolio Overview
Hotel Properties Managed by Third-Party Operators
Property Country Description Tenure Class Rooms
Park International United Elegant hotel ideally located in the
75 years Mid-scale 171
London Kingdom heart of Kensington & Chelsea
ANA Crowne Plaza Unique panoramic view of Kobe Upper
Japan Freehold 593
Kobe city from Rokko mountain Upscale
5-star luxury hotel located in the
Upper
Westin Kuala Lumpur Malaysia center of Kuala Lumpur’s bustling Freehold 443
Upscale
Golden Triangle area
Heritage-listed and located in the
historical city centre of Dresden,
Maritim Hotel Dresden Germany Freehold Upscale 328
the capital city of the eastern
German state of Saxony
33Portfolio Overview
Serviced Residences Managed by Frasers Hospitality
Property Country Description Tenure Class Rooms
Luxurious serviced residences in
Upper
Fraser Suites Singapore Singapore the prime residential district of 75 years 255
Upscale
River Valley
First luxury apartments in Sydney
Upper
Fraser Suites Sydney Australia designed by internationally 75 years 201
Upscale
renowned architects
Rustic 1750s sandstone building
United Upper
Fraser Suites Edinburgh located in the heart of Edinburgh’s 75 years 75
Kingdom Upscale
Old Town
United Stunning renovated 1850s building Upper
Fraser Suites Glasgow 75 years 98
Kingdom formerly the city bank of Glasgow Upscale
Fraser Suites Queens United Beautiful Victorian apartment hotel Upper
75 years 105
Gate Kingdom in Kensington Upscale
Stunning apartments located by
Fraser Place Canary United Upper
River Thames showcasing chic 75 years 108
Wharf Kingdom Upscale
contemporary design
34You can also read