VGP Company Presentation - May 2021 www.vgpparks.eu - VGP Group

Page created by Catherine Francis
 
CONTINUE READING
VGP Company Presentation - May 2021 www.vgpparks.eu - VGP Group
VGP
Company Presentation
May 2021

                       www.vgpparks.eu
VGP Company Presentation - May 2021 www.vgpparks.eu - VGP Group
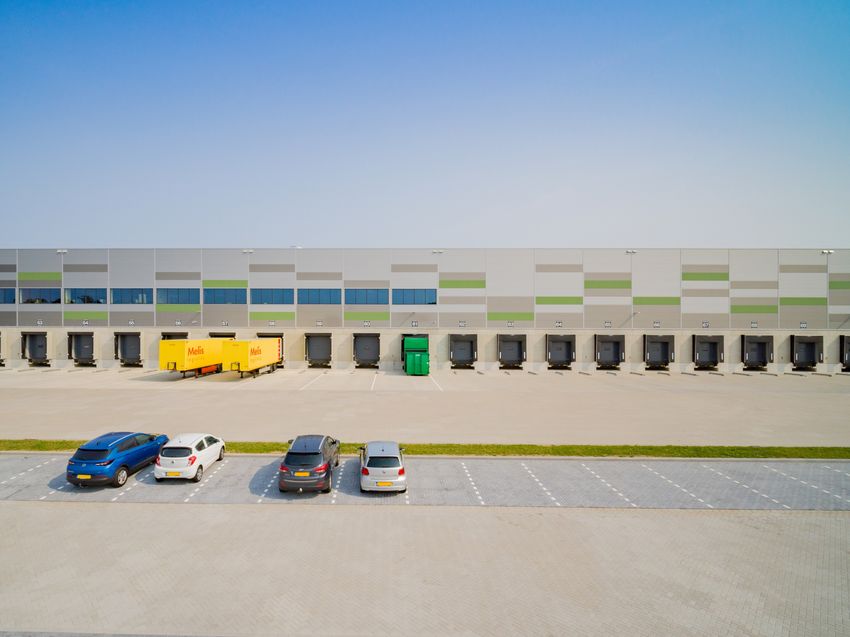
1. Introduction to
   VGP
VGP Company Presentation - May 2021 www.vgpparks.eu - VGP Group
Fully integrated pure-play logistics real-estate company

     Company at a glance                                                                                 Portfolio KPI’s as of 30-Apr-21

     n Pan-European operator, owner and developer of prime                                                                                                                   129
       logistics and light industrial parks                                                                  €3.84bn1                    80                    311        Number of
                                                                                                              Total GAV                Parks                 Tenants      completed
     n Fully integrated business model with expertise across                                                                                                               buildings
       value chain: c.300 employees in 13 countries

     n High quality standardised logistic and semi-industrial real                                                                                                       €196.8mm
                                                                                                             3.7 years
       estate asset base                                                                                                              99.6%2               8.3 years3     Committed
                                                                                                              Average
                                                                                                                                    Occupancy                WAULT        annualised
                                                                                                            Building Age
     n All new buildings delivered at least certified BREEAM                                                                                                             rental income
       Very Good or equivalent4

     n Fully let standing portfolio and significantly pre-let
       development pipeline: Completed portfolio is 99.6% let                                            Financial KPI’s as of 31-Dec-20
       and Portfolio under construction is 80.1% pre-let as of
       April 2021
                                                                                                           €407.3mm                   25.2%                  €1.3bn                 :
     n VGP well financed and strongly capitalized: shares listed                                                                                         Shareholders’
       on Euronext Brussels and Prague Stock Exchange                                                          EBITDA              Gearing ratio
                                                                                                                                                            Equity
                                                                                                                                                                            BBB-
       since 2007

     n Successful and long-term partnership with Allianz Real
       Estate since 2016: 3 joint ventures since inception

1.    Gross Asset Value of VGP, including own portfolio and joint ventures at 100% as of 31 December 2020
2.    Operating EBITDA (Incl. JV at share) and is calculated as investment EBITDA, property development EBITDA and property management and asset management EBITDA
3.    Refers to WAULT of JV and Own portfolio combined.
4.    Started-up after 1 January 2020.
                                                                                                                                                                                        3
VGP Company Presentation - May 2021 www.vgpparks.eu - VGP Group
Overview of VGP Parks

  GERMANY                                  HUNGARY
  01 VGP Park Frankenthal                  50 VGP Park Győr
  02 VGP Park Bobenheim-Roxheim            51 VGP Park Alsónémedi
  03 VGP Park Leipzig                      52 VGP Park Kecskemét
  04 VGP Park Leipzig-Borna                53 VGP Park Hatvan
  05 VGP Park Berlin                       ROMANIA
  06 VGP Park Höchstadt                    54 VGP Park Timisoara
  07 VGP Park Rodgau                       55 VGP Park Sibiu
  08 VGP Park Bingen                       56 VGP Park Brasov
  09 VGP Park Hamburg                      57 VGP Park Bucharest
  10 VGP Park München                      58 VGP Park Arad
  11 VGP Park Soltau                       LATVIA
  12 VGP Park Ginsheim-Gustavsburg         59 VGP Park Kekava
  13 VGP Park Schwalbach                   SPAIN
  14 VGP Park Berlin-Wustermark            60 VGP Park Lliça d’Amunt
  15 VGP Park Göttingen                    61 VGP Park San Fernando de Henares
  16 VGP Park Wetzlar                      62 VGP Park Fuenlabrada
  17 VGP Park Halle                        63 VGP Park Valencia Cheste
  18 VGP Park Dresden                      64 VGP Park Zaragoza
  19 VGP Park Bischofsheim                 65 VGP Park Sevilla
  20 VGP Park Giessen-Buseck               66 VGP Park Cuidad de la Imagen
  21 VGP Park Giessen-Lützellinden         67 VGP Park La Naval
  22 VGP Park Giessen Am Alten Flughafen   NETHERLANDS
  23 VGP Park Laatzen                      68 VGP Park Roosendaal
  24 VGP Park Magdeburg-Sülzetal           69 VGP Park Nijmegen
  25 VGP Park Chemnitz                     70 VGP Park Moerdijk
  26 VGP Park Erfurt                       ITALY
  27 VGP Park Ottendorf-Okrilla            71 VGP Park Calcio
  28 VGP Park Einbeck                      72 VGP Park Valsamoggia
  29 VGP Park Berlin Oberkrämer            73 VGP Park Parma
  30 VGP Park Rostock                      74 VGP Park Verona
  31 VGP Park Leipzig-Flughafen            75 VGP Park Sordio
  32 VGP Park Heidelberg                   76 VGP Park Padova
  CZECH REPUBLIC                           AUSTRIA
  33 VGP Park Ústi nad Labem               77 VGP Park Graz
  34 VGP Park České Újezd
  35 VGP Park Hrádek nad Nisou
  36 VGP Park Tuchoměřice
  37 VGP Park Liberec
  38 VGP Park Plzeň
  39 VGP Park Brno
  40 VGP Park Olomouc
  41 VGP Park Jeneč
  42 VGP Park Chomutov
  43 VGP Park Prostějov
  44 VGP Park Vyškov                       PORTUGAL
  45 VGP Park České Budějovice             78 VGP Park Santa Maria da Feira
  46 VGP Park Kladno                       79 VGP Park Sintra
  SLOVAKIA                                 80 VGP Park Loures
  47 VGP Park Bratislava
  48 VGP Park Malacky
  49 VGP Park Zvolen

                                                                                 4
VGP Company Presentation - May 2021 www.vgpparks.eu - VGP Group
Key ESG goals of VGP:
Net carbon neutrality by 2025 target introduced in 2021

                   Invest in income generating renewable energy assets

                          Green power generation capacity of 48.8 MWp; target increased to 200MWp

                             34.9% of the total portfolio has now been environmentally certified; All new
                             buildings delivered at least certified BREEAM Very Good or equivalent

                              Board continues diversity lead – women represent 60% of our board

                             VGP Foundation identified first 24 support projects

                 TARGET
                          Target by 2025 to be net carbon neutral under Scope 1 and 2

                   Reporting in accordance with GRI-standards and CDP greenhouse emissions

                                                                                                            5
VGP Company Presentation - May 2021 www.vgpparks.eu - VGP Group
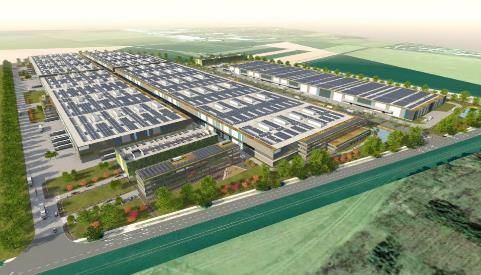
Successful track record of geographic expansion and continued
  delivery across markets
                                                                                                                            2020
                                                                                          2018              n€309mm ABBs (€109mm in
                                                                                                             September and €200mm in April)

                                                                    2016             nFurther expansion
                                                                                                            nLaunch of 3rd JV (first development JV)
                                                                                                            nLaunch of 4th JV (second
                                                                                      throughout Western     development JV)
                                               2013            nEstablished
                                                                                      and Southern-

                  2007 - 2009                                   partnership with
                                                                                      Europe

                                         nExpansion to
                                          Germany
                  nExpansion through
                   CEE and Baltics

                                                                                                                                    nExpansion of team
                                                                                                                                     with Last Mile
                                                                                                                                     experts
                                                                                    nFully-marketed        nExpansion
                                                                                                                                    nIncreasing focus on
                                                                                     secondary equity       to Portugal              Brownfield
                                                                                     offering of €285mm    nLaunch of 2nd            developments
                                                              nExpansion to Spain
                                         nSale of Czech                                                     (50/50) Joint Venture   nAnnounced target
                  nListing on Euronext    assets to Tristan                                                                          to be carbon neutral
                                                                                         2017
                   Brussels and Prague    Capital Partners
                                                                   2015                                                              by 2025 under

nVGP founded in
                   Stock Exchange                                                                               2019                 Scope 1 and 2

 Czech Republic
                                              2011
                       2007                                                                                                               2021
    1998
                                                                                                                                            6
VGP Company Presentation - May 2021 www.vgpparks.eu - VGP Group
Fully integrated business model with in-house capabilities
and competences

                           Concept &                                                                                   Ancillary
       Land                                      Construction                Rent                Portfolio
                            Design                                                                                     Services

n Identification of    n In-house design      n Acting as a           n Mainly long term    n Long term            n Assisting clients
  top locations          of buildings           general                 lease agreements      developer /            with transitioning
  close to large         based on strict        contractor on a                               investor (own          towards
                                                                      n Officers
  metropolitan           guidelines for         significant part of                           portfolio or sale      sustainable
  areas and directly     multi-purpose          the construction        responsible for       to one of the JVs)     energy usage in a
  connectable to         utilisation            pipeline                monitoring of the                            cost-effective
  existing                                                              tenants’            n Portfolio
                                                                                                                     way
                     n   Strategic alliance   n Contracting in          requirements          management
  infrastructure
                         with architecture      close cooperation       until the             - Asset              n Offering green
n Evaluate potential     firms                  with future             handover of the         management           energy (on- or off-
  projects,                                     tenants                 premises              - Property             site), smart
                       n Adaptation
  technical due                                                                                 management           energy
  diligence              according to         n High technical        n Working together
                                                                                                                     management,
                         tenants‘               and quality             with local real     n Centralised            green electric
n Obtain the zoning      requirements but       standards               estate brokers        maintenance of         and hydrogen
  and building           within VGPs own                                                      properties             charging facilities
  permit                 standard building
                         parameters

                       Full control and expertise across the value chain with no value leakage

                                                                                                                                      7
VGP Company Presentation - May 2021 www.vgpparks.eu - VGP Group
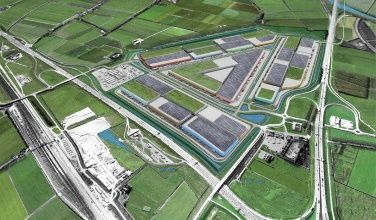
Unique strategy enabling growth

      Develop, hold and sell-to-jv strategy with an aim to maximise shareholder value and
                                    optimise capital allocation
                                                                                            8
VGP Company Presentation - May 2021 www.vgpparks.eu - VGP Group
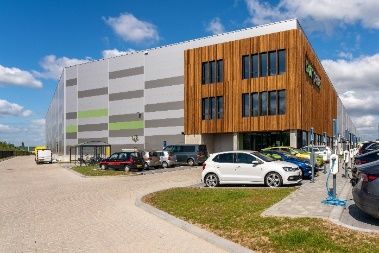
Strategic partnership with Allianz Real Estate through three
established joint ventures
VGP European Logistics                         VGP European Logistics 2                3rd JV: VGP Park München

            50%            50%                               50%   50%
                                                                                                        50%       50%

                                                            100%
5.1%              94.9%   100%    Czech                                    Austria
       Germany
                                 Republic
                                                            100%
                                                                            Italy
                          100%
                                 Slovakia
                                                            100%
                                                                         Netherlands
                          100%
                                 Hungary
                                                            100%
                                                                          Portugal

                                                            100%
                                                                          Romania

                                                            100%
                                                                           Spain

Highlights VGP European Logistics and VGP European Logistics 2                         Highlights VGP Park München JV

§ First two JVs have a combined investment target of €3.7 billion gross asset          § First Joint Venture with Allianz Real
   value                                                                                  Estate to initially focus on the
§ Right of First Refusal for the JVs to acquire assets in designated countries            development phase
§ VGP serves both portfolios as asset, property and development manager                § Sale of the park at agreed market yield
§ Joint Ventures act as long-term capital buyer at market value                        § All construction costs are financed jointly

       Driving sustainable growth through develop and hold strategy with long term partner
                                                                                                                                  9
VGP Company Presentation - May 2021 www.vgpparks.eu - VGP Group
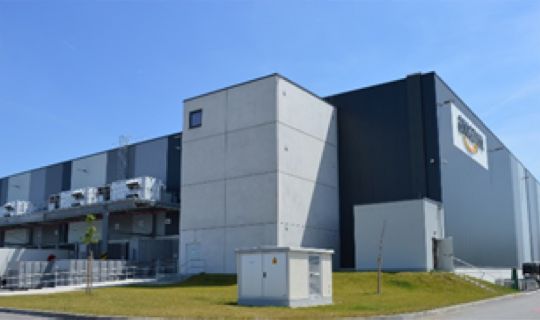
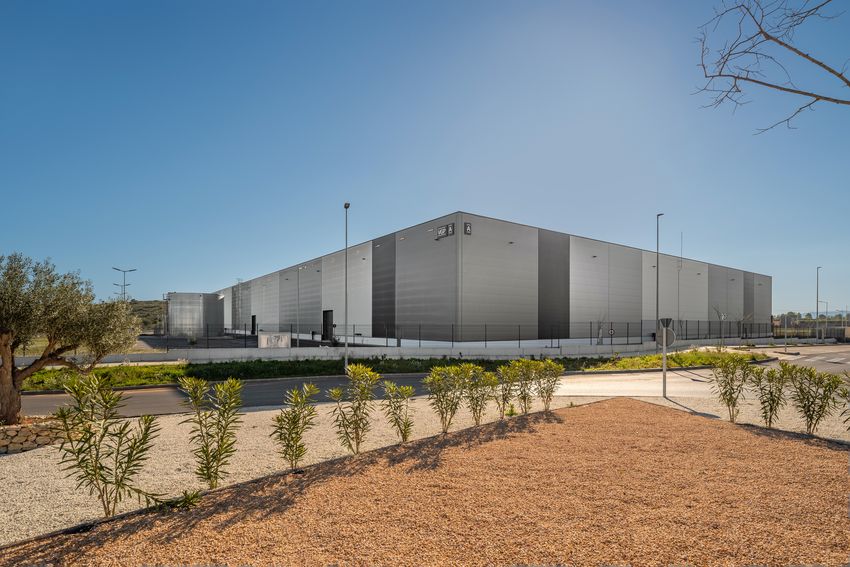
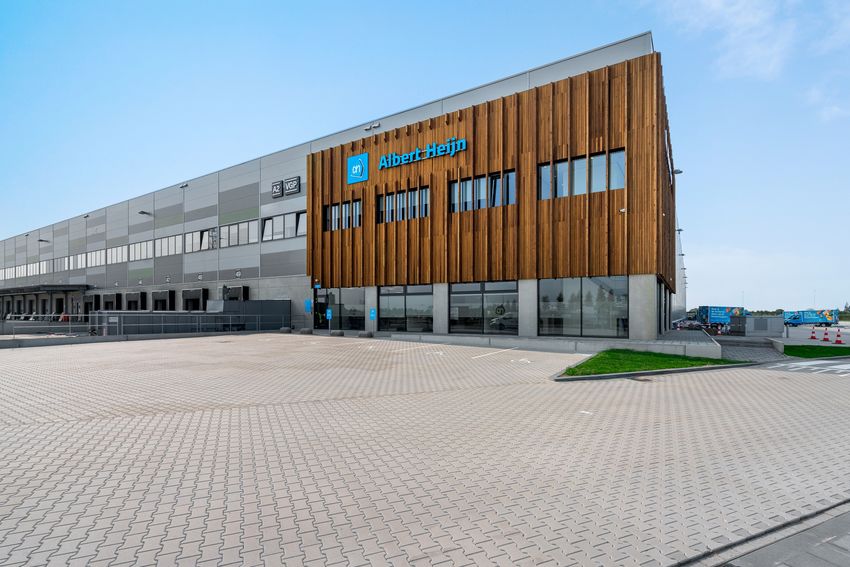
Premium asset base comprising modern and well located parks

  VGP Park Frankenthal               VGP Park Olomouc                  VGP Park Moerdijk                  VGP Park München                  VGP Park San Fernando

     Completed 2018              Construction 2016 (started)       Infrastructure works started       Construction 2019 (started)           Construction 2017-2020

Total Gross Lettable area:        Total Gross Lettable area:        Total Gross Lettable area:         Total Gross Lettable area:          Total Gross Lettable area:
       147,022 m²                        210,478 m²                        900,000 m²                         309,881 m²                          122,000 m²

 0km        82km      0km         0km        70km       0km         0km         55km       0km         0km        34km
2. Operational
   performance
Proven ability to rapidly convert acquired land into fully-let and
operational parks

   Total land bank secured (Mio. m²)                                                                Completed1 gross leasable area (‘000 m²)

                                                                                                 5,000
                                                                                                                                                           te
                                                                                                 4,500                                                Ra                 4,371
                                                                                                                                                 w th
                                                                                                                                               ro 7 %
                                                                                                                                          a l G 1: 2
                                                                                                 4,000                                 n u M ’2                           900
                                                     te                                                                              An 7-4
                                                  Ra                  12.37                                                        d
                                                 th                                                                             u n ) ’1                        3,341
                                             row 3 %                                             3,500                        po G R
                                         l G                                                                                 m A
                                      u a ’2 1 : 3                                                                        C o (C
                                   nn
                              n d A 7-4M                                        Under
                                                                                                 3,000                                        2,810                       1,023
                           o u R ) ’1                                           option
                        mp                                             3.83                                                                                      900
                     C o (C A G                                                                                               2,522
                                                                                                 2,500
                                                                                                                                               900               205
                                                                                                               1,996
                                                                                                 2,000                         900
                                                                                                                                               146
                                                                                                                719
                                                                                                 1,500                         288
                                                                                                                                                                          2,517
                                                                       8.5                                      446                                             2,236
                                                          7.7                                    1,000
                                                                                                                                              1,764
                          5.6              6.2
                                                                                                                             1,333
           4.7                                                                                     500
                                                                                                                831

                                                                                                     -
                                                                                                               2017          2018             2019              2020    4M2021
                                                                                                                                                                           20211
          2017           2018             2019            2020        20212021
                                                                      4M

                                                                                                         Projects held by JVs                      Projects held directly by VGP
                                                                                                         Projects divested

                          Development of a significant leasable area with virtually full occupancy2
     As of 30 April 2021
     1    Including 100% of JV and assets divested (see chart breakdown). 4M2021 also includes assets currently under construction
     2     Occupancy at April 2021 for completed portfolio (incl JVs) was 98.7%.                                                                                                  12
…driving resilient portfolio growth …

      Total portfolio – including 100% JV (€ million)

                                                                                                                                      3,843
                   Own portfolio
                                                                                                                                               4,000
                                                                                                            e
                                                                                                        Rat
                   JVs-related1                                                                      wth
                                                                                            a l G ro .9 %                                      3,500
                                                                                       nnu        : 33                 2,771
                                                                                u n d A 6-’ 20
                                                                                          1
                                                                           mp
                                                                              o      R) ’
                                                                        C o (C A G                                                             3,000

                                                                                               1,936
                                                                                                                                               2,500
                                                                                                                                     2,923

                                                                1,506                                                                          2,000
                                                                                                                      1,978
                                      1,195
                                                                                                                                               1,500
                                                                                                1,360
                                                                  878                                                                          1,000
                                       645

                                                                                                                                      920      500
                                                                                                                       793
                                       550                        628                             576
                                                                                                                                               -
                                      2016                       2017                            2018                 2019            2020
             Capital expenditure    €337.0m                    €261.0m                         €352.7m               €539.5m         €479.8m         €1,970m

Net cash inflow from divestments    €236.1m                    €155.7m                        €438.4m 2              €339.0m         €405.6m         €1,575m

As of 31 December 2020
1    JVs-related includes German 5.1% stake held directly by VGP and portion of Held-for-Sale being developed on behalf of the JVs
2    Includes sale of Mango building, Spain (€150m)

                                                                                                                                                           13
…which has resulted in a diversified investment portfolio

    Investment portfolio breakdown1

   Country breakdown                                          Completed vs Under Construction vs Land Bank
                                     Hungary
                  Slovakia           €93mm – 2%                                 Development land
                   €91mm
                                                                                    €399mm
                       3%                   Other
    Romania                                                                           10%
                                           €140mm
    €120mm
                                             4%
        3%
      Netherlands                                                   Under
     €276mm – 7%                                                 Construction
       Spain                                                      €818mm
    €292mm – 8%                                                      21%

                                                                                                   Completed
        Czech Republic                                                                             €2,626mm
                                                   Germany                                            68%
           €507mm                                 €2,308mm
             13%                                     60%

    n       The Investment portfolio has grown to €3,843 million1 , up 38.7%YoY

    n       Western Europe, represents:

              n       77% of total portfolio as of Dec-201

              n       89% of combined portfolio growth contribution YoY

              n       93% of operating EBITDA incl. JVs at share over FY 2020

 As of 31 December 2020
 1    Including 100% of JVs assets                                                                             14
Portfolio leased on a long-term basis to a diversified and
 blue-chip customer base

   Weighted average term of the portfolio                                        Blue-chip top 10 Tenants (JVs at 100%)

Combined                                                 8.3 years                       Krauss Maffei
                                                                                                                                         14.1%
                                                                                               Amazon                            6.5%
          JV                                           7.8 years
                                                                                      Rhenus Logistics                    4.1%
       Own                                                      9.8 years        Drylock Technologies             2.5%
                                                                                          BMW Group               2.4%
      years 0           2        4          6      8       10        12     14     MediaMarktSaturn               2.3%
                              First Break        WALT                                              4PX          1.7%

   Tenant portfolio breakdown – by industry segment                                             Connox          1.6%

                                         Other                                             Volkswagen          1.5%
                                         1.5%                                                       Lidl
                E-commerce                                                                                     1.4%
                   22.2%
                                                        Logistics
                                                         40.3%
                                     TBU

                      Light industrial
                          36.0%

                            Diversified customer base                                           Top 10 clients count for 38.2%

As of 30 April 2021                                                                                                                     15
Well advanced land bank to support future growth

Build-up of Land bank (m2 )                                                        Land bank1 – geographic breakdown

                                                                12,360,000

                                                                3,820,000
                                                    8,540,000                           Other 19%
                                                                                                                    Germany 21%

        5,470,000
                                                    3,090,000
                                      5,450,000                                    Slovakia 8%

                       (490,000)       470,000                                      Spain 8%                          Netherlands 16%

                                                                               Czech Republic 14%
                                                                                                                Romania 14%

       Land owned      Deployed
                       Deployed        Acquired     Committed
                                                     Secured    Letters of
    LandDec 2020
         owned 2019    4M 2021          4M2020YTD
                                   Acquired 2021                 intent
                                                                  LoI

                                                                               1    Geographical breakdown of development potential
                                                                                    (split by m2) of the owned and committed land bank
                Owned and committed land bank

  n        Total land bank (owned and committed) of 8.54 million m2 equates to development potential of
           3.97 million m2
  n        In addition, 3.82 million m2 of land under option, subject to due diligence, with 1.58 million m2 of
           development potential
                5.55 million m2 of development potential embedded in the Land bank
 As of 30 April 2021

                                                                                                                              16
3. Financial
   performance
Income Statement – FY2020

n       Operating profit up €165.3mm to €370.9mm

          n       Increase driven by higher net valuation gain (up
                  €178.2mm) and lower financial expense (down
                  €5.6 mm) compensating higher admin
                  expenses (€11.2mm)

n       On a “look-through”- basis 1 net rental is up by
        € 8.6 mm YoY to € 55.3mm

n       Net valuation gains on the property portfolio of
        € 366.4mm

          n       Positively affected by the new 50:50 VGP Park
                  München joint venture

          n       The own standing property portfolio is valued
                  on a weighted average yield of 5.51% (vs. 5.76%
                  as at 31 Dec ’19)2

n       Administrative expenses of € 29.3mm

          n       Increase mainly due to additional accrual
                  accounted for in respect of LTIP

n       Other expenses of €4mm, reflecting contribution to
        VGP Foundation

    1   Look-through basis includes VGP’s share of the JVs net rental income
    2   The (re)valuation of the own portfolio was based on the appraisal report of the property expert Jones Lang LaSalle   18
Income Statement – FY2020 by segment

 Investment                                                        Development                                                      Property and Asset Management
€ million                                 2020         2019      € million                                2020           2019      € million                                 2020        2019

Gross rental income                        12.1         11.7     Gross rental income                           -              -   Gross rental income                                -          -

Property operating expenses                (0.4)        (0.3)    Property operating expenses               (3.4)          (2.3)   Property operating expenses                        -          -

Net rental income                          11.7         11.4     Net rental income                         (3.4)          (2.3)   Net rental income                                  -          -

Joint venture management fee                                     Joint venture management fee                                     Joint venture management fee
                                               -            -                                                  -              -                                                  14.7     10.5
income                                                           income                                                           income

Net valuation gains on investment                                Net valuation gains on investment                                Net valuation gains on investment
                                               -            -                                             365.7          186.8                                                       -          -
properties destined to the JVs                                   properties destined to the JVs                                   properties destined to the JVs

Administration expenses                    (2.1)        (1.7)    Administration expenses                  (19.7)         (12.0)   Administration expenses                        (5.4)    (3.2)

Share of JVs' adjusted operating                                 Share of JVs' adjusted operating                                 Share of JVs' adjusted operating
                                           45.9         36.5                                                   -              -                                                      -          -
profit after tax                                                 profit after tax                                                 profit after tax

EBITDA                                     55.5         46.2     EBITDA                                   342.5          172.5    EBITDA                                          9.3         7.2

 n         Share in result of JVs up €9.4 million                   n         Valuation gains/(losses) up €178.9                     n         Revenues include asset
           YoY corresponds to VGP’s share in                                  million YoY – Positively affected by                             management, property management
           the result of the JVs excluding any                                the new 50:50 VGP Park München                                   and facility management income
           revaluation result                                                 joint venture and further yield
                                                                              contraction

   For our 2021 reporting we will introduce a fourth pillar which will be based on income generated
                                        out of renewable energy
     Please note the segment reporting disclosure in the notes of our FY 2020 condensed consolidated interim financial statements press release for overview of adjustments to
     operating EBITDA
                                                                                                                                                                                         19
Balance sheet – assets as of Dec 2020

n       Investment Properties of €920.2mm
          n       Completed portfolio €166mm (’19: €94mm)
          n       Under Construction €457mm (‘19: €338mm)
          n       Development land €297mm (‘19: €361mm)
n       Investment in Joint Ventures and associates increased
        to €654.8 mm by €267.5 mm, reflecting:
          n       JV1: €83.9mm (incl. closing VII for JV1)
          n       JV2: €42.8mm (incl. closing II for JV2)
          n       JV3: €127.9mm (setup of 3rd JV for München)
          n       JV4: €13.0mm (setup of 4th JV for Moerdijk)1
n       Other non-current receivables increased to
        €264.0mm from €63.6 mm, mainly reflecting
          n       shareholder loans to VGP Park München (€82.9
                  mm) and VGP Park Moerdijk (€29.0 mm), and
          n       remaining non-current balance due by Allianz
                  Real Estate in respect of VGP Park München (€
                  67.0 mm)2
n       Cash position of €222.4 mm – in addition several multi-
        year unsecured credit facilities undrawn and available
        (€150 mm as of Dec ‘20)
    1
     On 26 November 2020, VGP entered into a partnership with Roozen Landgoederen Beheer in order to develop Logistics Park Moerdijk together with the
    Port Authority Moerdijk on a 50:50 basis. VGP Park Moerdijk’s share equates to more than 450,000 m 2 of lettable area

    2The remaining balance due by Allianz Real Estate in respect of the acquisition of VGP Park München shall become payable by Allianz Real Estate in
    different instalments based on the completion dates of the respective buildings
                                                                                                                                                         20
Balance sheet – Shareholders’ equity and liabilities
as of Dec 2020

n       Shareholders’ equity of €1,306mm, up €606mm
        since Dec ’19

          n       Includes effect of €309 mm of two share
                  placements

n       Total liabilities of €922 mm (2019: €925 mm)

          n       Financial debt of €783 mm (2019: €780 mm)

n       Gearing at Dec ‘20 stood at 25.2%1
          n       Well below our typical operating range for
                  gearing ratio of between 30 and 40/45%
          n       The group’s financial covenant maximum
                  consolidated gearing is 65%

    1   Calculated as Net debt / Total equity and liabilities
                                                                21
Significant headroom to key covenants

Overview                                                                           Gearing ratio (%)
 n The group has adequate cash buffers in its Joint Ventures’ portfolio’s                                                                                100
    and the Group expects that it will be able to retain its sound liquidity
                                                                                     Covenants:
Track record of the joint ventures: in excess of €1.3bn net cash
proceeds in first two joint ventures
 First JV: VGP European Logistics                                             Second JV: VGP European Logistics 2
                                                                 €176mmn                                                               €91mm
                                       GAV: c.€500mm                                                        GAV: c.€175mm
 Closing I                                                        et cash      Closing I                                               net cash
 (May ‘16)          15 parks (28 buildings) in Germany, Czech Republic,        (Jul ‘19)
                                   Slovakia and Hungary
                                                                                           3 parks (8 buildings) in Spain, Austria and Romania

                                       GAV: c.€80mm               €59mm                                                                 €180mm
                                                                                                            GAV: c.€258mm
 Closing II                                                       net cash    Closing II                                                net cash
 (Oct ‘16)                  5 buildings in Germany and Slovakia               (Nov ‘20)    9 buildings, including 7 in 3 new VGP Parks in Spain,
                                                                                                    The Netherlands, Italy and Romania
                                                                  €122mm
  Closing                              GAV: c.€173mm
                                                                  net cash
     III          6 parks (7 buildings) and 4 newly completed buildings in
 (May ‘17)                      Germany and Czech Republic

                                       GAV: c.€400mm               €290mm
  Closing                                                          net cash      VGP net cash proceeds of €271mm from Second JV
     IV           6 parks (13 buildings) and 5 newly completed buildings in
 (May ‘18)                 Germany, Czech Republic and Hungary
                                                                  €125mm
                                       GAV: c.€203mm
 Closing V                                                        net cash
 (Apr ‘19)          3 parks (3 buildings) and another 6 newly completed       Third JV: VGP Park München
                         buildings in Germany and Czech Republic
                                                                                 Seed                                                   €87 mm
                                                                  €123mmn
                                       GAV: c.€232mm                            closing                                                 net cash
   Closing                                                         et cash                                  GAV: c.€187mm
      VI                                                                       (Jun ‘20)
                  13 buildings, including 7 in 3 new VGP Parks in Germany
  (Nov ‘19)                          and Czech Republic                                                                                 €16mm
                                                                  €126mm      Closing I                                                 net cash
                                       GAV: c.€166mm                          (Dec ‘20)                      GAV: c.€55mm
   Closing                                                        net cash
     VII
                  10 buildings, including 2 in 2 new VGP Parks in Germany,
  (Oct ‘20)                      Czech Republic and Slovakia

                                                                                   VGP net cash proceeds of €103mm from Third JV

      VGP net cash proceeds of €1,021mm from First JV
  1    Calculated as Net debt / Total equity and liabilities
                                                                                                                                      23
Disclaimer

ABOUT VGP

VGP is a pan-European developer, manager and owner of high-quality logistics and semi-industrial real estate. VGP
operates a fully integrated business model with capabilities and longstanding expertise across the value chain. The
company has an owned and committed development land bank of 8.54 million m² and the strategic focus is on the
development of business parks. Founded in 1998 as a Belgian family-owned real estate developer in the Czech
Republic, VGP with a staff of c. 300 employees today owns and operates assets in 11 European countries directly
and through its 50:50 joint ventures. As of December 2020, the Gross Asset Value of VGP, including the joint
ventures at 100%, amounted to €3.84 billion and the company had a Net Asset Value (EPRA NAV) of €1.35 billion.
VGP is listed on Euronext Brussels and on the Prague Stock Exchange (ISIN: BE0003878957).

For more information, please visit: http://www.vgpparks.eu

Forward-looking statements: This presentation may contain forward-looking statements. Such statements reflect
the current views of management regarding future events, and involve known and unknown risks, uncertainties and
other factors that may cause actual results to be materially different from any future results, performance or
achievements expressed or implied by such forward-looking statements. VGP is providing the information in this
presentation as of this date and does not undertake any obligation to update any forward-looking statements
contained in this presentation in light of new information, future events or otherwise. The information in this
document does not constitute an offer to sell or an invitation to buy securities in VGP or an invitation or inducement
to engage in any other investment activities. VGP disclaims any liability for statements made or published by third
parties and does not undertake any obligation to correct inaccurate data, information, conclusions or opinions
published by third parties in relation to this document or any other document or press release issued by VGP.

                                                                                                                   24
You can also read