Investor presentation - July 2019 - Scatec Solar
←
→
Page content transcription
If your browser does not render page correctly, please read the page content below
Investor presentation
July 2019

Disclaimer
The following presentation is being made only to, and is only directed at, persons to whom such presentation may
lawfully be communicated (’relevant persons’). Any person who is not a relevant person should not rely, act or make
assessment on the basis of this presentation or anything included therein.

The following presentation may include information related to investments made and key commercial terms thereof,
including future returns. Such information cannot be relied upon as a guide to the future performance of such
investments. The release, publication or distribution of this presentation in certain jurisdictions may be restricted by
law, and therefore persons in such jurisdictions into which this presentation is released, published or distributed should
inform themselves about, and observe, such restrictions. This presentation does not constitute an offering of securities
or otherwise constitute an invitation or inducement to any person to underwrite, subscribe for or otherwise acquire
securities in Scatec Solar ASA or any company within the Scatec Solar Group. This presentation contains statements
regarding the future in connection with the Scatec Solar Group’s growth initiatives, profit figures, outlook, strategies
and objectives as well as forward looking statements and any such information or forward-looking statements
regarding the future and/or the Scatec Solar Group’s expectations are subject to inherent risks and uncertainties, and
many factors can lead to actual profits and developments deviating substantially from what has been expressed or
implied in such statements.

                                                                                                                             2
Contents

• Introduction
• The solar market
• Business model
• Financials
• Outlook and guidance

                         3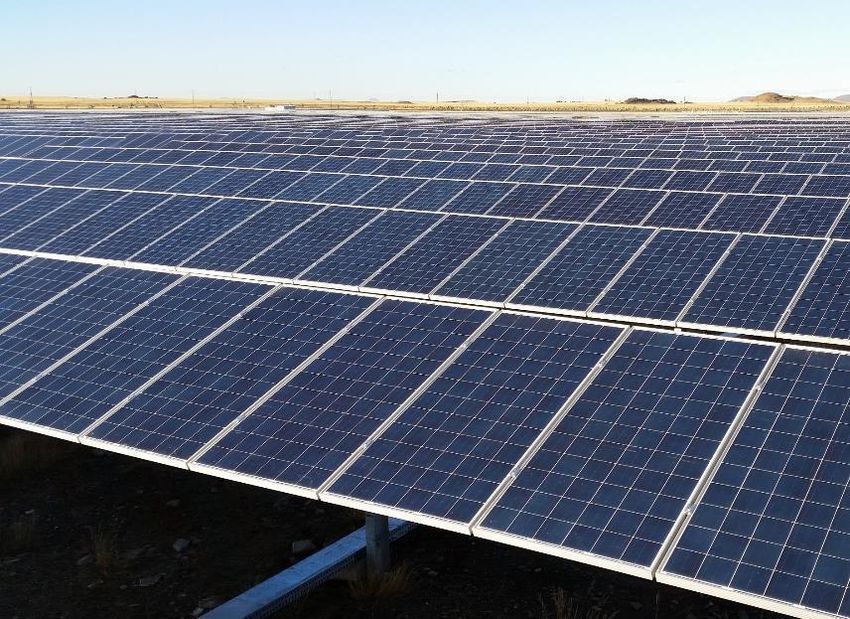
Scatec Solar – a frontrunner in renewable energy
We develop, build, own and operate utility-scale solar power plants

                  IN OPERATION
                     & UNDER        PROJECT BACKLOG        CAPACITY BY
                 CONSTRUCTION          & PIPELINE           END 2021     EMPLOYEES
                  1.9 GW               5.1 GW               3.5 GW         292

                                                                                     4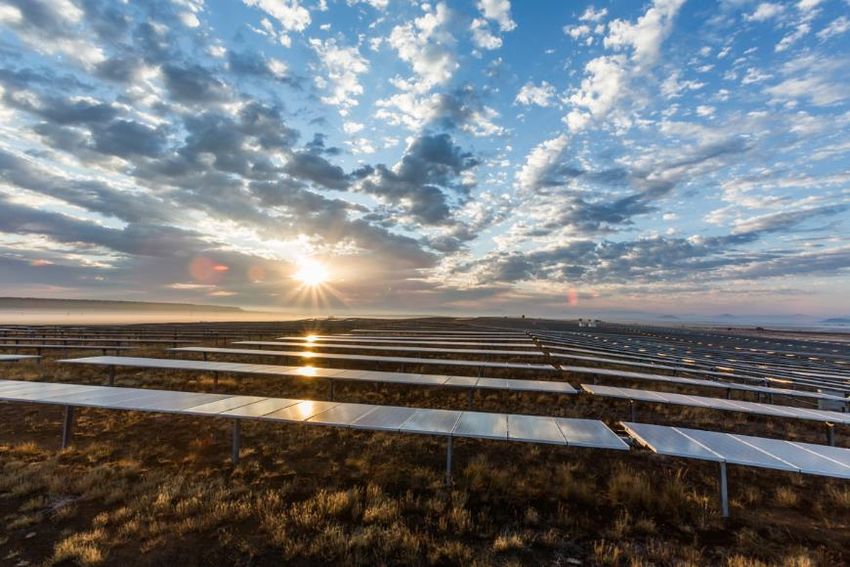
Recent achievements

               Commercial operation for the        Commercial operation for the 65
               first three power plants in Egypt   MW Jasin and 66 MW Merchang
               – 190 MW in total                   solar plants in Malaysia

               Strategic collaboration             Scatec Solar and FMO enter
               agreement for 485 MW in             equity partnership for the
               Vietnam                             Kamianka project in Ukraine

               Power production reached            Financial close and start of
               198 GWh in Q2 19, up 83%            construction for two new solar
               year on year                        plants in Ukraine – 109 MW

                                                                                     5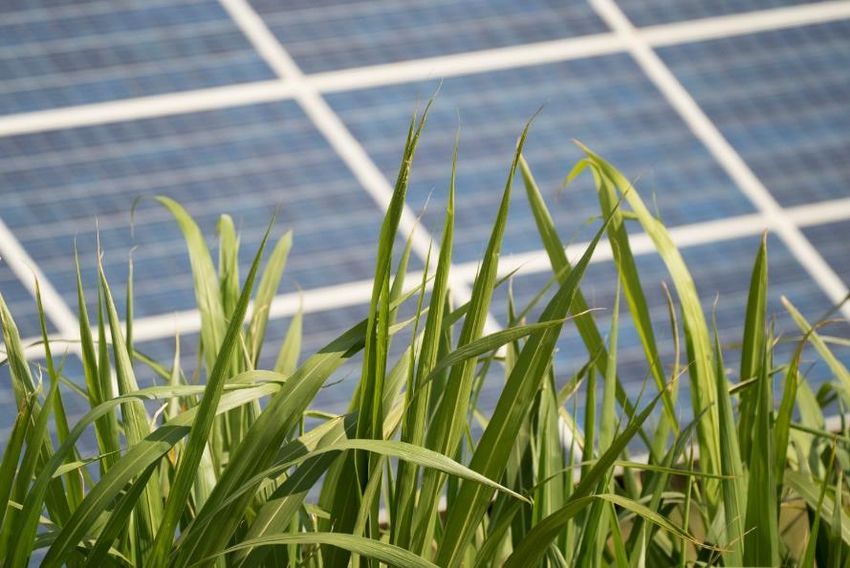
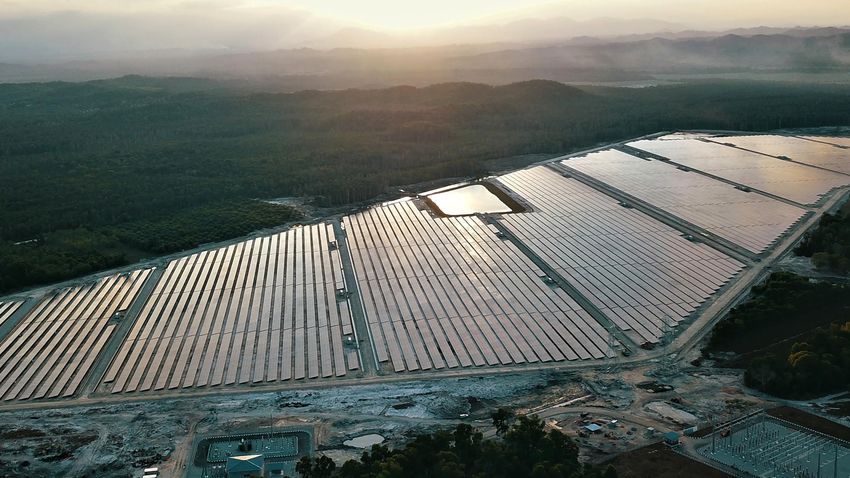
A portfolio of 951 MW in operation – track record of 1 GW+

Malaysia, 197 MW               Eqypt, 195 MW                Brazil, 162 MW              South Africa, 190 MW    Honduras, 95 MW

               Jordan, 43 MW                    Mozambique, 40 MW        Czech, 20 MW                Rwanda, 9 MW

Scatec Solar’s average economic interest: 60%

                                                                                                                                  6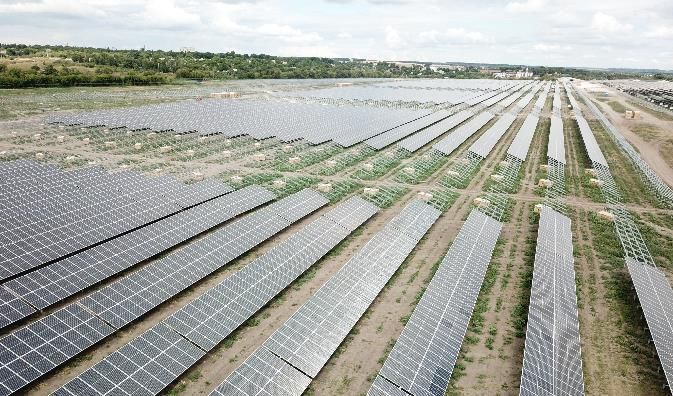
Almost 1 GW under construction on four continents
 Ukraine, 336 MW                                 South Africa, 258 MW                     Egypt, 195 MW

                          Argentina, 117 MW                             Malaysia, 47 MW

                   Scatec Solar’s average economic interest: 66%                                          7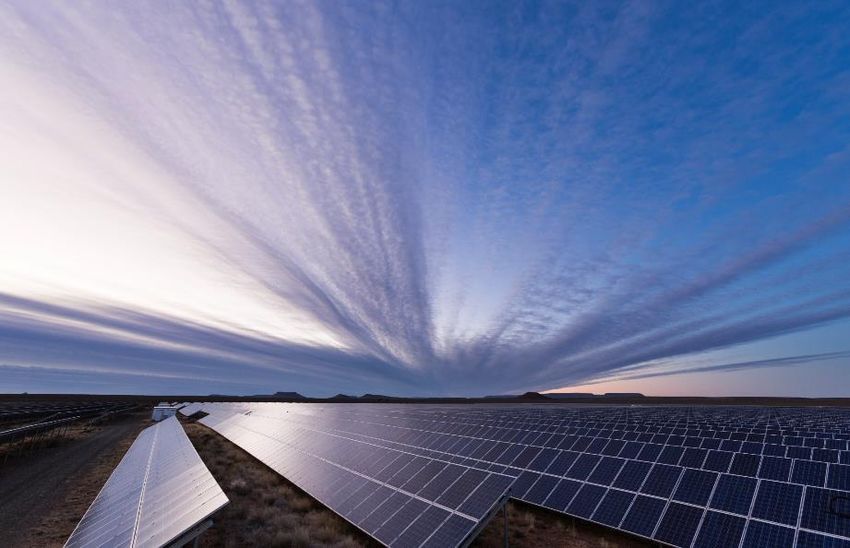
Ukraine:
336 MW closed financing and started construction over the last months

       The Kamianka project under construction.

Progressovka, 148 MW             Chigirin, 55 MW        Boguslav, 54 MW             Rengy, 47 MW              Kamianka, 32 MW
• Capex: EUR 124 mill           • Capex: EUR 53 mill    • Capex: EUR 54 mill        • Capex: EUR 52 mill      • Capex: EUR 34 mill
• Financing partners:           • Financing partners:   • Financing partners:       • Financing partners:     • Financing partners:
  • Power China Guizhou            • EBRD                 • FMO                       • EBRD                    • EBRD
    Engineering (construction      • NEFCO                • GIEK                      • Black Sea Trade and     • FMO
    Financing)                     • Swedfund             • Green for Growth Fund       Development Bank

                                                                                                                                      8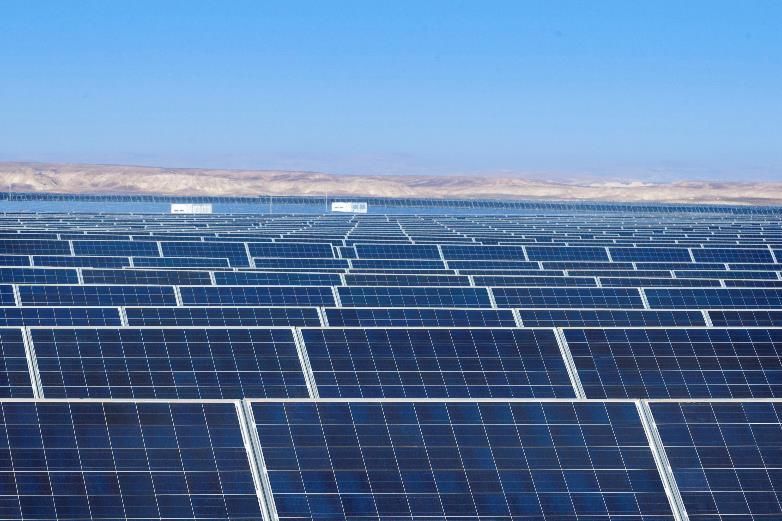
Strong market traction - backlog and pipeline now exceeding 5 GW

                                                                                                                         Price
                                                                                                                        tender
                                                                                                                         12 %
                                                                                                                                  Bi-lateral
                                                                                                                                    28 %

  Backlog                                                                              Europe and             Project
                                                                                                              tender
  286 MW                                                                               Central Asia            32 %
                                                                                    410 MW (-60 MW)
                                                                                                                                  FiT
                                                                                                                                 28 %

                                                                                  Africa          Southeast Asia
                                                                                2,280 MW      1,340 MW (+516 MW)
   Pipeline                                                                    (+174 MW)
                                    Latin America
  4,850 MW
                                  880 MW (+47 MW)
  (+677 MW)

              All figures are as per reporting date for second quarter 2019.                                                                   9
Scatec Solar is securing a major market position in Vietnam

Our approach:
• Active in Vietnam since 2017 - working with local partners
• Project finance expected from international development banks
• Invite reputable equity partners

Our project portfolio:
• Backlog: 108 MW + Pipeline: 750 MW
• Includes both land based and floating solar
• Target construction start in 2020
• Significant additional opportunities

                                                                  Image: China/Newscom

                                                                                         10
We have advanced into a top 10 global independent solar PV developer
MW, operational and under development
0 2,000 4,000 6,000 8,000 10,000 12,000 14,000
Asia Pacific
GCL New Energy Europe
First Solar Latin America
Canadian Solar Upstream Middle East and North Africa
North America
Total (SunPower and Eren) Sub-Saharan Africa
SunEdison
EDF
Engie
Enel Green Power
Direct peers
Equis
Enerparc
Scatec Solar
• Top 10 global utility-scale solar developer
• A broad portfolio across emerging markets
Adani
Marubeni
Lightsource
Neoen
Source: GTM Research 11Our success is based on our integrated business model combined
with a strong entrepreneurial culture
Business model People
• Fully integrated • Agile and lean
• Structuring and financing • Entrepreneurial culture
• Financial discipline • Passionate and empowered people
• Partnerships • Strong talent bench
Predictable Working together Driving results Changemakers
12The Solar Market
Demand for solar is growing significantly across emerging markets

Multiple governmental drivers for solar PV demand   Annual global solar PV demand forecast - GW

                                                       Rest of Asia                   Latin America       India
                                                       MENA                           USA                 Europe
                      Time-to-
                       market                          Sub-Saharan Africa             China               Rest of World
        Climate                                                                                                                  130
                                                                                                                          127
         treaty                     Cost of                                                               117
       & national                   energy                                                  105
         action
         plans
                       Main
                                                                          75
                      drivers
       Employment                   Energy
      and economic                 security             45
         growth
                         More
                        foreign
                     investments
                                                      2014               2016               2018          2019            2020   2021
                                                     Source: BloombergNEF Q1 2019 conservative forecast                                 14
Solar is one of the world’s most competitive sources of energy
Cost of alternative energy sources (LCOE, USD/MWh)
• The levelized cost of solar has come down 83%
since 2010 – industry scale and technology
• Solar is now the lowest cost source of energy across 250
the sun-rich regions globally
200
• Storage and hybrid solutions are expected to
become increasingly important for demand
150
• New business propositions are emerging when
solar is cost competitive with base load
100
50
0
Solar PV Wind Gas base Coal Gas peak Nuclear Diesel
load load
Source: Lazard Capital, LCOE v12, Scatec Solar 15A solid business case for corporates sourcing solar across emerging markets
Cost of electricity for corporates in emerging markets
LCOE, USD/MWh
250
200
150
100
50
0
Solar on On-grid Power – Off-grid Diesel –
20 yr contracts unreliable and blackouts high opex and logistics
Source: Lazard Capital, Scatec Solar 16A large potential to replace diesel and oil based power generation globally
• Total installed capacity of more than 500 GW of
diesel and heavy fuel oil gen sets globally
• Annual installations of more than 35 GW in emerging
markets
• Installed base of more than 250 GW in Africa
• More than 10 GW new capacity installed annually
• Significant potential in Africa, Southeast Asia,
Middle-East and Latin America
Source: Bloomberg New Energy Finance, Scatec Solar analysis. 17Business model
Scatec Solar’s value chain
We develop, build, own & operate solar plants for 20 years

Project development                    Financing                 Construction                  Operations
                                                                                                                        Ownership (IPP)
• Site development &          • Debt/Equity structuring   • Engineering and           • Maximize performance and   • Asset management
  permitting                                                procurement                 availability
                              • Due diligence                                                                      • Financial optimization
• System design                                           • Construction management   • Maintenance and repair
• Business case development
• PPA negotiation

                                                                                                                                              19
Scatec Solar is partnering with Governments and Development banks
• As cost of solar continues to decline - governments are looking
to solar to cover their power needs and grow the economy
• Governments in emerging economies finds private/public
partnerships very attractive implementation model (IPPs)
• Multilateral development banks typically with a long standing
presence and experience in the county
• Project structures and contracts designed to mitigate risk
(political financial, compliance etc)
Creates business opportunities and
Reduces risks of Scatec Solar’s investments
20Our business model and typical project structure
Simplified illustration of company structure and main contracts in place
Equity co-
Scatec Solar
investors
100% 39%-100%
Shareholders agreement
Component
Land lease Land owners
Suppliers
agreements
Scatec Solar Single Purpose
O&M / EPC • EPC contract Vehicle Loan agreements
• O&M contract Project financing
Sub-Contractors • Asset Management
contract PPA
agreement
• Sovereign guarantee
• Concession
• Political risk agreement
insurance (when State owned
relevant) utility
World State
Bank/others governmentA business model enabling «self funded» growth
• All projects enters 20-25 year PPAs with fixed tariffs
with state owned utilities
75
(75%)
100 • The power plants are financed with non-recourse
USDm
(100%) debt, and the PPAs allows Scatec Solar to operate
with high financial leverage at project level
13 • The D&C gross margin covers a large part of the
(12.5%) Scatec Solar’s equity contribution in the project
13 13
(12.5%) (12.5%)
Total capex Debt Financing Partner’s D&C margin SSO equity
equity share
100 MW project expample
22Stable project cash flows based on PPAs - allowing for a non-recourse debt structure
Managing financial risk
Power price &
Counterparty Interest rate Currency
volume
• Tariffs fixed for 20-25 • PPAs with state owned • Project finance debt with • Structuring of project debt in
years utilities with government fixed interest of 10 years or same currency as power sales
guarantees more from grid connection revenues
• Take or pay all volume
produced • Financing partners with • Inflation adjusted tariffs in PPA
strong government relations
• Political risk insurance or
equivalent in selected
markets
PPA: Power purchase agreement
23Scatec Solar utilises new technology to improve power plant performance
Bi-facial solar modules, Egypt Global control & monitoring centre, Cape Town
• The world’s largest solar park with bi-facial modules • Real-time data from all plants globally 24/7
• 390 MW / 870 GWh annual production • Improving operational quality and efficiency
• Test station established on site • Increasing uptime and production yield
24There is a significant value of solar power plants post Power Purchase Agreements
Post PPA value:
• Power Purchase Agreements of 20-25 years
• Technical life of solar plants of 35+ years
• Scatec Solar have secured land rights for 35+ years
• Market power prices are expected continue to
increase – especially across emerging markets
• After 20 years the marginal cost of solar power
production is very limited
• Fully depreciated and debt free plants
• No fuel cost
• Limited cost of operation & maintenance
The 40 MW Linde plant in South Africa.
25Sustainability is an integrated part of our business
Sustainability is;
• Project risk mitigation and value creation
• Local engagement and strong community relations
• Facilitating strong partnerships (project and group level)
• A competitive advantage if done well
26Financials
Growth across all business segments – set to continue

                                                                              Proportionate financials - last 12 months (NOK million)
 • A stable D&C business                                                            Revenues                                    EBITDA                               Cash flow to Equity*
  • Half of proportionate EBITDA                                                                             6,101

  • Stable margins - within guidance
 • Growing power production
  • 1.9 GW in operation & under construction
  • Long term cash flows secured                                                                 3,170                                               1,289

  • Average 19 years remaining PPA tenor of                                                                                               981
    plants in operation                                                                                                                                                                  700

 • O&M – securing stable operations                                                                                          380                                              396
                                                                                      673
                                                                                                                                                                    78

                                                                                    Q2 17        Q2 18       Q2 19          Q2 17       Q2 18        Q2 19        Q2 17      Q2 18       Q2 19

              *Cash flow to equity is defined as EBITDA less normalised (i.e. average o over each calendar year) loan and net interest repayments less normalised income tax payments.           28
               The definition implies changes in net working capital and investing activities are excluded from the figure.
Q2’19:
Record results – EBITDA up 46% year on year
Proportionate revenues by segment (NOK million) Proportionate EBITDA by segment (NOK million)
Corporate Power Production
1,666 1,648
Development & Construction Operations & Maintenance
180 1,528
272
208
1,229 1,259
388
150 155
329 315
266 257
139 221
1,466 168
1,297 1,339
1,077 121 127
1,045
202
140 130 159 165
Q2 18 Q3 18 Q4 18 Q1 19 Q2 19 Q2 18 Q3 18 Q4 18 Q1 19 Q2 19
29A solid financial position
Consolidated financial position (NOK million)
• Group free cash of NOK 560 million As of 31.12.2018 As of 30.06.2019
• Undrawn Revolving Credit Facility at NOK 775 million 14,857 14,857 17,492 17,492
• Group* book equity strengthened to NOK 3,318 2 123
million – equity ratio of 82% 4 681
2 410
10,647 2 475
10,647
4 442
1 800
NOK million Consolidated SSO prop. Share Group level*
Cash 2,375 1,743 560
12 811 12 959
Interest bearing 10 415 10 583
liabilities* -11,742 -7,747 -744
Net debt -9,367 -6,005 -184
Assets Equity & Liabilities Assets Equity & Liabilities
Current assets Non-current assets Equity Current liabilities Non-current liabilities
* Defined as ‘recourse group’ in the corporate bond and loan agreements
30Q2’19 movement of free cash at group level
NOK million Ukraine
11 -18
130
29
785 -264 Net working capital
construction projects
-10
-108 560
5
Development of
project backlog
and pipeline
End Q1 Distributions Cash flow to Cash flow to Cash flow to Project equity Project Dividend to ASA Working End Q2
from operating equity D&C equity O&M equity Corporate Development shareholders Capital/other
power plants capex
Movement of cash in ‘recourse group’ as defined in the corporate bond and loan agreements. 31Our principles for investments and financing
Transactional and operational control
- SSO the lead developer and investor
D&C margins
- key contribution to equity positions
Working capital
- managed through project structuring
Moderate debt at group level
- reflecting debt capacity of long term cash flows
Dividends
- 50% of free cash flow from operating power plants
32Outlook and guidance
Short term guidance

• 2019 O&M revenues of NOK 110-120 million with
  an EBITDA margin of around 30%
• D&C value for 993 MW under construction: NOK 5.3 billion
 • Remaining NOK 2.9 billion value to be recognised
• Power production from plants in operation end Q2:

   GWh                 Q2’19      Q3’19e              2019e
   Proportionate         198      260-285        800-850
   100% basis            346      460-490     1,450-1,650

                                                              34
New investments generate significant value from D&C and Power Production
Key figures – NOK million 1.9 GW in operation & 1.6 GW new Total 3.5 GW by
under construction capacity towards 2021 end 2021
SSO’s economic interest 63% 50% – 70% 50% – 70%
Capex , 100% 20,700 13,000 – 15,000 34,000 – 36,000
SSO’s equity investments 3,900* 1,300 – 1,900 5,200 – 5,800
Development & Construction – after tax margin 1,050 – 1,150 1,300 – 1,900 2,000 – 2,500
Annual cash flow to equity - Power Production & O&M 550 – 600 200 – 250 750 – 850
(*) About NOK 400 million remains to be invested. Based on equity financing of the Los Prados project. Figures in the table above are estimates. 35Our 3.5 GW target: Stay selective and focus on value creation
Realizing
D&C contribution of NOK 2.0 – 2.5 billion
3.5 GW Annual cash flow from operating solar plants
capacity
of NOK 750 – 850 million
Value of NOK D&C gross margin; 12-15%
1.5 mill.
per MW Equity IRR on power plant investments; 15%
Continued strong focus on HSSE and
sustainability throughout all project phases
36Further enhancing our emerging market footprint
• Technology improvements and cost reductions
continues to drive demand
• We are strengthening our market position and
expanding into new countries
• A well-proven business model with a present
execution capacity of 800-1,200 MW per year
• Capital Markets Update 18 September 2019:
- Expanding our platform for increased growth
The 75 MW Kalkbult solar plant, South Africa.Our asset portfolio – July 2019
In operation: Under construction: Project backlog:
CAPACITY ECONOMIC CAPACITY ECONOMIC CAPACITY ECONOMIC
MW INTEREST MW INTEREST MW INTEREST
Malaysia: Gurun, Jasin, Ukraine: Rengy, Kamianka, Vietnam 108 65%
Merchang 197 100% Progressovka, Chigirin, Boguslav 336 89% Ukraine 65 65%
Egypt: Benban 195 51% South Africa: Upington 258 46% Bangladesh 62 65%
South Africa: R1 & R2 190 45% Egypt: Benban 195 51% Mali 33 51%
Brazil: Apodi Solar 162 44% Argentina: Guañizuil 117 50% Honduras 18 70%
Honduras: Agua Fria, Los Malaysia: Redsol 47 100% Total 286 64%
Prados I 95 51% Total 953 66%
Jordan: EJRE/GLAE, Oryx 43 59%
Mozambique: Mocuba 40 53%
Czech Republic 20 100%
Rwanda: Asyv 9 54%
Total 951 60%
39You can also read