Energy on the SWIS by 2021 - Transition from coal to renewable Presentation to Liberal Member for Kalamunda John Day Ben Rose Len Bunn Angus King
←
→
Page content transcription
If your browser does not render page correctly, please read the page content below

Transition from coal to renewable
  energy on the SWIS by 2021
       Presentation to Liberal
       Member for Kalamunda
       John Day
       Ben Rose
       Len Bunn
       Angus King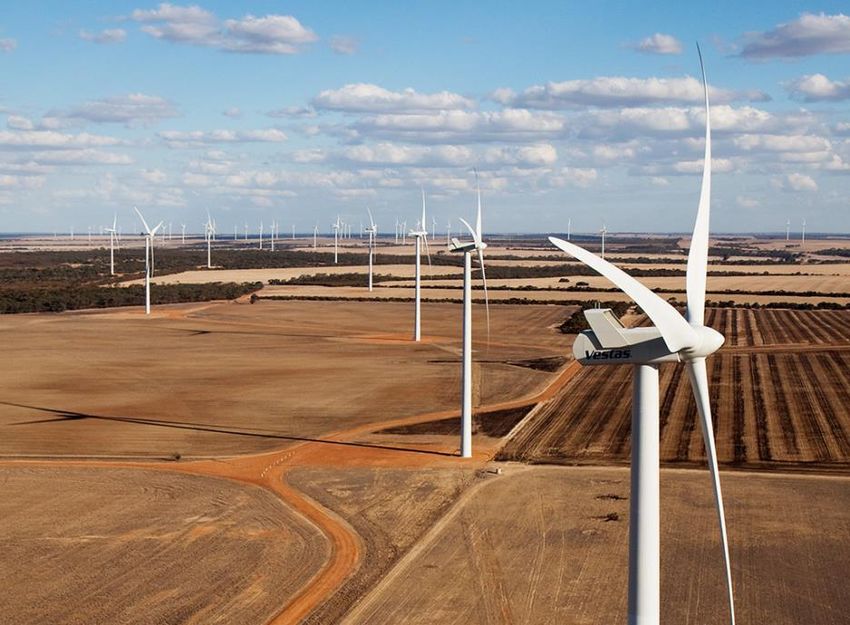
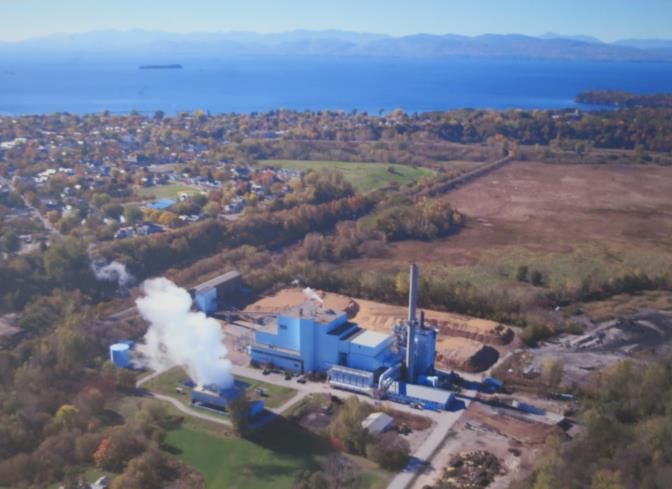
WA electricity generation now = 1960’s Holden
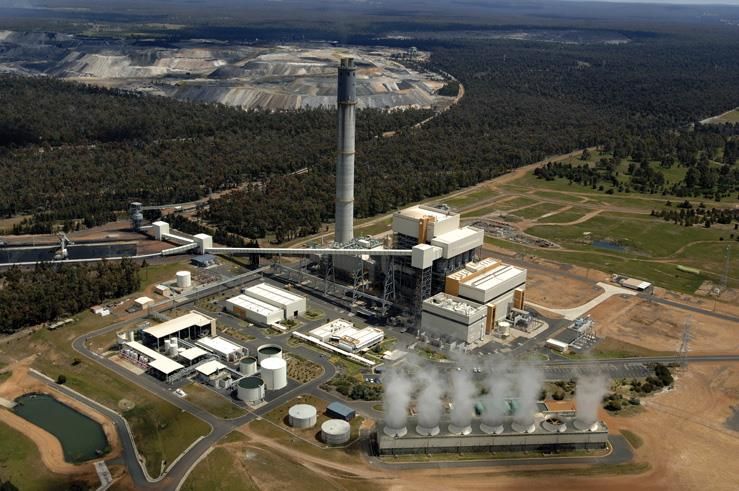
WA’s aging coal power stations on the SWIS are due
for replacement
         COAL-FUELLED       Owner     Yr built   Retire   Retmt age, MW
          GENERATORS                                         yrs     capacity

MUJA AB (G1, G2, G3, G4)   Synergy     1965      2016        51            220

Muja C (G5, G6)            Synergy     1981      2017        36            385

Muja D G7, G8)             Synergy     1985      2019        34            422

Collie                     Synergy     1990      2019        29            317

Bluewaters 1               Sumitomo    2009      2029        20            217

Bluewaters 2               Sumitomo    2009      2030        21            217

(note: Bluewaters could be closed in 2030 aged 21 years)
Key Messages
1. WA’s aged coal power stations are due for
   replacement with new clean generation

2. Replacing all coal on the SWIS with Wind
   and PV (while retaining existing gas
   generation) will be cheaper than ‘clean”
   (‘super critical’) coal and much cheaper
   than either coal with CCS or nuclear

3. This would provide many thousands of new
jobs (in excess of existing coal and coal
Other messages
1. Retiring all coal and replacing it with wind and solar PV
   generation will reduce the carbon emissions from
   electricity by 63%.

2. Muja ABCD and Collie power stations can be retired by
   2021, reducing SWIS electricity emissions by 50%

3. When the current 20% RET is taken into account,
   retiring of all old coal would increase LCOE by about
   1.4 c per kWh or 14%. This equates to 5% increase in
   retail tariff (less than $100 per year).

4. 91% reduction in emissions is feasible by 2030 by
   adding storage and some more bio-fuelled OCGT
   capacity (future industry for Collie)
                                                               10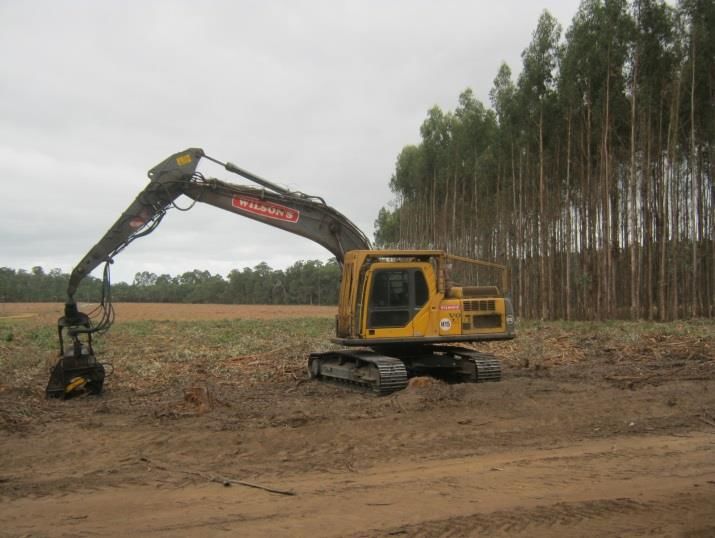
WA clean renewable electricity by 2021 =
New Tesla EV – for the same price as a new Holden
WHAT COULD THE TRANSITION TO CLEAN
     ENERGY LOOK LIKE?
• For WA: Increase RE capacity from about 1100 MW (14% of
  generation) to 4200 MW (50% of generation)
• Approximately 40 – 60% of this needs to be wind
  (depending on the relative costs of wind and PV)

• Enormous economic benefits for the WA economy:
    • Several thousand new jobs in construction and
      manufacturing; several hundred net new permanent
      jobs
    • $ 7.1 billion of private investment in wind and PV plus
      $1 billion in new transmission lines.

• Muja ABCD and Collie power stations retired, reducing SWIS
  CO2 emission by 50% or 6.2 million tonnes / year
An energy jobs revolution 1300 new permanent jobs (600 more than currently in coal) 6,500 construction and manufacturing jobs for 5 years Cleaner energy • CO2 emissions reduced by 50%, 6.2 million tonnes per year 3 tonnes per head of people in WA (each person taking a car off the road)
Jobs in WA created by new wind and solar generation
replacing Muja ABCD and Collie power stations
NEW JOBS FOR WESTERN AUSTRALIA
O&M Manf.
C & I (job Capacit Gen. Manufact-
Technology (job (job C&I O&M
years) y (MW) (GWh) uring
years) years)
Roof-top PV 13 0.7 6.7 500 6,500 3,350 350
Utility scale Solar PV 13 0.7 6.7 400 5200 2,680 280
Wind Farm 3.2 0.3 4.7 2,300 7,360 10,810 690
Biomass Facility 14 1.5 2.9 400 5,600 1,160 600
Transmission (734 km,
7,300
$0.95 billion) **
Minus permanent jobs
lost from closing 1350 n/a 0.14 n/a -1,300 n/a n/a -672
MW of coal*
TOTALS (JOB YEARS) 31,960 16,840
TOTAL (NET FULL TIME
6392 1200 1,249
JOBS in WA)
(for 5 (for 5 (perm-
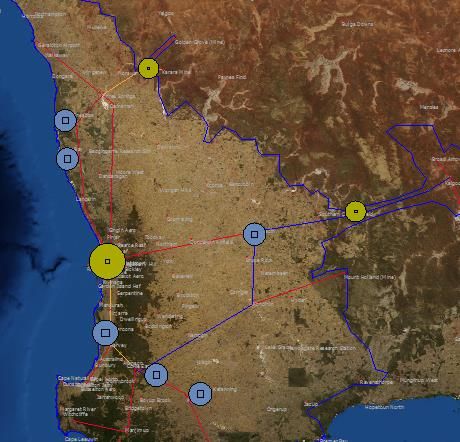
years) years) anent)Map of Wind and PV installation to replace coal (modelled in SIREN)
Collgar Wind Farm is a $750 million renewable energy
project consisting of 111 wind turbines located approximately
25km south east of Merredin in Western Australia, with a
generation capacity of 206 Megawatts.

During the construction phase, Collgar employed up to 150
people over a period of two years…….

Ongoing employment for a team of 10-20 locally
based staff. http://www.collgarwindfarm.com.au/

Landholders are paid $4,000 to $8,000 per turbine, $3,000 to
$4,000 per megawatt of capacity, or 2-4% of gross revenues.
http://www.windustry.org/how_much_do_farmers_get_paid_t
o_host_wind_turbines

Australian owned – by two superannuation funds
SEN’s costing assumptions. LCOE is levelized cost of electricity
                                                                                 Recent Power
                              Conservative                                       Purchase Agreement
                              LCOE's                Reference                    prices,
 Wind                                 $85             BREE 2014 est. for                   $77
                                                             2025
 PV, rooftop                          $65
                                                       Solar Choice, 2016
 PV, fixed, utility                   $110             BREE 2014 est. for                  $40
                                                              2025
 CST with 6 hrs storage               $165             BREE 2014 est. for                $140
                                                            2025
 ‘Behind meter’ Battery               $40
                                                    nominal subsidy = SRET
                                                      BREE 2014 est. for
 Coal                                 $100
                                                             2025
                                                      BREE 2014 est. for
 Nuclear (SMR)                        $159
                                                             2025

* 20 year fixed PPA for Hornsdale Stage 2 Wind Farm (Renew Economy, 23-8-2016)

** http://reneweconomy.com.au/2016/12-large-scale-solar-projects-to-get-arena-funding-and-the-winners-
Renewable energy grids are reliable Frequency stability response to load fluctuations for a 100% RE grid can be provided by: 1. Dispatchable synchronous generators (OCGT, CCGT, steam or diesel) provide frequency stability as for traditional fuelled grids. 2. OCGT’s running in isochronous mode can provide stability in the same way. 3. Modern battery systems - dedicated on-grid bi- directional inverter connected batteries – can provide even faster stabilizing response.
Open Cycle Gas
                                             Turbines
                                           5- 15% of energy

                                       • Ramp from cold start
                                         to full load in 6 – 13
                                         minutes.
                                       • In Metro and industrial
• Energy cost $200 - $550 / MWh.
• Can use many fuels – gas, bio-oil,     areas.
  bio-ethanol, bio-gas.
                                       • 1 in 6 equipped to run as
                                         ‘synchronous
                                         compensators’.
Wind and PV generation is predictable in advance • Forecasting wind and solar is increasingly accurate. The Australian Wind Energy Forecasting System (AWEFS) provides accurate forecasts of wind generation • Down to 5 minutes in advance, for individual wind farms and regions. • Proven in practice world-wide to allow adequate time for dispatch of stored or fuelled energy to compensate for falling RE generation.
50% reduction in C    >90% reduction in
Existing       emissions           C emissions
 2016      achievable by 2021   achievable by 2030
Effect of residential and commercial PV on California’s
average daily electricity demand
People willing to pay more for Renewable Energy
     outnumber those who are not. (Newspoll, Oct 2016)

Percentage of        Amount per year   $/year increase in
households willing   (Newspoll, Oct    power bill at average
to pay               2016)             consumption           c/kWh increase
        28%                $100                 $99                 1.7
                                               $116                  2
                                               $175                  3
                                               $233                  4
        11%                $300                $291                  5
                                               $349                  6
                                               $407                  7
     4%             $500                       $465                  8
     2%             $1000                      $524                 17
PERCENTAGE WILLING TO PAY
MORE                                           45%
PERCENTAGE NOT WILLING TO PAY
MORE                                           44%
Transitioning
WA needs a
RENEWABLE ENERGY
TRANSITION Planning
Agency.
$85 MWh
Generates at nightGovernment policies for clean energy 1. WA State renewable electricity (RE) target > 85% by 2030 and develop a detailed transition plan. 2. Enact an Office of Renewable Energy, to plan transition to RE. 3. Phase out all existing coal and base load gas generation, replacing it with RE capacity, according to a master plan 4. Plan, locate and commence installation of large utility scale storage 5. Convert all consumers’ meters to standardised smart meters. with both user and utility interface capability 6. Design and implement tariff structures and or subsidies that incentivise the uptake of energy storage with rooftop PV on premises. 7. Plan and establish commercial-scale production of sustainable renewable fuels using cheap surplus RE and or biomass, for example: hydrogen from electro – hydrolysis; liquid bio-fuels; electro-chemical production of energy 8. Identify, incentivise and implement innovative energy use optimisation strategies e.g. shifting large industrial loads from winter to summer months 9. Energy market reform - to facilitate wider adoption of power purchase agreements (PPAs) by reverse auctions. Federal (Government through the AEMO) 10.Retain WA Government and control of Western Power to facilitate optimal transition to a renewable electricity system. 11.Commercial-scale sustainable woody biomass (oil mallee) production on farms
Energy revolution opportunity is now…….

-    Cost of capital has never been lower.
-    State is in a jobs recession
-    State election a chance for parties to
     commit to a just transition
1 Siren
2 PB
data
8760 hr
3 PowerbalanceMore slides including costing tables – SWIS transition
Annualized cost of transmission for 4300 MW of dispersed wind and PV , replacing all
coal, is < $3/MWh, i.e. 0.3c /KWh (with interest on capital 6% /30yrs)
                             Power   Maximum
Scenario: RE Equiv. C station        capacity (MW) Line type                                 Main line        Connector
to CCS Retrofit              peak    of main        (kV, single                Cost of       distance to distance to LINE + END
Name of power station power          transmission (s) or          Cost per     End           be costed        be costed STATION
or transmission line         (MW)    line*          double (d)    km           Stations      (km)             (km)      COSTS
      Kojonup Wind               400                     330s      $1,000,000 $8,000,000           n/a              0      $8,000,000
      Collie E Wind              400                     330s      $1,000,000 $8,000,000           n/a             20     $28,000,000
         Kojonup to Collie line             500          330s      $1,000,000 $8,000,000          111              n/a   $119,000,000
       Harvey Wind               500                     330s      $1,000,000 $8,000,000           n/a             10     $18,000,000
          Collie to Perth line             1000          330d          $0           $0      0 (existing line)      n/a         0
        Karara PV                250                     330s      $1,000,000 $8,000,000           n/a             10     $18,000,000
     Eneabba Wind                400                     330s      $1,000,000 $8,000,000           n/a             20     $28,000,000
     Cervantes Wind              400                     330s      $1,000,000 $8,000,000           n/a             40     $48,000,000
      Three Springs to Perth line          1000          330d      $1,500,000       $0            275              n/a   $412,500,000
     Merredin Wind               500                     330s      $1,000,000 $8,000,000           n/a             20     $28,000,000
   Southern Cross PV             250                     330s      $1,000,000 $8,000,000           n/a              0      $8,000,000
     Southern Cross to Perth line           500          330s      $1,000,000 $8,000,000          228              n/a   $236,000,000
Metro PV                        1200        n/a           n/a          n/a          n/a             0              n/a         0
 MW of utility scale wind and PV using new transmission lines            3,100
                                                                             Total cost of new lines plus sub-stations    $951,500,000
       MW of Rooftop PV not requring new transmission lines               1200      Total transmission line kilometres               734
                                                                                            Annualized cost per MWh $              2.93

  * A '5/8' rule is applied: Transmission line capacity need only be 5/8th of the maximum
  capacity of all generation feeding into it. This is because it is assumed that power exceeding
  5/8th of maximum will be curtailed (this amounts to less than 4% of total energy generated).
  For example, wind or solar power stations totalling 800 MW capacity can feed into a
  transmission line with only 500 MW of capacity.
 Note: 1000 MW of PV in metro area not included as no transmission needed
32
Synergy plan for Carbon Capture and Storage
             (CCS) for Collie coal plant
SEN’s modelling shows:
•  CCS retrofit of old plants will cost about the same as the Wind –
   PV option. (LCOE $106/MWh compared to $109)
•  With current RET the LCOE of CCS retrofit option is higher than
   Wind-PV ($113 compared to $94)
•  Increased maintenance of old plants would inevitably push the
   LCOE higher.

•    New coal – CCS plants are not cost effective – LCOE
     $133/MWh or $136 with RET.
•    Coal CCS is not yet ‘stand alone commercial’ on power stations;
     high technical and social risks and the energy is not renewable.
•    Less popular politically and foregoes the higher employment
     opportunities of wind and PV.
Carbon Capture and Storage
(CCS)
– Canada’s experience
“When the coal-fired 140 megawatt (MW) Boundary Dam
power station with a CCS plant was officially opened in
early October 2014 ……it was touted as the world’s first
“commercial scale” CCS plant……..”
“In the last two weeks, SaskPower’s carefully-crafted
illusion of the CCS plant as a success story has been
shattered by revelations in a series of leaked internal
documents. Instead of capturing 90 per cent of the carbon
dioxide from the power station, the plant has captured
about half that amount or less. Problems with the plant
have meant that it has often been shut down.”
http://reneweconomy.com.au/2015/the-fallout-from-saskpowers-boundary-
dam-ccs-debacle-54803PV now less than AU$35/MWh In September 2016 Marubeni and Jinko Solar won a reverse auction to build a 350 MW solar plant in Abu Dhabi with a price of $US24.20/MWh ($A32.11/MWh) The Marubeni-Jinko Solar bid is now the world’s lowest, the previous low being $US29.10/MWh for a solar plant in Chile The other bids for the Abu Dhabi project were: $US 25.90/MWh from Tenaga and Phelan Energy $US 29.10/MWh from RWE/Belectric $US 30.80/MWh from JGC, First Solar and Sojitz $US 36.30/MWh from Kepco, Q Cells and GSE The cost of solar PV in the UAE is currently around one third of the price of gas generation Deploying solar enables the UAE to export higher volumes of natural gas Ref:http://reneweconomy.com.au/2016/how-the-jaw-dropping-fall-in- solar-prices-will-change-energy-markets-55160
LCOE of Wind generation is falling
The 100MW Hornsdale wind project…… has achieved Australia’s lowest
known contract price for renewables at $77/MWh.

Ref: http://reneweconomy.com.au/2015/sa-wind-farm-delivers-cheapest-wind-energy-
ever-procured-in-australia-68843

                                                                Ref: Wiser et all,
                                                                2016, Berkeley Lab,
                                                                NREL, IEA
How did SEN model and cost scenarios for transition to Renewable Electricity? By using SIREN and POWERBALANCE • PowerBalance is a set of programmed Excel spreadsheet templates for scenario types. • A tool with which users can quantify and cost dispatchable energy generation, storage and CO2 emissions. • Balances power with load for 8760 hours of a year. • Provides balanced, costed RE scenarios.
Energy shortfalls: >90% Renewable Energy with battery and pumped hydro storage
Area below zero line to green line is fuelled generation

                                                              39
Energy shortfalls: >90% Renewable Energy with battery and pumped hydro storage Area below zero line to green line is fuelled generation • To provide enough energy for all shortfall periods during winter, storage would have to be increased 100-fold, increasing LCOE to >$500/ MWh. • OCGT’s are the most cost effective generation to cover periods of low40wind and sun.
STORAGE
Economic to store 5 – 15% of the cheap
  renewable energy for use at night

‘Behind the Meter’ Batteries

                  Concentrating Solar Thermal
                   with Molten Salt Storage

    Pumped Ocean
       Hydro
What might a modern renewable electricity generation
system for WA look like? One scenario achievable by
2030:
Percent renewable energy 91.0% - 100%
CO2e million tonnes; 1.32
CO2 % of BAU 9.88%*
% of total annual LCOE $/MWh
LCOE $/MWh MW power MWh storage
Energy source grid energy (BREE AETA
(likely 2020) capacity capacity
demand 2025)
Wind 59.3% $85 $77 5800 n/a
PV 17.6% $80 $75 2400 n/a
(Surplus Wind and PV) 17.1%
CST 5.4% $165 $140 500 7000
BM Battery 1.4% $40 $40 n/a 2000
PHS 0.0% $0 $0 0 0
Biomass / MS (at Collie) 7.4% $249 $249
400 6400
OCGT 9.0% $219 $219 2200 n/a
Weighted average LCoE ($/MWh) Plus
$137 $128 transmission
with zero C price, zero RET
$6-7/ MWh
*Assuming OCGT’s are still fuelled by natural gas. If the OCGT’s
used renewable fuels, C emission reduction could bePossible future biomass industries for
Collie
Possible in the longer term (10 years)
Biomass power generation
Wood pellet export industry;
Oil mallee biomass production on farms in the 400- 600 mm
southern agricultural region
Rail connecting Collie / Bunbury port to Wagin / Katanning
for transportation of biomass and other agricultural productsBiomass thermal power generation with Molten Salt storage. Up to
400 MW could be located at Collie (using plantation and waste biomass
only)
50 MW McNeil Biomass
Power station Vermont, US
Molten salt tank
at 110 MW
Concentrating
Solar Thermal
power station in
NevadaWA Biomass resources (Mt = million dry tonnes)
Biomass from Oil Mallee “Alleys” on
10 % of dryland farms 3.6 Mt
10% of the Gt Southern Region alone
would produce enough (1.2 Mt) to
generate 10% of projected 2029
electricity demand.
Note: need to legislate no biomass harvest
from state forests
Wood waste - pine and blue gum
plantations, and municipal
combustible waste – >1 Mt
Cereal straw – up to 1
Mt (wheat belt )Oil mallee - a coppicing crop for biomass energy:
electricity generation and wood pellets for export
120 -140 km of new rail
Collie to Wagin or
Katanning. Cost $360 –
400 million. To transport
1.2 million tonnes* of
woodchips for a 400 MW
power station plus 0.2
million tonnes for wood
pellet exports. (*seven
5,000 tonne trains per
day)
Harvester cuts coppiced
trees at ground level, chops
biomass to size, and chutes it
into a mobile hopper, which
conveys it to road trucks.
(Photo: courtesy John Bartle)Coal phase-out to 100% renewable energy for the SWIS:
Percentage of total electricity generation by Technology
Overbuild Overbuild Overbuild
Wind, PV;Wind, PV; Wind, PV;
Close Overbuild behind biomass CST and
Muja Close Muja No coal Wind, PV the & MS biomass
ABCD ABCD and power, no Max. meter storage; with
power Collie storage, economic battery pumped molten
BAU stations power increase without storage, hydro salt
existing ( stations (C Wind, PV storage (C=16.9% storage, storage,
(C=100% ) C=71.6%) = 56.4%) (C=38.7%) (C=23.9%) ) (C=9%) (C=9%)
Technology Percentage of total electricity generation
Coal 41.8% 26.3% 15.3% 0.0% 0.0% 0.0% 0.0% 0.0%
CCGT 40.1% 36.4% 39.4% 34.9% 0.0% 0.0% 0.0% 0.0%
OCGT 5.9% 4.9% 5.5% 17.1% 27.3% 11.4% 9.0% 9.0%
PV 5.6% 10.6% 15.2% 17.2% 21.1% 22.5% 20.2% 17.6%
Wind 6.8% 21.8% 24.7% 30.8% 51.6% 62.3% 58.3% 59.3%
Biomass/ MS 0.0% 0.0% 0.0% 0.0% 0.0% 0.0% 7.5% 7.4%
CST/MS 0.0% 0.0% 0.0% 0.0% 0.0% 0.0% 0.0% 5.4%
PHS 0.0% 0.0% 0.0% 0.0% 0.0% 0.0% 3.3% 0.0%
BM Battery 0.0% 0.0% 0.0% 0.0% 0.0% 3.7% 1.7% 1.4%
total 100.2% 100.0% 100.0% 100.0% 100.0% 100.0% 100.0% 100.0%Summary of modelled carbon capture and storage (CCS) scenarios for
the SWIS, compared with renewable energy scenario
Percentage of total electricity generation
No coal, no storage,
Close Muja AB; CCS Close Muja AB; New coal increase Wind, PV
retrofit (C=40.9%)) CCS (C=40%) (C=38.7%)
Coal 41.9% 40.3% 0.0%
CCGT 40.3% 41.9% 34.9%
OCGT 5.6% 5.6% 17.1%
PV 5.6% 5.6% 17.2%
Wind 6.8% 6.8% 30.8%
Biomass/ MS 0.0% 0.0% 0.0%
CST/MS 0.0% 0.0% 0.0%
PHS 0.0% 0.0% 0.0%
BM Battery 0.0% 0.0% 0.0%
total 100.3% 100.2% 100.0%
Weighted average LCOE of scenarios
LCOE with Zero C price and zero RET $106 $132 $109
LCOE with $30 C price $113 $140 $116
LCOE with 20% RET target; $55 LGC
$113 $140 $98
price, excess LGC's sold
LCOE with RET as above; current $113 $140 $94
PPA's for wind, PV in AustraliaWA Carbon emissions by sector:
WA carbon emissions %
Agriculture forestry and
fishing 6.9%
5.6% 15.3%
Mining
5.7%
Manufacturing
Electricity gas and
water 20.1%
Commercial Services
and construction 27.5%
Transport and storage
Residential 18.9%You can also read