Net zero emissions zero pollution - 2nd of June 10 to 11.30 (CET) - LOCOMOTION | H2020
←
→
Page content transcription
If your browser does not render page correctly, please read the page content below
Net zero emissions
 ≠ zero pollution
 2nd of June 10 to 11.30 (CET)
Agenda
10:00 – 10:10: Welcome and introduction to LOCOMOTION
• Katy Wiese (Associate Policy Officer for Economic Transition, European Environmental Bureau)
10:10 – 10:20: Keynote: The hidden material costs of green technologies
• Iñigo Capellán Pérez, Post-doctoral Researcher, University of Valladolid)
10:20 – 10:30: Presentation of alternatives for simulation
• Iñigo Capellán Pérez (Post-doctoral Researcher, University of Valladolid)
10:30 – 10:45: Presentation of results of modelling exercise
• David Alvarez Antelo (Doctoral Researcher, University of Valladolid
10:45 – 11:10: The hidden social and environmental costs and limitations of the EU energy transition
• Marga Mediavilla (Professor, University of Valladolid) on the hidden environmental cost of electric cars
• Dirk-Jan Van de Ven (Postdoctoral Researcher, BC3 Basque Centre for Climate Change) on the hidden land costs of solar energy
• Diego Marin (Assistant Environmental Justice, European Environmental Bureau) on recommendations to address the hidden social and environmental
 costs of the energy transition
11:10-11:25: Q and A
• Katy Wiese (Associate Policy Officer for Economic Transition, European Environmental Bureau)
11:25-11:30: Closing and farewell

 2
Doing the locomotion
LOCOMOTION is developing sophisticated models and tools to assess the socioeconomic
and environmental impact of different policy options in order to help society make
informed decisions about the transition to a sustainable, low-carbon future.n

LOCOMOTION’s models will assess:
• The European Green Deal
• The transition to climate neutrality by 2050
• The effects of pandemics
• And much more

 A future in modelling 3
Introducing WILIAM
WILIAM stands for Within Limit Integrated Assessment Model. It is
made up of several interrelated models.
• Economy and finance
• Renewable and non-renewable energy
• Raw materials
• Energy infrastructure and technologies
• Environment
• Climate change
• Population and society

 A future in modelling 4
Keynote:
 The hidden material costs
 of green technologies

Low-carbon society:
An enhanced modelling tool for the transition to sustainability

 EU Green Week, 02/05/2021
 Iñigo Capellán-Pérez
 GEEDS-UVa (https://geeds.eu)

 This project has received funding from
 the European Union’s Horizon 2020 research and innovation
 programme under grant agreement No 821105.
Material requirements of green technologies
• Renewables power plants are made of non-renewable materials!
• RES-based system: higher material requirements (& diversity) than fossil fuel-based system

 2nd Law Thermodynamics:
 Concentrating necessarily implies inefficiency; and
 concentrating a lot implies a lot of inefficiency

 Variability management of renewables
 Zappa et al 2019, Applied Energy

 Smil 2015 “Power density”

 6
Many questions arise:
• Which amount and of which materials will the transition to sustainable energy systems will require?
• How much of these materials could come from recycling or from mines? (→ recycling, circularity)
• How many materials will be demanded by the rest of the economy?
• Identification of potential “critical” materials (supply, economic importance)
• Identification of potential substitutions of these “critical” materials in energy technologies
• Where are the mines of these minerals? (→socio-ecological impacts, geopolitics)
• Where are they being recycled? (→ circularity, geopolitics, economy)

 2021

 2010

 2019
 7
 2019
Data and figures from published papers:

 8
Material requirements of wind
A 50 MW wind farm (*current sub technology mix*) with a lifetime of 20 years requires:

 Construction Operation
 kg kg
Steel 6305000
Iron (Fe) 1100000
Copper (Cu) 135000 5800
Aluminium (Al) 101500 10800
Nickel (Ni) 5550
Neodimium (Nd) 3050
Dysprosium (Dy) 243

 9
Material requirements of solar PV
60 MW photovoltaic solar plant (*current sub technology mix*) with a 20-year lifetime requires*:
 Construction Operation
 kg kg
 Iron (Fe) 9750000
 Aluminium (Al) 960000
 Copper (Cu) 132000
 Steel 120000
 Chromium (Cr) 33000
 Manganese (Mn) 30000
 Tin (Sn) 27780
 Nickel (Ni) 14100
 Zinc (Zn) 9750
 Magnesium (Mg) 3210
 Molibdenum
 (Mo) 3000
 Silver (Ag) 2802 48
 Lead (Pb) 1272
 Titanium (Ti) 375
 Cadmium (Cd) 366
 Telurium (Te) 282
 Indium (In) 270
 Vanadium (V) 28.5 10
 Galium (Ga) 18
Material requirements of electric batteries
Nissan Leaf MNO kg/MW LiMnO2 NMC-622 NMC-811 NCA LFP
 Aluminium 500 693 693 483 1478
 Copper 289 429 429 295 855
 Iron 0 0 0 0 765
 Lithium 34 71 60 31 96
 509 110 55 0 0 VW Passat NMC
 Manganese
 Nickel 0 335 412 192 0
 Cobalt 0 110 55 40 0
 0 0 0 0 425
 Phosphorus
 Graphite 310 405 405 272 825
 Plastics 515 705 705 345 1800
+chargers
 Tesla 5 NCA
 BYD K9 LFP

 Volvo NMC 11
Demand of the rest of the economy
• Rest of the economy? → regressions with historical data demand ∝ f(GDP)
• Example: Silver (Ag)

 12
Baseline scenario: Green Growth 100% renewables 2060

Global scenario (MEDEAS-W)
 + economic growth
 - Population growth
 + Renewables
 + Efficiency improvements
 + Transition to electric vehicles

 Current recycling rates recycled content (RC) kept constant
Outputs:
 Required minerals vs availability (“warnings”, no feedback on demand)

 13
Data from USGS: https://minerals.usgs.gov/minerals/pubs/mcs/

Reserves vs. resources

 14
Results
Primary demand increase for energy technologies vs total by 2060:

 tellurium
 indium
 lithium
 tin > +50%
 silver
 galium
 copper
 aluminium
 cadmium between +10 and +50%
 lead
 manganese
 molybdenum
 nickel
 chromium
 magnesium
 vanadium < +10%
 zinc

 15
Results

 16
Results

 17
Evolution of EROI of the system = 18
Potential of recycling?
 Current global recycling rates
 (recycled content)
Mineral (UNEP 2011)
Aluminium (Al) 35% Basic pre-requisites:
Cadmium (Cd) 50%
Chromium (Cr) 19% - Products designed to be recycled
Copper (Cu) 29%
Dysprosium (Dy) 0%
 - Recycling profitable
Galium (Ga) 38%
Indium (In) 38%
Iron (Fe) 40%
Lithium (Li) 15%
Magnesium (Mg) 33%
Manganese (Mn) 37%
Molybdenum (Mo) 33%
Neodymium (Nd) 0%
Nickel (Ni) 35%
Lead (Pb) 53%
Silver (Ag) 26%
Tin (Sn) 22%
Steel 40%
Tellurium (Te) 0% Source: UNEP (2011) and own estimations
Titanium (Ti) 52%
Vanadium (V) 0% 19
Zinc (Zn) 23%
Mineral availability?
• Inherent uncertainty in the estimates of mineral
 resources. Bauxite ore
• Availability depends on:
 • market factors:
 • Speculation
 • Price of minerals
 e.g. Leaching
 • Geological factors:
 • Interdependences: many metals are extracted
 as co-products of others
 • Regulation:
 • E.g. protection of environment and/or
 societies

 20
Proposals of options to simulate „live“ with MEDEAS-W
• Baseline scenario
Green growth with 100% renewable electric energy in 2060 and current recycling rates
• Alternative scenarios:
 • A: improve 50% recycling rates by 2050 and 2x current estimated reserves
 • B: improve 100% recycling rates by 2050 and 2x current estimated reserves
 • C: improve 50% recycling rates by 2050 and half current estimated reserves
 • D: improve 100% recycling rates by 2050 and half current estimated reserves
 Improve recycling rates by 2050

 +50% +100%

 Uncertainty in 2x A B
 mineral reserves
 half C D

 21
References
• Capellán-Pérez, I., de Castro, C., Miguel González, L.J., 2019. Dynamic Energy Return on Energy Investment (EROI) and material requirements in
 scenarios of global transition to renewable energies. Energy Strategy Reviews 26, 100399. https://doi.org/10.1016/j.esr.2019.100399

• de Castro, C., Capellán-Pérez, I., 2020. Standard, Point of Use, and Extended Energy Return on Energy Invested (EROI) from Comprehensive
 Material Requirements of Present Global Wind, Solar, and Hydro Power Technologies. Energies 13, 3036. https://doi.org/10.3390/en13123036

• Pulido Sanchez, D.P., Capellán-Pérez, I.C., Mediavilla Pascual, M., de Castro Carranza, C., Frechoso Escudero, F.A., 2021. Analysis of the material
 requirements of global electrical mobility. DYNA 96, 207–213. https://doi.org/10.6036/9893

• Smil, V., 2015. Power Density: A Key to Understanding Energy Sources and Uses. The MIT Press, Cambridge, Massachusetts.

• UNEP, 2011. Recycling rates of metals. A status report. International Resource Panel. United Nations Environment Programme, Nairobi, Kenya.

• Zappa, W., Junginger, M., & van den Broek, M. (2019). Is a 100% renewable European power system feasible by 2050?. Applied energy, 233, 1027-
 1050.

 22
Iñigo Capellán-Pérez
Low-carbon society:
An enhanced modelling tool for the transition to sustainability

 info@locomotion-h2020.eu

 www.locomotion-h2020.eu

 This project has received funding from
 the European Union’s Horizon 2020 research and innovation
 programme under grant agreement No 821105.
 Follow us
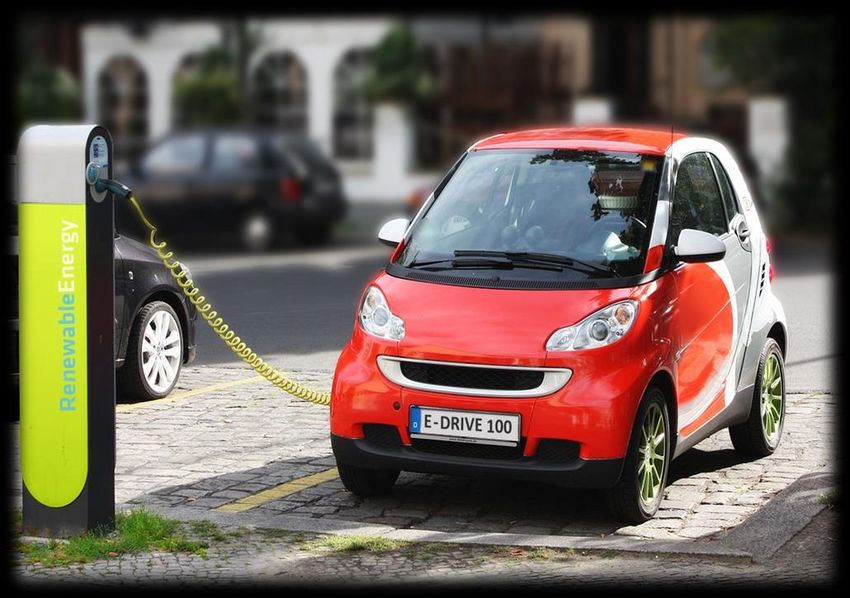
The hidden
environmental cost of
electric cars

Marga Mediavilla
(Professor, University of Valladolid)

 24
Objective: transport decarbonization 2050

 25
Objective: transport decarbonization 2050

 How? E-scenarios
 1. Past trends
 2. EV high
 3. E-bike

 26
Objective: share of household vehicles 2050

 Gasoline
 Gasoline/gasoil cars E-motorbikes motorbikes
 Today
 Gasoline
 Electric cars Gasoline/gasoil cars E-motorbikes motorbikes
 Trends
Trends
 • EV high: strong
 electrification
 Electric cars E-motorbikes
EVEVhigh
 high • E-bike: light vehicles

 Electric cars E-motorbikes E-bikes
 E-bike
 E-bike

 0% 20% 40% 60% 80% 100%

 27
Objective: share of transportation vehicles 2050
 Electric Gasoil
 Gasoil trucks Gasoil vans Gasoil buses trains trains
 Today
 Electric Gasoil
 Gasoil trucks EV vans E-buses trains trains
 Trends
Trends • Not an easy electrification of heavy
 vehicles
 Hybrid trucks EV vans E-buses Electric trains
 EVhigh
EV high • Avitation and marine transport: no
 electrification only eficiency
 Gasoil trucks EV vans E-buses Electric trains improvements.
 E-bike
 E-bike

 0% 10% 20% 30% 40% 50% 60% 70% 80% 90% 100%

 hybrid trucks other trucks EV vans other vans E-buses other buses E-train other train

 28
Results: emissions

 -80% objective

 29
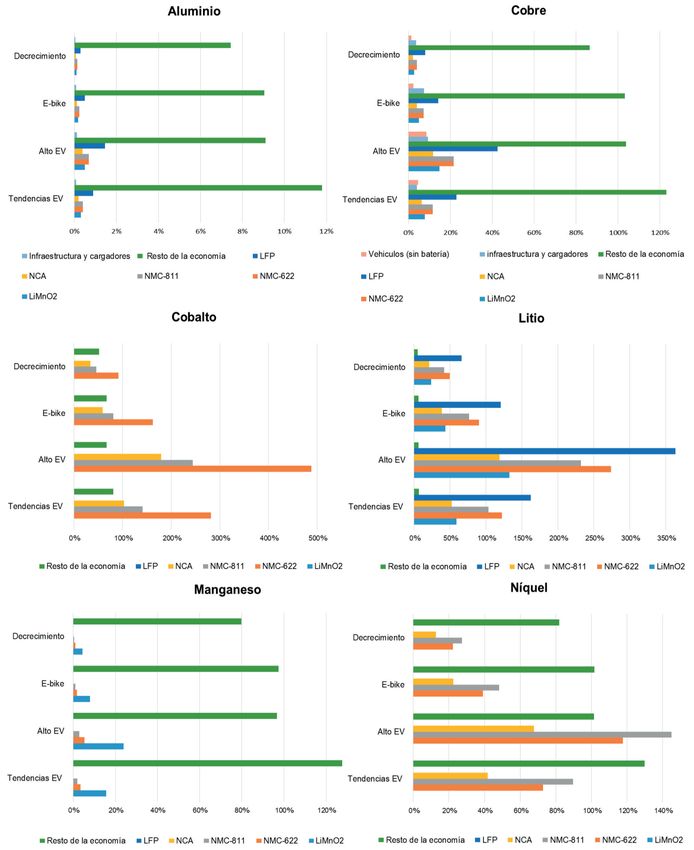
Results: minerals. Percent of reserves used.
 LITHIUM

 E-bike
Recycling rates double

 EV high

Present recycling rates Trends

 Rest of the economy

 Different types of batteries for EV

 30
Results: minerals. Percent of reserves used.

 COBALT
 E-bike
Recycling rates double

 EV high

Present recycling rates Trends

 Rest of the economy

 Different types of batteries for EV

 31
Results: minerals. Percent of reserves used.

 NICKEL

 E-bike
Recycling rates double

 EV high

Present recycling rates Trends

 Rest of the economy

 Different types of batteries for EV

 32
Results: minerals. Percent of reserves used.

 COPPER

 E-bike
Recycling rates double

 EV high

Present recycling rates Trends

 Motors of the EV Charging infrastructure Rest of the economy

 33
Marga Mediavilla. Geeds-UVa.
Low-carbon society:
An enhanced modelling tool for the transition to sustainability

 info@locomotion-h2020.eu

 www.locomotion-h2020.eu

 This project has received funding from
 the European Union’s Horizon 2020 research and innovation
 programme under grant agreement No 821105.
 Follow us
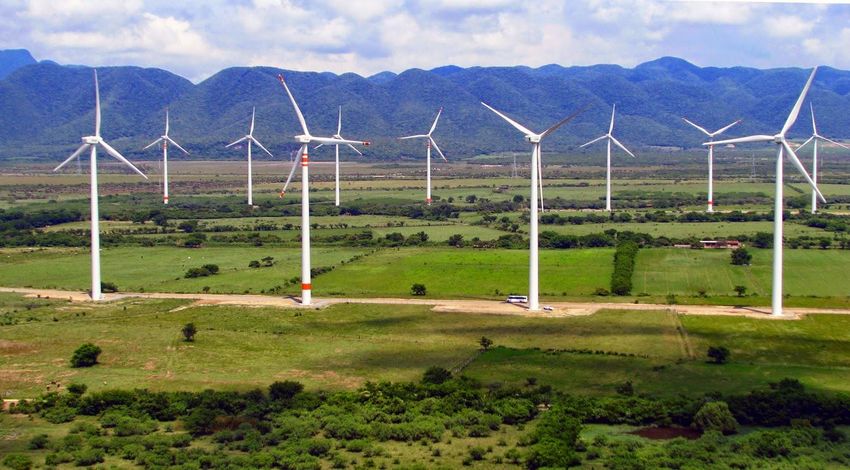
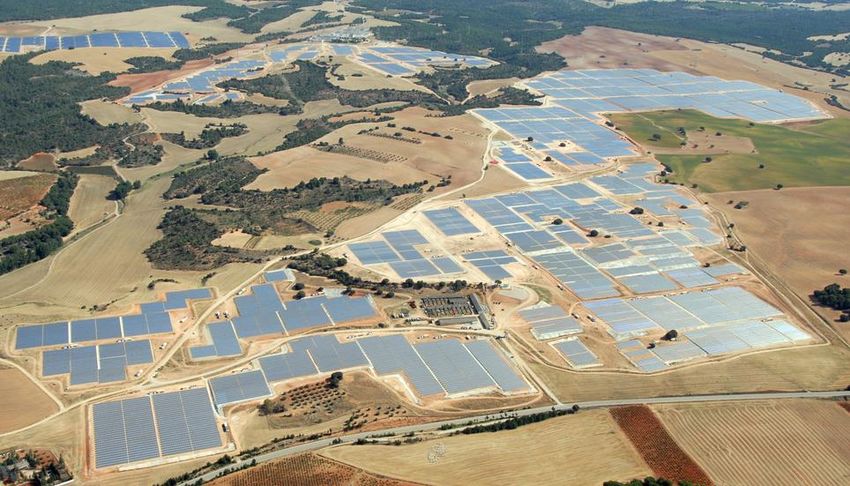
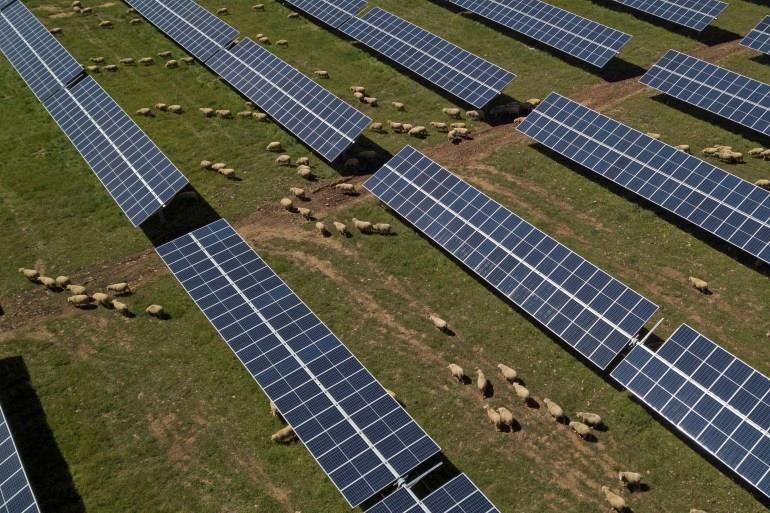
The hidden land costs
 of solar energy
 Dirk-Jan van de Ven
 (Basque Centre for Climate Change)

The hidden land costs of solar energy – Dirk-Jan van de Ven 35
Background
• Important role of solar energy in EU decarbonisation pathways
 • Abundant solar resources
 • Zero emissions
 • Less visible and noisy than wind energy
 • Cheap: in many places cheapest source of new energy capacity, with costs still declining

• Land occupation as main drawback
 • Solar energy needs large amount of horizontal space to capture sunlight
 • Most land in Europe has high productive or natural value
 • With more expansion, more competition with existing land uses
 • Rooftop space insufficient to meet energy demands
 • Large scale import from Africa unrealistic

 The hidden land costs of solar energy – Dirk-Jan van de Ven 36
Study

 Global Change Analysis Model (GCAM)

 + solar
 energy

 https://doi.org/10.1038/s41598-021-82042-5

 The hidden land costs of solar energy – Dirk-Jan van de Ven 37
Land occupation
 European Union
 240

 within the region, In 1000 km2
Scenario 50% 210

 Total Land cover change i
 180

 n 2050 relative to 2015
solar in 150
 120
electricity mix 90
 60
 30
 0
 -30
 -60
 -90
 -120
 -150
 -180
 -210
 -240
 Land-based solar in 0% 19% 27% 36% 45% 54% 63% 71%
 electricity mix by 2050

 the region by 2050, in
 cover change outside
 penetration on land
 120

 Impact of solarland
 90
 60

 1000 km2
 30
 0
 -30
 -60
 -90
 -120

 The hidden land costs of solar energy – Dirk-Jan van de Ven 38
Land use change emissions
 70

 Range of non-land life cycle
 emissions for PV 1 in Europe (~ 1226
electricity output between 2020 and 2050

 60
 grams of CO2 from LUC per kWh solar

 sun-hours per year) Visonta, Hungary
 50

 40

 30

 20

 10 European Union

 0
 Puertollano, Spain
 20,00% 40,00% 60,00% 80,00%
 % Penetration in electricity mix

 The hidden land costs of solar energy – Dirk-Jan van de Ven 39
Conclusions
• Solar energy in Europe not without impacts
 • May occupy an area as big as total urbanised land nowadays
 • Likely displaces natural land within and outside Europe (indirectly)
 • The higher the penetration, the more land use change emissions per kWh generated

• But context is important:
 • Land use change emissions 4 to 16% of the CO2 emissions from natural gas fired electricity
 • 6 to 25 less land use change emissions per kWh than biomass-fired electricity

• Recommendations:
 • Policies on siting and land management of solar parks
 • As much generation as possible in urban areas
 • Reduce energy demand!

 The hidden land costs of solar energy – Dirk-Jan van de Ven 40
Dirk-Jan van de Ven
Low-carbon society:
An enhanced modelling tool for the transition to sustainability Dj.vandeven@bc3research.org

 info@locomotion-h2020.eu

 www.locomotion-h2020.eu

 This project has received funding from
 the European Union’s Horizon 2020 research and innovation
 programme under grant agreement No 821105.
 Follow us
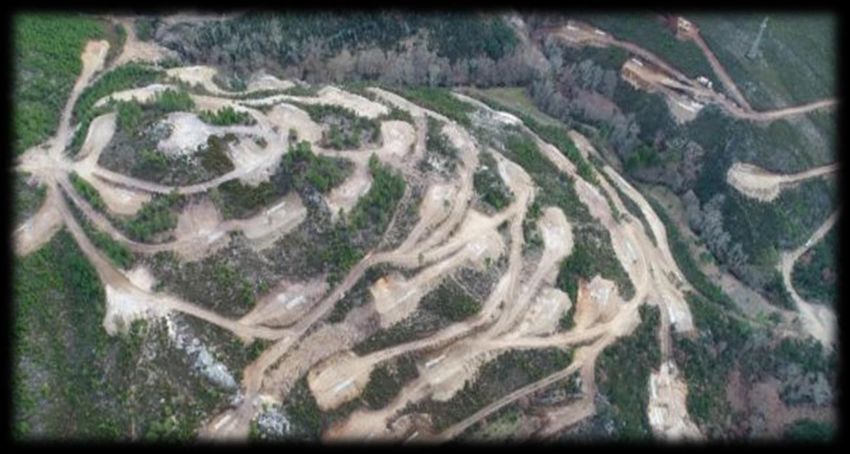
EU Policy Recommendations

• Raw Materials
• Electric vehicles
• Low-carbon technologies

 Mina do Barroso, Portugal: https://im-mining.com/tag/mina-do-barroso/

Brine pools and processing areas in the Atacama Salt Flats, Chile: https://www.ft.com/content/583cfd8c-202d-11e7-b7d3-
163f5a7f229c
EU Policy Recommendations – Raw Materials

Set targets and plans to reduce absolute
resource consumption and environmental
pressures
• Since 1970, the global population has doubled,
 yet extraction of materials (including fossil
 fuels for energy) has tripled.

• The 1.2 billion poorest people account for just
 1% of the world’s consumption, while the 1
 billion richest account for 72%.
Global Material Footprints

 • Higher-income countries consume 13 times
 more than lower-income countries

 • Current EU material footprint is 14.5 tonnes
 per capita and sustainable and just limit is
 likely somewhere between 5 and 10 tonnes
 per capita, under ‘business-as-usual’, the EU
 is heading for colossal overconsumption and
 catastrophic environmental and social
 impacts.

https://unstats.un.org/sdgs/report/2019/goal-12/
2060 Projections
Towards a sustainable and just EU material footprint

 • The green transition will likely surge a mining
 and metals boom in the short-term to build
 infrastructure and low-carbon technologies,
 accompanied with high greenhouse gas
 emissions due to energy-intensive mining and
 processing.

 • We have emissions reduction targets for
 climate, we need the same for material
 reduction in circular economy policies.

 • Best evidence available shows the EU must
 reduce its material footprint by up to 70% (to
 4.4 tonnes per capita) from current
 consumption levels by 2050. We propose
 30% reduction by 2030, and 50% by 2040.
How do we reduce material consumption?

 • “Growth is culturally, politically and institutionally
 ingrained”- EEA

 • Material wealth beyond a certain level does not lead to
 corresponding increases in happiness, well-being or health.

 • Combination of measures targeting energy efficiency,
 recycling, material substitution, the use of innovative
 materials, and sustainable lifestyles.

 • Not up to individuals and behavioral change. The
 responsibility is on governments to drive the transition
 away from the growth-based economic system
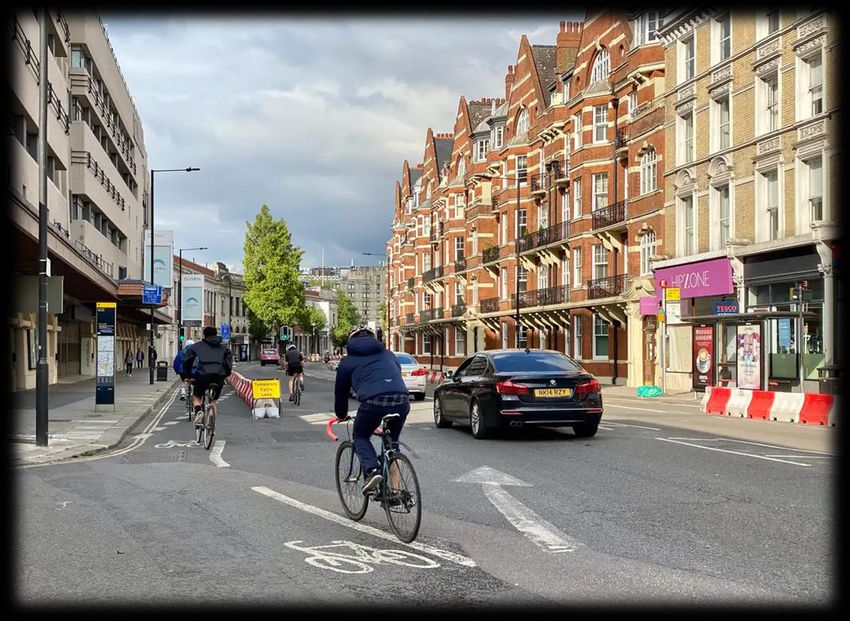
EU Policy Recommendations – Electric Vehicles

 • Prioritize micro e-mobility, walking and cycling.

 • Create safer bike infrastructure, accessible public
 transport, and reduction in private cars and air travel

 • The new Sustainable and Smart Mobility Strategy
 aims to deliver a 90% reduction in the transport
 sector’s emissions by 2050, and envisages that by
 2030, there will be at least 30 million zero-emission
 vehicles in operation on European roads.
EU Policy Recommendations – Electric Vehicles

 • Cycling is ten times more important than electric cars for reaching
 net-zero cities.

 • People who cycle on a daily basis had 84% lower carbon emissions
 from all their daily travel than those who didn’t.

 • The average person who shifted from car to bike for just one day a
 week cut their carbon footprint by 3.2kg of CO₂ – equivalent to
 the emissions from driving a car for 10km, eating a serving of
 lamb or chocolate, or sending 800 emails.

 • If just one in five urban residents permanently changed their
 travel behaviour, cycling for just one trip per day, over the
 next few years, it would cut emissions from all car travel in
 Europe by about 8%.
EU Policy Recommendations – Low-carbon Technologies

 • Reduce energy demand

 • Small scale producers and decentralized

 • Energy democracy
Thank You!
 Diego Marin
Low-carbon society:
An enhanced modelling tool for the transition to sustainability diego.marin@eeb.org

 info@locomotion-h2020.eu

 www.locomotion-h2020.eu

 This project has received funding from
 the European Union’s Horizon 2020 research and innovation
 programme under grant agreement No 821105.
 Follow us
Q and A

 52
Thank you very much
If you want to receive regular updates please join our social media
channels:
Website: https://www.locomotion-h2020.eu/
Twitter: @LocomotionH2020
LinkedIn: https://www.linkedin.com/company/locomotion-h2020/
Facebook: https://www.facebook.com/locomotion.h2020/
Research Gate: https://www.researchgate.net/project/LOCOMOTION-
H2020

 53
You can also read