Parametric Energy Simulations of a Nordic Detached House Heated by a Wood Stove
←
→
Page content transcription
If your browser does not render page correctly, please read the page content below
E3S Web of Conferences 172, 25007 (2020)                                                                  http://doi.org/10.1051/e3sconf/202017225007
NSB 2020

         Parametric Energy Simulations of a Nordic Detached House
         Heated by a Wood Stove
         Martin Thalfeldt1,2*, Anders Skare1, Laurent Georges1, and Øyvind Skreiberg3
         1Norwegian  University of Science and Technology, Department of Energy and Process Engineering, Kolbjørn Hejes vei 1B, 7491
         Trondheim, Norway
         2Tallinn University of Technology, Department of Civil Engineering and Architecture, Ehitajate tee 5, 19086 Tallinn, Estonia
         3SINTEF Energy Research, Kolbjørn Hejes vei 1A, 7465 Trondheim, Norway

                        Abstract. Wood stoves are widely used in Nordic countries. They offer a good opportunity to use biomass
                        for space-heating and to reduce the peak power of all-electric buildings. However, wood stoves are highly
                        concentrated heat sources with limited control compared to other typical heat emission systems, which
                        makes the assessment of their impact challenging. This study introduces a simulation-based parametric
                        study of a detached house equipped with a wood stove located in Oslo, Norway. The respective impact of
                        different building parameters and stove nominal powers on the building performance is illustrated. The
                        analysis shows that the annual total space-heating needs (i.e. the sum of the base load, modelled as ideal
                        heaters representing the electrical radiators, the stove and the heating of the ventilation supply air) increased
                        significantly due to the higher average indoor temperature. The resulting heat emission efficiency of the
                        stove ranged between 66% and 90%. However, the stoves covered between 28% and 62% of the total space-
                        heating needs. When using the stove, the maximum hourly-averaged power for the electrical radiators
                        decreased between 5 W/m2 and 31 W/m2 during the peak hours of the electricity grid. The building thermal
                        mass, insulation level, as well as the combination of internal door position with the bedroom temperature
                        setpoint, had a significant impact on the calculated values. Finally, the study revealed that the occupant
                        behaviour modelling should be improved to better capture the wood stove impact on the energy
                        performance using building simulations.

       1 Introduction                                                           a simple but accurate enough method to assess the wood
                                                                                stove influence on the building energy performance is
       Wood stoves are widely used and offer a good                             needed. Previous researches have shown the potential
       opportunity to use biomass for space-heating and reduce                  and limitations of standard BPS software for this
       CO2 emissions. Kipping and Trømborg [1] studied 608                      application. However, none of the existing studies on the
       households in Norway and wood stoves were used in                        building integration of wood stoves have investigated the
       more than 90% of them. They showed that in more than                     impact of the building insulation level as well as the
       half of the buildings with direct electric heating, wood                 combination of the wood stove with different heat
       stoves are the main source of heating according to the                   emitters in the other rooms.
       building users. It is common practice to assess the                          This study presents a parametric study of a detached
       energy performance of buildings before construction                      house located in Oslo, Norway, with varying
       and, as wood stoves are typical heating sources, their                   construction modes, insulation levels and stove nominal
       impact on the energy performance should be evaluated.                    powers (Pn). The aim is to give insight on the impact of
           A main challenge to consider wood stove during                       wood stoves on the energy performance of a detached
       design is that detailed building performance simulation                  house. The stove heat emission efficiency and the
       (BPS) is required. Georges et al. [2, 3] conducted such                  fraction of the total space-heating needs covered by the
       investigations and showed that the proper integration of                 stove are studied. In addition, the potential impact of the
       wood stoves in passive houses is possible, both in the                   wood stove on the grid interaction is assessed. This study
       mild climate of Belgium and cold climate zones of                        complements a study by Thalfeldt et al. [6] that proposed
       Norway. The use of BPS to evaluate the time-varying                      a simplified power sizing method for the correct building
       operative temperature during the space-heating using a                   integration of wood stoves, which is based on
       stove has been validated experimentally [4, 5].                          assessment of thermal comfort.
       Unfortunately, these detailed simulations are not
       accessible when people (possibly assisted by wood stove
       dealers) have to select a stove for their home. Therefore,

         *
             Corresponding author: martin.thalfeldt@taltech.ee

  © The Authors, published by EDP Sciences. This is an open access article distributed under the terms of the Creative Commons Attribution License 4.0
  (http://creativecommons.org/licenses/by/4.0/).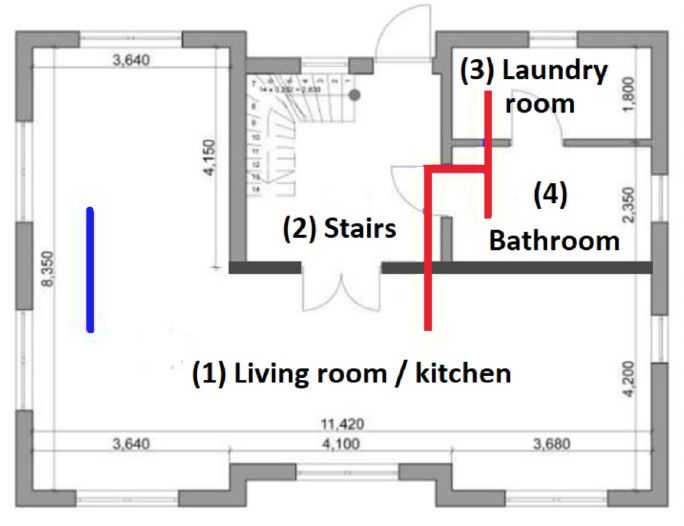
E3S Web of Conferences 172, 25007 (2020) http://doi.org/10.1051/e3sconf/202017225007
NSB 2020
2 Methods The following rule-based control algorithm for the
operation of the stove and ideal heaters was implemented
This study is based on annual simulations of a typical in IDA-ICE:
detached house in Norway in the location and climate of - A stove cycle was started when the operative
Oslo. Parametric simulations were done with various temperature was lower than 20.1 °C in the living room, if
construction modes, insulation levels and stove nominal it was assumed occupied. The occupancy schedule in the
powers. Their impact on the heat balance of the building living room was defined between 07:00-10:00 and
and the stove heat emission efficiency, as well as their 19:00-22:00 during weekdays, and between 07:00-22:00
influence on the peak power of the base heating system, during weekends.
were calculated. The detailed description of methods is - The room temperature setpoint for ideal heaters was 20
given in the subsequent paragraphs. The simulation °C in all the rooms except bedrooms, where the
model, building structures and stoves are identical to the temperature setpoint was 16°C or 20 °C, depending on
ones used in a previous study [6]. In addition, the cases the case.
included two positions for all the internal doors, fully - The total heat emission of the stove, meaning the sum
open or closed, which were kept fixed during the yearly of convection and longwave thermal radiation, was
simulation. The selected temperature setpoints of imposed to the stove surface as a function of operation
bedrooms were either 16 °C or 20 °C, as this depicts the time from the start of the cycle according to the profiles
common habit in Norway to prefer colder bedrooms [7, provided in Fig. 4.
8].
2.1 The simulation model of the detached house
The simulations of the detached house were performed
with the well-validated dynamic building performance
simulation software IDA-ICE (version 5, beta 04) [9].
The main advantage of this version is its capability to
accurately evaluate the mean radiant temperature at the
location of the occupant as it models accurately radiative
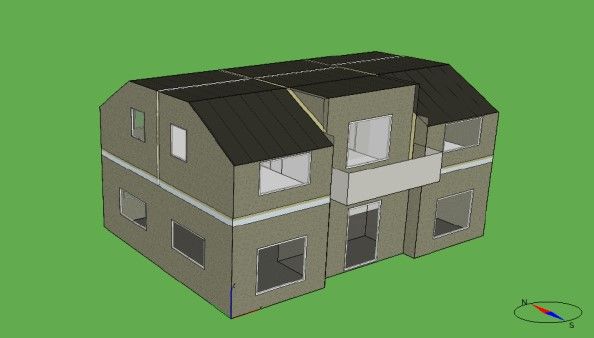
heat transfer between surfaces. The living room
geometry has a L-shape and, in this new version, the
stove geometry is directly integrated inside the virtual Fig. 1. 3D view of the virtual geometry of the detached house.
geometry of the room. The resulting geometry is
therefore not convex and view factors between surfaces
were computed numerically by IDA-ICE [10, 11].
The hourly profiles for the internal heat gain from Occupant
occupants, equipment and artificial lighting were taken
from ISO 17772-1 [12] and are given in Fig. 3. Balanced
mechanical ventilation with heat recovery is
implemented. A total airflow rate of about 208 m3/h was Stove
used, which complies with the minimum requirements of
the Norwegian building regulation [13]. The cascade
ventilation supplies air to the living room and bedrooms,
while extracts air from the kitchen, bathrooms, the
laundry room and the staircase.
Stoves with nominal power (Pn) between 3 and 12
kW and with batch loads (here defined as the total
energy emitted by the stove during one combustion
cycle) ranging from 7.5 to 30 kWh/cycle were used in
the simulations. Fig. 4 illustrates the heat emission
profiles of each stove. These profiles were obtained
using a semi-empirical model of wood stoves called
Fuelsim-Transient, developed by Skreiberg [14]. It
models the combustion and heat transfer physics inside
the stove.
In IDA-ICE, these heat emission profiles were given
as an input to the stove model. Given realistic stove
dimensions for each nominal capacity (Pn), the resulting
stove surface temperature is computed dynamically by
IDA-ICE for each time step.
Fig. 2. Ground (top) and 1st floor (bottom) plans of the
detached house with the locations of the stove, occupant and
mechanical ventilation supply (blue) and extract (red) air ducts.
2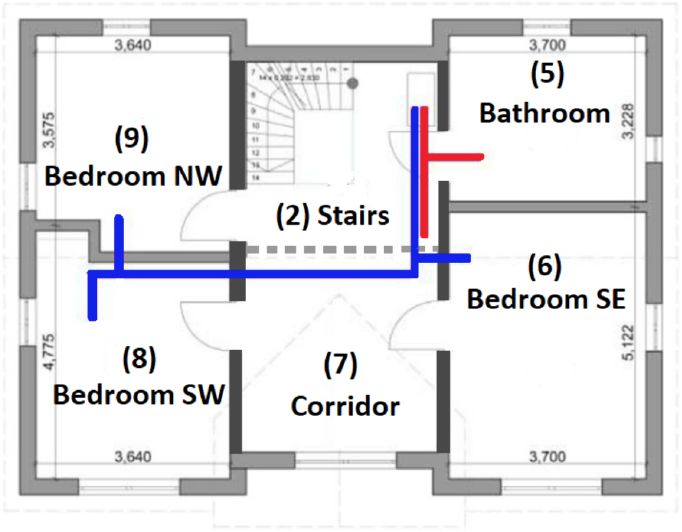
E3S Web of Conferences 172, 25007 (2020) http://doi.org/10.1051/e3sconf/202017225007
NSB 2020
Table 1. The specific heat loss through the living room exterior
5 300
envelope (UAenv) as function of thermal insulation level.
Heat gains, W/m 2
Heat gains, W
4 240
3 180 UAenv,
Thermal insulation level Stove Pn range, kW
W/K
2 120
1 60 Passive house (PH) [17] 31.5 3, 4, 6
0 0
TEK10 [13] 49.6 3, 4, 6
Occupants Equipment Lighting
TEK07 [18] 56.1 4, 6, 8
Fig. 3. The daily profile of the internal (sensible) heat gains
TEK97 [19] 91.3 4, 6, 8, 10
from occupants, equipment and electrical lighting in all zones
of the building model.
TEK87 [20] 118.0 6, 8, 10, 12
2.2 The construction of the detached house
Table 2. The calculated specific heat loss through the internal
constructions (UAint) and thermal capacity (C) of living rooms
The study included various insulation levels and depending on the construction mode (CM) and the thickness of
construction modes (CM), see Table 1 and Table 2, effective activation depth, 10 cm (Ceff,10) or 2 cm (Ceff,2).
respectively. The construction modes influence the
thermal capacity of the building. The insulation level Construction UAint, Ceff,10, Ceff,2,
Description
ranged from passive house (PH) level to the Norwegian mode W/K kWh/K kWh/K
national requirements from 1987 (TEK87). The specific CM1
Masonry
187.0 7.94 1.48
heat losses of cases TEK97 and TEK87 are significantly heavy
higher as they have natural ventilation. For the sake of CM2
Mixed wood-
157.6 5.58 1.32
simplicity, this is modelled as a mechanical ventilation masonry
without heat recovery and without pre-heating of the CM3
Wooden
76.5 3.45 1.07
ventilation supply air. The ventilation losses by the stove heavy
combustion air are not modelled. The stove is assumed CM4 Masonry light 41.8 2.57 0.99
to have an independent air intake, which is the best
practice for buildings with balanced ventilation.
CM5 Wooden light 25.1 1.77 1.02
The specific heat losses through internal
constructions of the living room also depend on the
construction mode (see Table 2). The effective thermal
2.3 Stove performance indicators
capacities were calculated according to EN ISO 52016-
1:2017 [15] assuming that either 10 cm (Ceff,10) or 2 cm
The following indicators were used to rate the
(Ceff,2) of the wall construction are activated during one
performance of the heating system:
stove cycle. The calculations of the specific heat losses
- emission efficiency of the stove,
and effective thermal capacity have been described in
- stove fraction in the total space-heating needs,
detail in [16].
- duration of the periods when the operative temperature
exceeded 25 °C during the space-heating season,
20 - the maximum power of the base heating system (ideal
Stove heat emission, kW
heaters) during the peak hours of the electricity grid.
15 In this study, the emission efficiency of the stove is
calculated for each case by comparing the total space-
10 heating needs between two different simulations: with
and without the stove (i.e. the reference case). The
5
emission efficiency ηemission is calculated according to
equation 1.
0
0 50 100 150 200
(1)
Time, min
3kW / 7.5 kWh 4kW / 10kWh where QSH is the energy needs of ideal heaters
[kWh], QAHU is the energy needs for supply air heating
6kW / 15kWh 8kW / 20kWh [kWh], Qstove is the energy needs of the stove [kWh],
10kW / 25kWh 12kW / 30kWh while the subscripts ref and i denote the reference case
and the case i, respectively. Typically, the emission
Fig. 4. The heat emission profiles for all wood stoves as a
efficiency of a heating system is calculated by
function of the stove nominal capacity and batch load. comparing cases with identical indoor temperature
setpoints. However, in this study, there is a 0.1 °C
3E3S Web of Conferences 172, 25007 (2020) http://doi.org/10.1051/e3sconf/202017225007
NSB 2020
difference between the setpoint for the ideal heaters and reflected by the temperature increases in the middle of
for the stove in order to ensure the priority of the stove January 12th. The temperature increases in the morning
operation over the ideal heaters in the living room. and the evening indicate that the stove was activated by
For each case, the stove fraction in the total space- the control algorithm, whereas the room temperature of
heating needs of the building is calculated. Again, the the reference cases was relatively stable. The higher
total heating needs consist of ideal heaters, the stove and temperatures due to the stove increased the space heating
supply air heating. In addition, the annual number of needs. The building characteristics and the stove Pn
stove cycles are reported for each case. influenced how often the stove was activated. In most
The over-heating was assessed based on the cases with a stove, the stove was not activated in the
accumulated duration of the periods when the living evening of January 12th, only in the morning. The only
room operative temperature exceeded 25 °C during the exception was the case with heavy construction (CM1)
space-heating season. A temperature threshold of 25 °C and stove Pn of 3 kW, in which the stove was activated
was selected based on the standard EN 16798-1:2019 also in the evening of January 12th.
[21]. The heating season was selected based on a The impact of the wood stove on the space-heating
qualitative assessment of the annual hourly space- needs of the various cases in comparison to their
heating power profiles of the reference cases. In most reference cases without stove are given in Fig. 6.
cases, the heating season was from October 1st to May With open internal doors and a bedroom temperature
1st, with the exception of the passive house level, which setpoint of 16 °C (OD/16), the heat emission efficiency
had a shorter period, from October 15th to April 15th. of the stove with the heaviest construction mode (CM1)
The impact of the stove on the electricity grid was varied between 87% and 90%. There was only a slight
assessed based on the maximum hourly-averaged power decrease of the emission efficiency when the stove
of the ideal heaters during the peak hours of the grid. nominal power increased. The heat emission efficiency
According to Kipping and Trømborg [1], direct electric of the wood stove with the lightest construction mode
heating is clearly the dominating heating strategy in (CM5) was significantly lower and ranged between 73%
Norway. Therefore, the peak power of ideal heaters can and 84%. With closed internal doors and a bedroom
be used as they behave similarly to electric radiators. temperature setpoint of 20 °C (CM5/CD/20), the stove
The peak hours of the grid were defined between 7:00 heat emission efficiency further decreased up to 7%.
and 10:00 and 17:00-20:00, which are the same hours as Regarding the influence of the building insulation, the
in the study by Clauβ and Georges [22]. less insulated buildings (i.e. TEK07 and TEK87) had
lower stove emission efficiencies. The most efficient
wood stoves currently available in the market have a
3 Results generation efficiency of ~85%. Assuming this value
For the sake of conciseness, only the results of the leads to an overall efficiency of the wood stove ranging
following cases are presented: from 55% to 77% compared to ideal heaters.
- CM1/OD/16: construction mode 1, open internal doors The stove contribution to the total space-heating
and bedroom temperature setpoint of 16 °C. needs varied between 28% and 62%. In contrast with the
- CM5/OD/16: construction mode 5, open internal doors stove emission efficiency, these values depended less on
and bedroom temperature setpoint of 16 °C. the construction mode (based on the comparison the
- CM5/CD/20: construction mode 5, closed internal cases CM1/OD/16 and CM5/OD/16). Only the passive
doors and bedroom temperature setpoint of 20 °C. house cases gave differences larger than 1% for the stove
The case CM5/OD/16 was assumed to represent the nominal powers of 3 and 6 kW. Both cases gave a
typical situation in Norway, meaning a detached house difference of 4%, but in the opposite direction. This
with wooden construction and a lower bedroom might be explained by the fact that the cases with a stove
temperature setpoint of 16 °C. The comparison of cases nominal power of 3 kW had a similar annual number of
CM1/OD/16 and CM5/OD/16 enables to assess the stove cycles – 224 (CM1) and 230 (CM5).
impact of the thermal mass and the insulation level of
Living room temperature, C
partition walls. The comparison of cases CM5/OD/16 27
and CM5/CD/20 enables to assess the combination of the 25
impact of internal door position and the bedroom
temperature setpoint. 23
21
3.1 Heat balance of the building 19
11/01 00:00 12/01 00:00 13/01 00:00
An example of the impact of the stove on the living Date and time, dd/mm hh:mm
room temperature is illustrated in Fig. 5, which presents
the temperature fluctuations during January 11 th and 12th CM1/Ref. CM1/3 kW CM1/6 kW
in the passive house using CM1/OD/16 and CM5/OD/16 CM5/Ref. CM5/3 kW CM5/6 kW
cases. The figure includes the cases with a stove Pn of
3 kW and 6 kW, and their respective reference cases. Fig. 5. The living room hourly average temperatures of cases
Both days had average outdoor temperature of -5 °C, but CM1/OD/16 and CM5/OD/16 with passive house insulation
January 11th was cloudy and January 12th sunny, which is level.
4E3S Web of Conferences 172, 25007 (2020) http://doi.org/10.1051/e3sconf/202017225007
NSB 2020
(a) 468 455 438 425 However, the case with stove nominal power of 6
180 Stove cycles, - kW and lighter constructions had a significantly smaller
30 39 46 53
160 Stove proportion in heat balance, % number of stove cycles – 146 (CM1) vs. 179 (CM5). The
Emission efficiency, % 88 88 88 87 larger time constant of the building with heavier
140
construction kept a more stable temperature and the
Energy need, kWh/m2
120 375 352 316 stove was activated less by the control algorithm. The
100 35 49 57 position of internal doors and the bedroom temperature
setpoint had a larger impact on the stove fraction in the
80 224 191 146 90 90 89 heat balance. The differences for the cases CM5/OD/16
60 46 52 58 and CM5/CD/20 ranged between 2% and 18%, whereas
40 90 90 89
the difference was larger with larger stove nominal
20
power.
The annual number of stove cycles ranged between
0 125 and 498. In reality, the higher number of cycles
Ref. 3 4 6 Ref. 4 6 8 Ref. 6 8 10 12
(~500) cannot really be expected as the actual user habits
PH TEK07 TEK87 to operate the stove would most probably be different.
Ideal heater Stove Supply air heating This shows that the values obtained in this study are only
indicative.
498 494 478 467
60
30 39 46 52
temperature exceeding 25 C ,
180 Stove cycles, - (b) (a)
% (100%=heating period)
50
Stove proportion in heat balance, % 79 76 75 73
Duration of operative
160
Emission efficiency, % 40
140
Energy need, kWh/m2
397 382 357 30
120
35 49 58 20 16.3
100 14.6
10.9
10.7
80 230 215 179 82 79 77 10 3.8
3.8
0.9 0.9 0.0 1.3
60 42 52 62 0
40 3 4 6 4 6 8 6 8 10 12
84 83 80
20 PH TEK07 TEK87
0 60
temperature exceeding 25 C , %
Ref. 3 4 6 Ref. 4 6 8 Ref. 6 8 10 12 (b)
50
PH TEK07 TEK87
(100%=heating period)
Duration of operative
Ideal heater Stove Supply air heating 40
30.4 33.2
28.2
459 442 429 413 30 24.2 22.2 23.0
28 35 41 46 20 16.8 16.3
180 Stove cycles, - (c)
9.1
78 74 70 66 10 6.8
160 Stove proportion in heat balance, %
Emission efficiency, %
140 0
Energy need, kWh/m2
3 4 6 4 6 8 6 8 10 12
120 333 287 244
PH TEK07 TEK87
100 31 38 42
60
80 169 151 125 84 78 74
temperature exceeding 25 C ,
(c) 51.5
% (100%=heating period)
60 50 44.3
32 37 44
Duration of operative
42.1
40 85 82 79 40 34.6 35.2 35.5
20 30 26.0
25.0 23.7
0 18.4
Ref. 3 4 6 Ref. 4 6 8 Ref. 6 8 10 12 20
PH TEK07 TEK87 10
Ideal heater Stove Supply air heating 0
3 4 6 4 6 8 6 8 10 12
Fig. 6. The heat balance of the building distributed between PH TEK07 TEK87
ideal heaters, the stove and supply air heating and the stove
emission efficiency, stove proportion in the heat balance and Fig. 7. Cumulated duration when the living room operative
annual number of stove combustion cycles of cases temperature is above 25 °C during the heating season for cases
CM1/OD/16 (a), CM5/OD/16 (b) and CM5/CD/20 (c). CM1/OD/16 (a), CM5/OD/16 (b) and CM5/CD/20 (c).
5E3S Web of Conferences 172, 25007 (2020) http://doi.org/10.1051/e3sconf/202017225007
NSB 2020
3.2 Over-heating of the living room levels of the passive house, TEK07 and TEK87,
respectively. Including a wood stove in the simulation
The results for over-heating are presented in Fig. 7. The models decreased these peak powers by 5-31 W/m2 in
cumulated duration when the operative temperature comparison with the respective reference cases for all
exceeded 25 °C during the space-heating season insulation levels and the relative decrease was between
depended significantly on all the parameters included in 32% and 56%.
this study. The building construction mode had the The peak power values obtained for the
highest impact, which was followed by the position of corresponding reference cases of CM5/OD/16 and
internal doors and then stove nominal power. CM5/CD/20 were relatively similar. The difference
The cases with the heaviest construction (CM1) had between the corresponding reference cases without a
the lowest values, which ranged between 0.0% and stove and those with a stove was smallest for low stove
16.3%. The corresponding cases with the lightest nominal powers. However, the peak power reduction due
constructions (CM5) had values between 6.8% and to a stove was significantly larger with open doors and
33.2%. Assuming closed doors and bedroom temperature bedroom temperature setpoint of 16 °C in comparison
setpoint of 20 °C, it further increased the values ranging with cases with closed internal door and bedroom
from 18.4% to 51.5%. temperature setpoint of 20 °C.
Higher stove Pn increased the duration of hours The impact of the construction mode on the peak
above 25 °C significantly. The largest increase was for power reduction was significantly larger than the
CM5/CD/20 TEK87 insulation level, which doubled the position of doors and bedroom temperature. The
over-heating duration from 26.0% to 51.5% if the stove differences between the peak power values of
Pn increased from 6 kW to 12 kW. The CM5/OD/16 corresponding cases on CM1/OD/16 and CM5/OD/16
with passive house insulation level was the only case ranged between 1.6 W/m2 and 5.1 W/m2. The largest
with over-heating duration below 5%. In that case the differences between corresponding cases were observed
duration increased from 0.9% to 3.6%, if the stove Pn for cases with the lowest insulation level, i.e. TEK87.
increased from 3 kW to 6 kW.
62.1
70
The impact of the insulation level is assessed (a)
Hourly average peak power of
60
comparing cases with a Pn of 6 kW for all the insulation
ideal heaters, W/m2
42.1
50
levels. In case of the heaviest constructions (CM1), the
36.3
33.5
30.9
40
overheating duration decreased from 3.8% to 1.3% for
28.7
the passive house and TEK87 insulation levels, 30
17.4
14.7
12.5
respectively. The respective values were 24.2% and
11.9
20
6.6
16.3% for the case CM5/OD/16 and 34.6% and 26.0%
5.5
4.7
10
for the case CM5/CD/16. 0
The large duration when operative temperature
6
Ref.
3
4
Ref.
4
6
8
Ref.
6
8
10
12
exceeded 25 °C is caused by the relatively large batch PH TEK07 TEK87
sizes used in this study. Presumably, people would adjust
the amount of wood they burn in their wood stove based 70
65.3
(b)
Hourly average peak power of
on the weather conditions. Therefore, the control 60
44.8
ideal heaters, W/m2
algorithm used in this study probably does not depict
41.4
50
38.5
35.7
accurately the actual habits of occupants.
31.1
40
Carvalho et al. [23] measured daily variations of the 30
20.5
17.9
living room temperature of up to 10 °C during the
15.9
13.9
20
8.8
heating season in a low-energy house heated by a wood
7.9
6.4
10
stove in Denmark. Therefore, the occupants’ preferences
0
on the thermal comfort assumed in the standard
Ref.
3
4
6
Ref.
4
6
8
Ref.
6
8
10
12
EN 16798-1:2019 might not be valid when studying
wood stoves. Seemingly, wood stoves would then cause PH TEK07 TEK87
significant over-heating in old detached houses
62.0
70
Hourly average peak power of
(TEK87). However, in reality, wood stoves are often (c)
60
installed and used in these buildings, which indicates
44.6
ideal heaters, W/m2
42.3
41.0
50
40.0
that there is no significant dissatisfaction with the
40
29.1
thermal indoor environment due to over-heating caused
30
20.0
by the wood stoves.
18.5
18.3
13.6
20
8.9
8.8
8.0
10
3.3 Stove impact on the grid during peak hours
0
6
Ref.
3
4
Ref.
4
6
8
Ref.
6
8
10
12
The impact of the wood stoves on the peak load of
PH TEK07 TEK87
electric heaters is presented in Fig. 8. The maximum
hourly-averaged power of ideal heaters during the grid
Fig. 8. The maximum hourly-averaged power of ideal heaters
peak hours of the reference cases was in the range of 12-
during 7:00-10:00 and 17:00-20:00 for cases CM1/OD/16 (a),
14 W/m2, 29-31 W/m2 and 62-65 W/m2 for insulation CM5/OD/16 (b) and CM5/CD/20 (c).
6E3S Web of Conferences 172, 25007 (2020) http://doi.org/10.1051/e3sconf/202017225007
NSB 2020
4 Discussion and conclusions The authors acknowledge the financial support by the Research
Council of Norway and a number of industrial partners through
This study analysed the impact of wood stoves on the the WoodCFD project (“Clean and efficient wood stoves
performance of a detached house located in Oslo, through improved batch combustion models and CFD
modelling approaches”), 243752/E20 as well as the European
Norway. A simulation-based parametric study with
Regional Development Fund and the programme Mobilitas
varying thermal mass, insulation level, internal door Pluss (Grant No – 2014-2020.4.01.16-0024, MOBTP88).
positions, bedroom temperature setpoint and stove
nominal power was conducted. The stove heat emission
efficiency, stove fraction of the total space-heating References
needs, the operative temperature in the living room (with
the wood stove) and maximum hourly-averaged space- 1. A. Kipping and E. Trømborg, Energy 93, 655–671
heating power of the ideal heaters was assessed. (2015).
The assumptions about occupant behaviour and their 2. L. Georges, Ø. Skreiberg, and V. Novakovic,
preferences had a strong impact on the results of the Energy and Buildings 59, 203–213 (2013).
annual simulations. Firstly, the stove operation was 3. L. Georges, Ø. Skreiberg, and V. Novakovic,
controlled only according to the operative temperature in Energy and Buildings 72, 87–95 (2014).
the living room and fixed occupancy time schedules.
4. L. Georges and Ø. Skreiberg, Journal of Building
During the preparation of this study, spontaneous
Performance Simulation 9(6), 663-679 (2016).
conversations with people who have wood stoves in their
houses were held. They pointed out that outdoor 5. M. Thalfeldt, L. Georges, and Ø. Skreiberg,.
conditions (e.g. temperature and solar radiation) or other Springer Proceedings in Energy Proceedings of Cold
behavioural patterns might have a significant impact on Climate HVAC Conference 2018, 653-663 (2018).
the periods when their stove is operated. 6. M. Thalfeldt et al., E3S Web of Conferences 111,
Secondly, the same heat emission profiles of stoves 02066 (2019).
were assumed each time the stove was operated. It is 7. M. Berge, J. Thomsen, and H. M. Mathisen, Journal
probable that people adjust the amount of wood they use of Housing and Built Environment 32(2), 211-230
per batch depending on the conditions. This eventually (2017).
influences the heat emission profiles. Therefore, the
results of this study are indicative and an improved 8. B. Bjorvatn et al., Sleep Medicine 32, 157-161
occupant behaviour model for the manual operation of (2017).
the wood stoves is needed to better represent the actual 9. EQUA, 2014. [Online]. Available: http://www.equa-
situation. In addition, a better understanding of people’s solutions.co.uk/en/software/idaice.
preferences on the thermal indoor environment in 10. L. Eriksson et al., Proceedings of the First Building
buildings heated by a wood stove are needed to assess Simulation and Optimization Conference, 2012, 149–
the perceived thermal comfort. Let also mention that the 156.
wood stoves considered in this study have limited heat 11. L. Georges et al., Building and Environment 149,
storage capacity. 169-181 (2019).
Thirdly, the ventilation losses generated by the
combustion air of the stove in buildings with natural 12. ISO 17772-1 (2017).
ventilation were not taken into account. This will further 13. Forskrift om teknisk krav til byggverk (Byggetknisk
decrease the efficiency of the stove and will require a forskrift TEK10) (2010).
dedicated modelling in further studies. 14. Ø. Skreiberg, Fuelsim-Transient: A Mass, Volume
Regardless of the modelling limitations of the stove and Energy Balance Spreadsheet for Batch Combustion
operation, this study showed that wood stoves can have a Applications, NTNU, Trondheim, 2002.
significant impact on the energy performance a detached 15. EN ISO 52016-1:2017 (2017).
house. The wood stoves covered 28-62% of the total
space-heating needs of the building, whereas these total 16. A. Skare, Validation of a method to select the
needs increased significantly due to the higher indoor optimal nominal power of a wood stove in residential
temperatures. This is characterized by a stove heat buildings, NTNU (2018).
emission efficiency which varied between 66% and 90%. 17. NS3700:2013 (2013).
This study also showed that the stoves may have a 18. Tekniske forskrifter til plan- og bygningsloven 2007
significant positive impact on the grid peak load of (TEK07) (2007).
detached houses heated by electricity. The reduction of
19. Ren veiledning til teknisk forskrift til plan- og
the maximum hourly-averaged power of the ideal heaters
bygningsloven 1997 (TEK97) (1997).
during the grid peak hours was between 5 W/m2 and
31 W/m2. In conclusion, all the variables (meaning the 20. Byggeforskrift 1987 (TEK87) (1985).
construction mode, insulation level, stove nominal power 21. EN 16798-1:2019 (2019).
as well as the combination of the door position and 22. J. Clauß and L. Georges, Applied Energy 255,
bedroom temperature setpoint) had a significant impact 113847 (2019).
on the calculated values.
23. R. L. Carvalho et al., Energy and Buildings 59, 244–
251 (2013)
7You can also read