Key Results June 2020 - Coalition for Green Capital
←
→
Page content transcription
If your browser does not render page correctly, please read the page content below
Key Results June 2020
Bounce Back Greener: The Economic Impact Potential of a Clean Energy Jobs Fund
● A Clean Energy Jobs Fund (CEJF) could kick-start a step change in green investment by crowding
in private investment and generating millions of new jobs.
● The CEJF could translate an initial $35 billion capitalization into a total $105 billion investment
capacity through borrowing and drive almost $500 billion dollars of public and private
investment across key green sectors within its first five years through direct financing and private
co-investment in projects. Over two decades, the CEJF could drive almost $2 trillion worth of
investment.
● Looking at a realistic investment portfolio for the CEJF across six climate mitigation sectors, the
Fund could support the creation of 5.4 million new job-years in its first five years of operation.
As initial investments are repaid and then reinvested by the Fund, job creation would continue
at approximately the same rate.
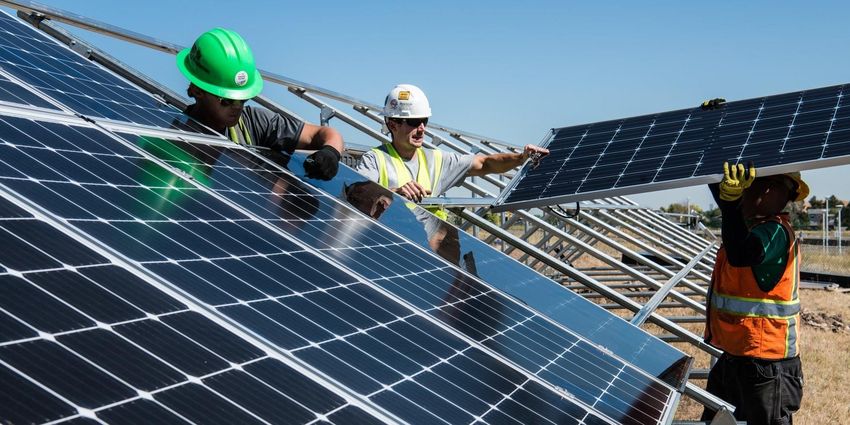
● Clean investments generate more jobs than fossil fuel investments, for the same level of
spending. In particular, the CEJF’s clean transport and renewable energy sectors have huge job
creation potential, providing more than 60% of new jobs created.
1Bounce Back Greener: The Economic Impact Potential of a Clean Energy Jobs Fund
A Clean Energy Jobs Fund – building on the established green bank model – can accelerate US public and private
investment and fight climate change. A Clean Energy Jobs Fund (CEJF) can build on the proven green bank model
already demonstrated at the state and local level in the US and at the national level in countries as diverse as the
United Kingdom, Australia, India and South Africa. A CEJF using the green bank model, as envisaged in the 2019
National Climate Bank Act, could maximize climate and economic impact by crowding in multiple private dollars
for every dollar of public funding invested. Investment into the CEJF through a $35 billion federal capitalization, as
set out in the 2019 Act, has the potential to unlock substantially greater levels of investment: alongside increased
public investment, the CEJF can invest smartly alongside private finance to mobilize billions of dollars in additional
investment and catalyze longer term changes by accelerating the commercial viability and private financing of
climate investments.
Climate banks have a track record of creating new jobs and the CEJF can play a key role supporting a green
recovery. Alongside supporting climate change action, climate banks like the CEJF also support economic growth
and employment. For example, Michigan Saves, Michigan’s non-profit climate bank, estimates that every dollar it
holds in reserves translates into at least $30 of private investment that flows back into the state’s economy – and
by investing $220 million in energy improvements between 2010 and 2019 the climate bank supported
approximately 4,400 full-time jobs.1 Building on the demonstrated economic impacts already flowing from sub-
national US green and climate banks, the CEJF can initiate a step-change in national green investment while also
driving forward a green recovery from the Covid-19 health and economic crises.
This report summarizes key messages from an analysis of the job creation impact potential of the CEJF. To assess
the economic impact from the CEJF at the national level, this analysis applies a three step modelling process to
consider the total new investment that can be driven by the CEJF, how that financing might be deployed within
the CEJF’s target sectors, and how investments in those sectors translate to new jobs. Future analysis during 2020
will expand on this assessment through state-specific analysis to quantify the climate mitigation, economic growth
and job creation benefits from the CEJF in more detail.
Source: Vivid Economics
1
Coalition for Green Capital (2020) The National Climate Bank Act
2Bounce Back Greener: The Economic Impact Potential of a Clean Energy Jobs Fund
The proposed Clean Energy Jobs Fund is a non-profit corporation whose mission is to invest in
projects that alleviate the environmental impacts of carbon-related activity. It is nonpartisan, will
have a bipartisan board of directors, and will be a 501c3 tax-exempt entity.
If funded by Congress, the CEJF will be allocated $35 billion of capital by the federal government,
with any residual capital returning to the government after authorized operation. Its debt is not
guaranteed by the government.
The CEJF aims at maximizing job creation per public dollar invested, as long as investments meet
three conditions:
1. Mitigate the environmental impacts of carbon-related economic activity through greenhouse
gas emissions reduction or increased climate resilience.
2. Make communities, consumers and businesses impacted by the investments better off.
3. Have a broad portfolio of risk-adjusted investments, with at least 20% of the portfolio made of
investments that benefit low-income, minority, underserved, frontline and/or just transition
communities.
The Fund will help create, invest in and partner with green banks at the regional, state and local
level to support smaller, community-scale investments. It will also be authorized to invest directly
in projects of national or regional scale.
CEJF investments will create clean energy jobs across the country, with special priority given to
states where unemployment is highest. It is likely that this will closely overlap with states that
contribute substantially to the US’s greenhouse gas emissions as these states’ economies are likely
to be less focused on service sectors and more emissions intensive.
Source: Coalition for Green Capital
3Bounce Back Greener: The Economic Impact Potential of a Clean Energy Jobs Fund
The CEJF can use a range of approaches to maximize the impact from its federal capitalization and support its
target sectors. The CEJF could use a wide range of financing and investment tools to support investment in priority
sectors that can deliver both new green jobs and support climate action, including in the seven priority sectors set
out in the 2019 National Climate Bank Act: (i) agriculture, (ii) renewable energy, (iii) grid technology, (iv) building
efficiency, (v) industrial decarbonization, (vi) clean transport and (vii) climate-resilient infrastructure.
Financial modeling for the CEJF suggests it could leverage an initial public capitalisation of $35 billion into half a
trillion dollars in investment over its first five years. Based on the initial public capitalisation of $35 billion, the
financial model assumes the CEJF can leverage the balance sheet of CEJF through bond issuances for a total initial
capitalisation of $105 billion (a 3:1 ratio of public to total capital). This initial capitalisation is split across four
different example and common financing instruments for green banks: (i) market-terms loans, (ii) soft loans, (iii)
equity investments, and (iv) guarantees. Based on deal structuring and examples seen from previous green and
climate banks, different instruments can crowd in additional private co-investment at levels ranging from $2.4 to
$6.5 private dollars per $1 of public financing. Any returns from interest and other payments can be recycled by
the CEJF and allocated to new lending. By combining the balance sheet leverage, instrument-level private sector
co-investment and revenue recycling, the CEJF could deliver a total of $500 billion worth of investments over its
first five years. In addition to this central scenario, low and high cases for balance sheet leverage and private capital
mobilization were tested, resulting in a range of $350-$700 billion in total investment mobilized over the CEJF’s
first five years of operation. Over a 20-year period, the total amount of direct and co-investment supported by the
CEJF could reach $1.7 trillion under the central case. The Technical Report accompanying this analysis
(forthcoming) provides more details on modelling approaches, key assumptions and data sources.
The investment portfolio for the CEJF considered in this analysis sets out an allocation of investment capital to
support an executable investment plan for the CEJF. The portfolio is based on the demonstrated ten year track
record of on-the ground investment by actual green banks, also balancing the capacity of sectors to absorb the
proposed levels of new investments, the potential of sectors to deliver job creation per public dollar and the need
to deliver balanced investment to reduce GHG emissions. Prioritizing any of these factors would lead to different
portfolio allocations and end results – the portfolio presented in this analysis aims to provide a balance anchored
in targeting areas of demonstrated investment potential to identify a realistic and executable allocation across
investment areas and technologies. This central scenario portfolio was developed through three analytical steps:
1. Reviewing US green banks’ current allocation trends across the six target mitigation sectors to identify an
initial allocation. For example, renewable energy investments make up 55% of New York Green Bank’s
investment portfolio, with grid technology at 9%, building efficiency at 25%, and transport at 10%.2
2. Verifying that the portfolio is aligned with US future decarbonization trends. A similar portfolio to that of
New York Green Bank means that the CEJF could finance up to a quarter of the required investment in
electricity generation facilities to achieve an 80% greenhouse gas reduction below 1990 levels by 2050.3
3. Checking that generation capacity forecasts for different technologies are feasible for the levels of
proposed CEJF investment, particularly for renewable energy technologies. Costing the U.S. Energy
2 New York Green Bank, Portfolio. Retrieved from: https://greenbank.ny.gov/Investments/Portfolio
3 Williams, J.H., B. Haley, F. Kahrl, J. Moore, A.D. Jones, M.S. Torn, H. McJeon (2014). Pathways to deep decarbonization in the United States. The U.S. report
of the Deep Decarbonization Pathways Project of the Sustainable Development Solutions Network and the Institute for Sustainable Development and
International Relations. Nov 25, 2014.
4Bounce Back Greener: The Economic Impact Potential of a Clean Energy Jobs Fund
Information Administration’s outlook of renewable electricity generation using International Renewable
Energy Agency (IRENA) data allows us to estimate the share of each renewable within CEJF’s portfolio.4
Alongside this central scenario, two variations are also included:
● Renewables & grid technology portfolio: Although fossil fuel use has declined in recent years, renewable
energy sources still account for a relatively small share in US consumption and generation – 11% of total
energy consumption and 17% of electricity generation in 2018.5 This CEJF portfolio variation allocates
greater investment into renewables and the associated grid infrastructure.
● Transport & industrial decarbonization portfolio: Transport and industry together account for around 50%
of total emissions in the US and are characterized by technologies that are early-stage in their
decarbonization transitions.6 This CEJF portfolio variation allocates greater investment into hard-to-
decarbonize and emissions-intensive sectors of clean transportation and industrial decarbonization.
Within each sector, the analysis considers real-world investment cases to model hypothetical investments the
CEJF is likely to support. The use of real-world investment cases for crucial technologies for each of the key sectors
identified by the 2019 Act is key to modelling economic impacts resulting from the construction and operation
phase of the CEJF’s investments. To provide a profile of potential investments across sectors, the analysis draws
on investment costs and profiles based on Vivid Economics’s Vivid Intervention Database, Department of Energy
investment analysis and costs, and past investments by US green banks.7
Sector Agriculture Renewables Grid Technology Building Industrial Clean Transport
Efficiency Decarbonization
Definition Includes forestry Includes solar, Includes Includes energy Includes Includes battery
(afforestation, wind, transmission, efficiency, fuel decarbonization electric vehicles,
reforestation), geothermal, distribution, and switching, of energy- plug-in hybrid
land hydro, ocean storage to electrification, intensive electric vehicles,
conservation, and hydrokinetic support clean heating and industries such hydrogen
regenerative and fuel cell energy cooling as iron, steel, vehicles, vehicle
agriculture, distribution, and cement, refining charging and
waste smart-grid and chemicals fueling
management applications infrastructure
Investment Reforestation Onshore wind Energy storage Rooftop solar Carbon Capture Electric vehicles
Case(s) Hydro Smart meters panels and Storage Electric buses
Solar Charging
photovoltaics stations
CEJF 5% 40% 10% 15% 16% 14%
Investment (3% / 10%) (45% / 35%) (15% / 5%) (17% / 10%) (11% / 21%) (9% / 19%)
Share
Note: CEJF Investment Share shows the central case portfolio allocation as well as variations on the central scenario
included in parentheses (Renewables & grid technology focus / Transport & industrial decarbonization focus).
Source: Vivid Economics
4 U.S. Energy Information Administration. (2019). Annual Energy Outlook 2020 with projections to 2050. ; IRENA. (2018). Renewable Power Generation Costs
in 2017. International Renewable Energy Agency.
5 US Energy Information Administration. 2019. “How much of U.S. energy consumption and electricity generation comes from renewable energy sources?”
6 US Environment Protection Agency. 2019. “Sources of Greenhouse Gas Emissions”
7
More details on specific investment cases are available in the accompanying Technical Report.
5Bounce Back Greener: The Economic Impact Potential of a Clean Energy Jobs Fund
This assessment uses Vivid Economics’ Investment Impact Model (IIM) to assess the CEJF’s job creation potential
within the six target sectors identified above and throughout their supply chains. The IIM includes detailed
breakdowns of how investment into a sector creates new one-off and ongoing transactions that increase economic
activity and employment in associated supporting sectors.8 The IIM is used to assess the job creation potential
from financing – including both CEJF financing and private co-investment – over the first five years of investment
by the CEJF. Job creation is measured in job-years for both direct jobs (resulting from the investment itself, through
construction or ongoing maintenance and operations) and indirect jobs (created throughout supply chains as a
result of investments).9
Portfolio scenario
Renewables & grid Central case Transport & industrial
technology focus decarbonization focus
Low
3,400,000 3,900,000 4,400,000
Financial mobilization
mobilization
Central case 4,800,000 5,400,000 6,100,000
High
6,800,000 7,700,000 8,700,000
mobilization
Source: Vivid Economics
Economic impact modelling suggests the CEJF could deliver between 3.4 million and 8.7 million new job-years
over a five-year period, with 5.4 million job-years created in the central case. To put this in perspective, in 2019
there were 6 million unemployed people in the US,10 which increased to 23.1 million unemployed people in April
2020.11 Depending on the scenario, the CEJF has the potential to generate 10 to 12 new jobs per $1 million
invested. While job creation falls in the range of 3.9 to 7.7 million job-years in the central portfolio, the alternative
Transport & industrial decarbonization portfolio has a relatively higher potential for job creation (around 15%
higher) and the Renewables & grid technology portfolio as a relatively lower potential for job creation (around
10% lower), reflecting different job intensities for the respective focus sectors. Within the central case:
● Investment sectors with the highest job creation potential are renewable energy and clean transportation,
accounting (around 62% of jobs created), followed by industrial decarbonization (around 14%).
8IIM is based on a sectoral disaggregation of economic activity encompassing granular input-output tables. The tool is based on the multiplier effect that
each sector has in the economy, where the coefficients can be interpreted as by how much total demand in the economy must increase to meet the increased
output from the shock (of investments) in each target sector. The job creation assessment does not include ‘induced’ jobs created by additional spending by
households due to higher levels of income.
9 Job-years refer to years of work created under a new job, and is a helpful measure as it captures the total job creation impact across different types of jobs
and to enable comparison with estimated job impacts from other interventions or investments.
10 Annual average of seasonally adjusted unemployment data: Bureau of Labor Statistics (2020) Labor Force Statistics from the Current Population Survey.
11
Bureau of Labor Statistics (2020) The Employment Situation — April 2020.
6Bounce Back Greener: The Economic Impact Potential of a Clean Energy Jobs Fund
● At the portfolio level, direct jobs in the target sectors are 1.5 times higher than indirect jobs.
● Different sectors create different numbers of new jobs for a given level of investment based on the share
of investment across capital and operational expenses, and on how much of investment costs goes
towards labor costs versus other investment inputs.12
The CEJF can support jobs across the US and across a wide range of professions. The sectors targeted by the CEJF
in this analysis employ individuals in every state. While some investment areas may be more relevant in certain
regions of the country – particularly utility-scale solar energy, wind power and agriculture – the example portfolio
considered in this analysis supports investment across the US. Many investment areas will be needed in every
state and community, such as grid technology, building efficiency and clean transport, while industrial
decarbonization may offer particular opportunities in manufacturing-focused areas of the US. New jobs created
by the CEJF will go beyond technical or installation jobs – almost half of the current jobs in the US clean energy
industry are in administration, management and sales.13 Direct jobs created by the CEJF will similarly support a
wide range of professions – and indirect jobs created through supply chains will be even broader across the
economy. However, all jobs created will contribute to reducing emissions and to the goal of reaching zero
emissions in 2050.
The employment potential of the CEJF may be even higher, as this analysis does not take into account the CEJF’s
potential to drive broader market changes in investment patterns and to support climate innovation and help
develop new technologies and green industries. However, this assessment also does not account for potential
‘displacement’ of existing jobs within the economy, for example jobs created in the renewables sector may be
filled by existing energy workers rather than drawing in new or unemployed workers. It also does not consider
potential supply constraints if the labor market tightens, particularly in key sectors such as construction.
Sector Portfolio CEJF Private co- Total Direct Indirect Total
allocation investment investment investment job-years job-years job-years
($ billion) ($ billion) ($ billion) (million) (million) (million)
Agriculture 5% 6 19 25 0.22 0.16 0.38
Renewables 40% 47 153 201 0.84 0.63 1.48
Grid Technology 10% 12 39 51 0.21 0.16 0.37
Building Efficiency 15% 17 56 74 0.37 0.21 0.58
Industrial Decarbonization 15% 18 58 77 0.46 0.29 0.75
Clean Transport 14% 17 54 71 1.18 0.69 1.87
Total 100% 118 381 498 3.28 2.15 5.43
Note: Numbers may not sum to totals due to rounding. Job numbers are presented in job-years.
Total CEJF investment of $118 billion reflects the initial $35 billion capital endowment, $70 billion in borrowed
capital, and $13 billion in capital recycling over five years.
Source: Vivid Economics
12 For example, ‘Clean transport’ has a relatively higher job creation potential due to the initial investment generating a high number of ongoing jobs, and
partly a consequence of the low CAPEX:OPEX ratios compared to other investment cases, and a high labor share of output in vehicle manufacturing sectors.
13
NASEO & EFI (2020) 2020 U.S. Energy & Employment Report
7Bounce Back Greener: The Economic Impact Potential of a Clean Energy Jobs Fund Company profile Vivid Economics is a leading strategic economics consultancy with global reach. We strive to create lasting value for our clients, both in government and the private sector, and for society at large. We are a premier consultant in the policy-commerce interface and resource- and environment-intensive sectors, where we advise on the most critical and complex policy and commercial questions facing clients around the world. The success we bring to our clients reflects a strong partnership culture, solid foundation of skills and analytical assets, and close cooperation with a large network of contacts across key organisations. Contact us Vivid Economics Limited 163 Eversholt Street London NW1 1BU United Kingdom enquiries@vivideconomics.com T: +44 (0)844 8000 254 Vivid Economics LLC 1440 G Street NW Washington DC, 20005 United States us.info@vivideconomics.com
You can also read