Driving Industrial Sustainability Delivering Value in Fluid-Flow Processes - Energy Recovery Investor Presentation - August 2021

Page created by Ethel Chapman
 
CONTINUE READING
Driving Industrial Sustainability Delivering Value in Fluid-Flow Processes - Energy Recovery Investor Presentation - August 2021
Driving Industrial Sustainability
Delivering Value in Fluid-Flow Processes
Energy Recovery Investor Presentation – August 2021

                                                      NASDAQ: ERII
Driving Industrial Sustainability Delivering Value in Fluid-Flow Processes - Energy Recovery Investor Presentation - August 2021
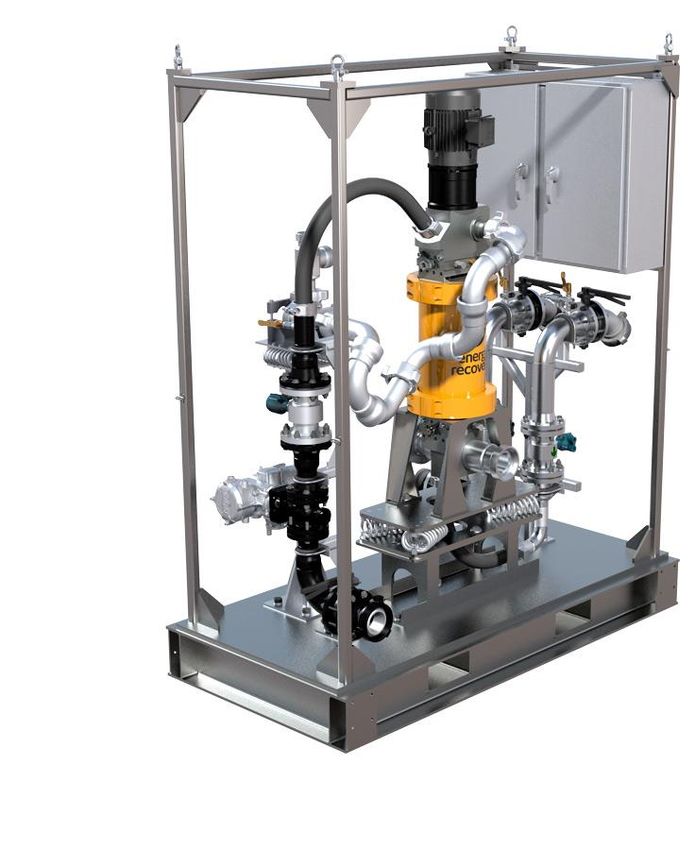
FORWARD LOOKING STATEMENT

This presentation contains forward-looking statements within the “Safe Harbor” provisions of
the Private Securities Litigation Reform Act of 1995. Forward-looking statements in this report
include, but are not limited to, statements about our expectations, objectives, anticipations, plans,
hopes, beliefs, intentions, or strategies regarding the future. Forward-looking statements that
represent our current expectations about future events are based on assumptions and involve risks
and uncertainties. If the risks or uncertainties occur or the assumptions prove incorrect, then our
results may differ materially from those set forth or implied by the forward-looking statements.
Our forward-looking statements are not guarantees of future performance or events. Words such
as “expects,” “anticipates,” “believes,” “estimates,” variations of such words, and similar
expressions are also intended to identify such forward-looking statements.
These forward-looking statements are subject to risks, uncertainties, and assumptions that
are difficult to predict; therefore, actual results may differ materially and adversely from
those expressed in any forward-looking statements. You should not place undue reliance on
these forward-looking statements, which reflect management’s opinions only as of the date of
this presentation. All forward-looking statements included in this presentation are subject to
certain risks and uncertainties, which could cause actual results to differ materially from those
projected in the forward-looking statements, as disclosed from time to time in our reports on
Forms 10-K, 10-Q, and 8-K as well as in our Annual Reports to Stockholders and, if necessary,
updated in our quarterly reports on Form 10 Q or in other filings. We assume no obligation to
update any such forward-looking statements. It is important to note that our actual results could
differ materially from the results set forth or implied by our forward-looking statements.

                                                                                                    2
Driving Industrial Sustainability Delivering Value in Fluid-Flow Processes - Energy Recovery Investor Presentation - August 2021
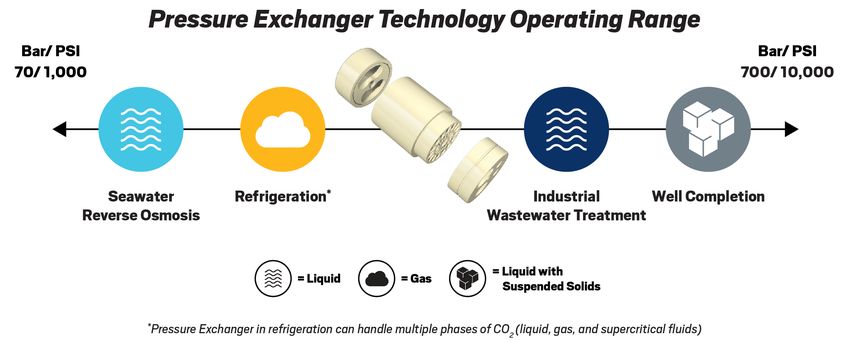
ENERGY RECOVERY SNAPSHOT

                        We design and manufacture solutions that
                        accelerate the environmental sustainability                      Financial Snapshot2
                        of our customers' operations.                             Product Rev Growth

                                                                                  Avg. Growth ‘15 - ’20        21%

                        Our solutions increase efficiency and lower               2020                         27%
                        lifecycle cost by reducing waste and energy
                        consumption in industrial fluid-flow systems.             2021 (est.)                  10%

                                                                                  2022 (est.)                  25%
                        Our flagship PX® Pressure Exchanger® (PX)
                        energy recovery device (ERD) revolutionized
                        seawater reverse osmosis desalination (SWRO),
                        reducing energy costs by up to 60%.1 The PX is            2021 YTD Gross Margin        67%
                        now the industry standard for energy recovery.
                                                                                  Cash & Securities        $121M
                        We continue to push the boundaries of our
                                                                                  Debt                         --
                        core technology, the pressure exchanger, to
                        handle different operating environments of
                        industrial or commercial applications.

1Energy   Recovery estimate; 2Growth and Gross Margin from Product Revenue only

                                                                                                                    3
Driving Industrial Sustainability Delivering Value in Fluid-Flow Processes - Energy Recovery Investor Presentation - August 2021
WE HAVE A STRONG ESG STORY

                             saved for customers on
$2.6B                        energy expenses annually1                         25k+   PXs installed worldwide

                             product revenue from                                     metric tons emissions avoided
90%+                         energy-efficiency related
                             products
                                                                              12.5M   due to PXs = >2.7M vehicles
                                                                                      removed from the road annually1

                             PXs use components made                                  Of waste metal from our
     96%                     from recycled materials                          100%    operations is recycled

Global Installations
of Energy Recovery
Desalination Products

1Energy   Recovery estimates. Assumes all deployed devices are in operation

                                                                                                                  4
Driving Industrial Sustainability Delivering Value in Fluid-Flow Processes - Energy Recovery Investor Presentation - August 2021
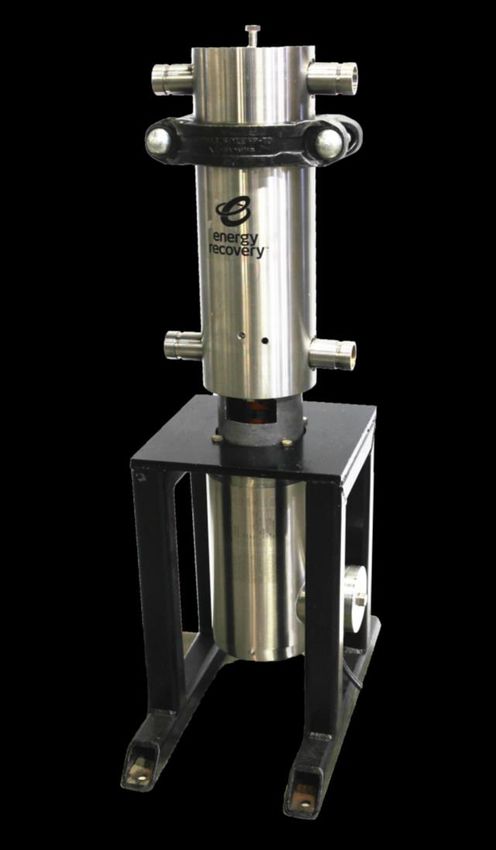
ESG AT ENERGY RECOVERY – MAKING PRODUCTS TO HELP IMPROVE THE ENVIRONMENT

2nd Annual ESG report to be issued Sept 2021
o Aligned with SASB and GRI sustainability
  reporting frameworks; select U.N. Sustainable
  Development Goals

Reflects ongoing commitment to becoming a
more sustainable, resilient business
o Our products address climate change,
  sustainable industrialization, energy efficiency,
  and water scarcity

                                                                                                                                                     To download the full
                                                                                                                                                      report, please visit
                                                                                                                                                          bit.ly/ERI-ESG

THE USE BY ENERGY RECOVERY OF ANY MSCI ESG RESEARCH LLC OR ITS AFFILIATES (“MSCI”) DATA, AND THE USE OF MSCI LOGOS, TRADEMARKS, SERVICE MARKS OR INDEX NAMES HEREIN, DO NOT CONSTITUTE A
SPONSORSHIP, ENDORSEMENT, RECOMMENDATION, OR PROMOTION OF ENERGY RECOVERY BY MSCI. MSCI SERVICES AND DATA ARE THE PROPERTY OF MSCI OR ITS INFORMATION PROVIDERS, AND ARE PROVIDED ‘AS-IS’ AND
WITHOUT WARRANTY. MSCI NAMES AND LOGOS ARE TRADEMARKS OR SERVICE MARKS OF MSCI.

                                                                                                                                                                                        5
Driving Industrial Sustainability Delivering Value in Fluid-Flow Processes - Energy Recovery Investor Presentation - August 2021
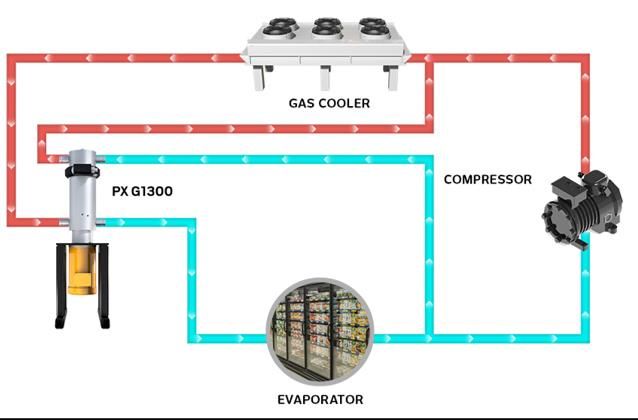
INDUSTRIES BENEFITING FROM PX TECHNOLOGY

 Industry           Markets                 Customer Type            Key Benefits Provided

                                       o Global EPC Firms          o Less Energy
            o Seawater Desalination
                                       o Desalination OEMs           Consumption
            o Brackish Water
                                       o Plant Owners              o Lower Emissions
              Desalination
                                         and/or Operators          o Reduced Costs

                                                                   o Less Energy
                                       o Global EPC Firms
            o Industrial Wastewater                                  Consumption
                                       o Industrial Plant Owners
              Treatment                                            o Lower Emissions
                                         and/or Operators
                                                                   o Reduced Costs

                                                                   o Less Energy
                                       o EPC Firms
                                                                     Consumption
            o Natural Gas Processing   o Plant Owners and/or
                                                                   o Lower Emissions
                                         Operators
                                                                   o Reduced Costs

                                                                   o Lower Emissions vs.
                                                                     HFCs
                                       o OEMs
            o CO2 Refrigeration                                    o Less Energy
                                       o Supermarkets
                                                                     Consumption
                                                                   o Reduced Costs

                                                                                             6
Driving Industrial Sustainability Delivering Value in Fluid-Flow Processes - Energy Recovery Investor Presentation - August 2021
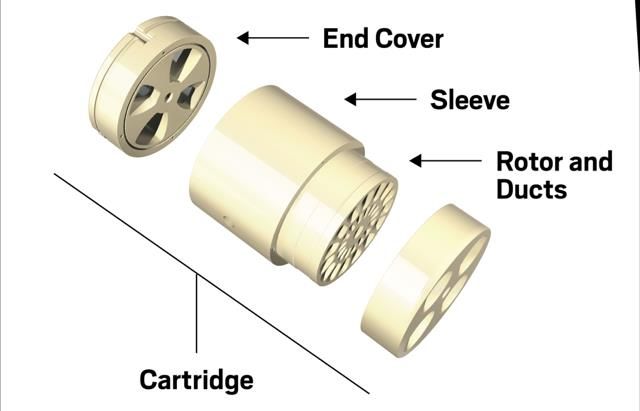
OUR ENERGY RECOVERY DEVICES

               Desalination                                                      Industrial Wastewater Treatment

PX® Pressure Exchanger®     Turbocharger                               PX® Pressure Exchanger®                  Ultra PX™

             CO2 Refrigeration                                                             Natural Gas Processing

                PX® G1300                                                                            IsoBoost
                              Please visit www.energyrecovery.com for complete product information

                                                                                                                            7
Driving Industrial Sustainability Delivering Value in Fluid-Flow Processes - Energy Recovery Investor Presentation - August 2021
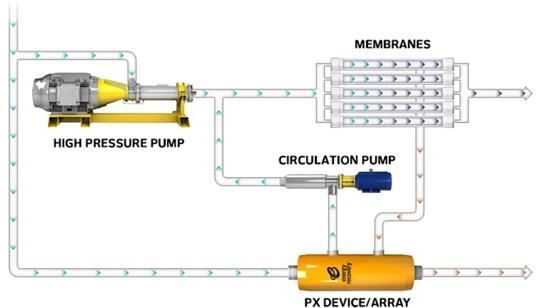
PX TECHNOLOGY PLATFORM – EXCELLING IN A WIDE-RANGE OF PRESSURE APPLICATIONS

o The Pressure exchanger is Energy Recovery’s core technology. This versatile technology acts as a fluid piston,
  efficiently transferring energy between high- and low-pressure fluids and gases through continuously rotating
  ducts

                                                                                                              8
Driving Industrial Sustainability Delivering Value in Fluid-Flow Processes - Energy Recovery Investor Presentation - August 2021
PRESSURE EXCHANGER TECHNOLOGY PLATFORM

o Our pressure exchanger technology works
  as a platform to build product applications
o The technology is versatile – can handle
  liquid, gas, and a range of pressures
o Benefits include lower lifecycle cost and
  energy use in industrial fluid-flow systems
o Pressure exchanger technology is at the
  heart of many of our products

                                                            Anatomy of a Pressure Exchanger
                                                Transfers energy from high-pressure to low-pressure fluids
                                                (both liquids and gas) through continuously rotating ducts
                                                          with only one moving part (the rotor).

                                                                                                     9
Driving Industrial Sustainability Delivering Value in Fluid-Flow Processes - Energy Recovery Investor Presentation - August 2021
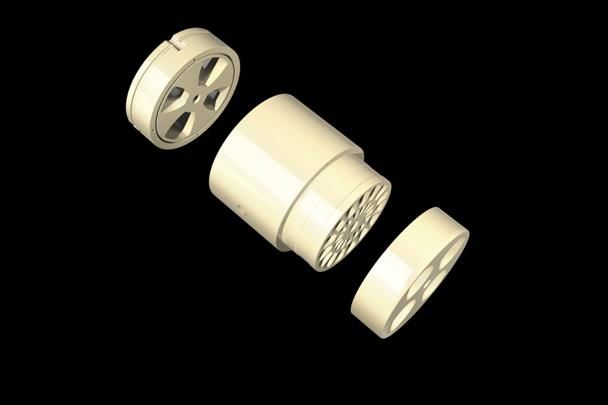
HOW PRESSURE EXCHANGER TECHNOLOGY REDUCES ENERGY CONSUMPTION

 Sealed Phase                                                                                       Pressure Exchange Phase
 Two fluids on opposite sides of                           Rotor duct rotates to                    1. Low pressure driven fluid
 PX; rotor duct is sealed, isolating                     pressure exchange phase                       enters the rotor duct
 high, low pressure fluid streams                                                                   2. High pressure motive fluid
                                                                                                       enters the rotor duct

                                2                                                                                  4
                                                                                             1
                                                                                                                                    2
                      1                                                                                   3

 1. Low pressure driven fluid that                                                                  3. Low pressure driven fluid
    will be pressurized and sent                                                                       contacts motive fluid,
    into system                                             Rotor duct rotates                         expelling it at low pressure
                                                             to sealed phase
 2. High pressure motive fluid                                                                      4. High pressure motive fluid
    that will pressurize low                                                                           contacts driven fluid,
    pressure fluid                                                                                     expelling it at high pressure

                                    Pressure is exchanged continuously as the rotor spins at high speed

                                                                                                                                       10
PRESSURE EXCHANGER TECHNOLOGY IN ACTION

                                                   PX for SWRO
                               PX lowers energy consumption by up to 60%

                         Incoming seawater routed to pump and PX

                                                                            Low pressure
                                                                            potable water

                Main pump size
                                                                   PX transfers energy
                reduced by up to
                                                                   from high pressure
                60%
                                                                    brine to seawater

                                                                               The Ocean1
               1Ocean   or other geological mass

                                                                                            11
OUR PX PLATFORM HAS COME TO DOMINATE LARGE SCALE SWRO DESALINATION

                                           Cumulative Won Mega Project1 Desal Capacity (m3/day)

                               20M
                    Millions

                                                    ERII
                                                    Competitors
                               10M

                               0M
                                          '05     '06      '07     '08     '09     '10      '11     '12   '13   '14   '15   '16   '17   '18   '19   '20

                                                                 Technology Strength = High Margin

         67%                     ERII Gross Margin2                                                   25%             Russell 2000 Industrials

        Our ceramic PX Pressure Exchanger is designed for a 25-year life, needs no maintenance and
             has up to 98% efficiency – unrivalled quality that translates into high profitability

1   Mega Projects produce 50,000 cubic meters or more of water per day; 2YTD 2021 Reported Gross Margin

                                                                                                                                                          12
NEW WATER DEMAND AND TECHNOLOGY SHIFT DRIVING SECULAR SHIFT IN SWRO

                                                                 Annual SWRO Capital Expenditures1

                        $10B                      SWRO Industry                                                  $130M
                                                  ERI Product Revenue2

                                                                                                                         Energy Recovery Revenue
                        $8B
  SWRO Industry Capex

                                                                                                                 $100M
                        $6B
                                                                                                                 $70M
                        $4B
                                                                                                                 $40M
                        $2B

                        $0B                                                                                      $10M
                                        '14             '15      '16     '17   '18    '19     '20    '21   '22

                                                Our growth roughly tracks overall SWRO desal capital spend

 1DesalData              Estimates; 22020-2022 – ERI Estimates

                                                                                                                         13
THE WORLD NEEDS MORE WATER

                                                   Saudi Water Partnership Company has released its
                                                   Seven-Year Statement for 2020-26

Africa’s largest dam powers dreams of prosperity
in Ethiopia – and fears of hunger in Egypt

                                                                         Alaska Villages Run Dry and
                                                                         Residents Worry About a ‘Future
                                                                         of No Water’

                                                                                                    14
EXISTING FRESH WATER SUPPLIES WILL LIKELY NOT MEET FUTURE DEMAND

      60%               >2B People                                30%                26%
 The world will only    1/4 of all people live         Potable water demand     Global population is
have 60% of the water   in high water-stress            expected to increase   expected to grow from
   it needs by 2030          territories                   30% by 2050          7.7B to 9.7B in 2050

                                     All statistics – United Nations

                                                                                              15
TECHNOLOGY SHIFT FROM THERMAL TO SWRO: $0.5B TAM TO MAINTAIN EXISTING CAPACITY

            SWRO Eclipsed Thermal Desalination as Technology of Choice in the 2000s

o Existing thermal capacity should eventually be replaced by SWRO
o We are seeing this demand in our revenue and pipeline today
o SWRO is more efficient, less energy intensive and far more economical
      $1B SWRO retrofit of two Saudi thermal plants will generate OPEX savings of $360M/year1
                              Thermal  vs. SWRO 1
                                             1 (%
                          Thermal vs. SWRO        of Annual Plant Installations)
                           (% of Annual Plant Installations)
                                                   Thermal              SWRO
100%
 80%
 60%                      Thermal                                                          SWRO
 40%           ~23M   m3/day installed capacity
 20%                   operating today
  0%
    1960s         1970s               1980s                  1990s              2000s   2010s     2019
                                                                                                  - '20

    23M cubic meters of thermal capacity equivalent to approximately $0.5 Billion in PX sales2
                                                  1DesalData; 2ERI   Estimate

                                                                                                          16
BUILDING LONG-TERM SUSTAINABLE GROWTH AND VALUE

       Revenue Growth                  Increase Bottom Line                   Sustainability

       New Technologies               Leverage Existing Assets        Environmental Sustainability
 Develop new PX products, widen         Large investments in           Accelerate the sustainability of
       technical aperture            organization not needed for            customer operations
                                               success                via reduced energy consumption

       Diversify Revenue            Invest in Achievable Projects           Align Organization
       Diversify outside of             Realistic commercial          Align organizational aspirations
     desalination, de-risking       timelines, manage complexity          with sustainable product
    revenue and accelerating                  and scope                          aspirations
             growth

   Protect Position in SWRO                   Discipline                Shareholder Transparency
 Invest in improved products and     Disciplined focus on financial     Open communication with
   operations to protect existing      KPIs and marketability of       shareholders on progress and
    strength in swiftly growing               technologies                        plans
        desalination market

                                                                                                    17
LEVERAGING PX TECHNOLOGY FOR SUSTAINABLE DIVERSIFIED GROWTH BEYOND DESALINATION

                           o Manage pressure energy between fluid flows
            Fluids         o Relatively clean seawater to caustic pressure pumping proppant;
                             CO2 gas

                           o   PX Platform – focus on reducing energy consumption
                           o   1,000 - 10,000+ PSI (70 – 700 bar)
            Technology     o   Build off what we know – we are not inventing new markets
                           o   Industrial / Commercial applications
                           o   Maintain first-in-class reliability

                                Financial KPIs                    3 Year Timeline

            KPIs           o 20%+ ROI                   1 year: prove technical validity
                           o 50%+ Gross Margin          2 years: commercial product
                                                        3 years: cash flow positive run rate

  → Cap R&D Expense to limit size and scope of R&D projects: 15-20% of revenue in 2021
  → Discipline: Maintain rigorous commercial hurdles for ROI, Gross Margin, and Timelines
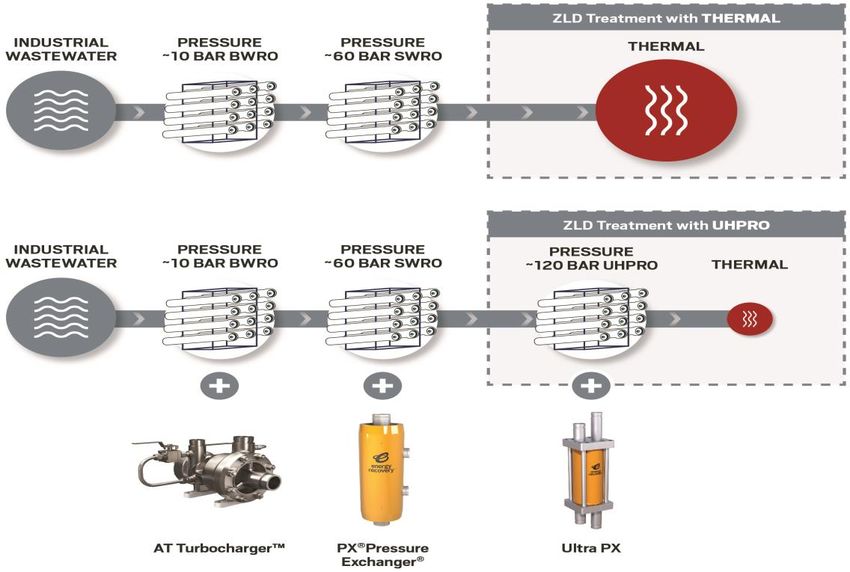
                                                                                                18
ULTRA PX – MITIGATING ENVIRONMENTAL EFFECTS OF INDUSTRIAL WASTEWATER DISCHARGE

o Our PX and Ultra PX can recover up to 60% of wasted energy in the RO process with 93%+
  efficiency
o RO can significantly reduce the thermal component of mitigating the effects of industrial
  wastewater due to superior efficiency, much as it has in SWRO
o Our PX is applicable in nearly all RO treatment methods and in most stages of the treatment
  process

                                       Applying UHPRO to ZLD treatment reduces thermal requirements at the end of the process

                                                                                                                                19
HFC PHASE OUT IN THE HEADLINES

 …we already operate hundreds of facilities (stores        Over the next 15 years, the U.S. is set to slash the
 and distribution centers) that utilize ultra-low GWP      use of powerful greenhouse gases used in
 refrigerants including carbon dioxide (CO2).              refrigerants. That means changes to your grocery
                                                           store, a switch that's already underway in California.

                               New York State Bans Hydrofluorocarbon
                               Refrigerants.

 (HFCs) capacity to warm the atmosphere –                  China’s commitment on HFCs, by ratification of the
 measured as global warming potential – is                 Kigali Amendment, sends key signal of its
 thousands of times greater than carbon dioxide,           commitment to reduce emissions.
 with some being up to 13,850 times more potent.

                                                                                                            20
PX TECHNOLOGY IS A GAME CHANGER FOR THE REFRIGERATION INDUSTRY

       Over 35,000 CO2                  Hurdles to Faster CO2            The PX G enables faster
     Installations Globally              Adoption Remain                      CO2 adoption
   • Conversion to CO2 from HFCs       • Electricity usage of CO2        • Reduces/eliminates
     (current refrigerants) is fully     systems increases in warm         electricity usage disparity
     underway in cool climates           climates as pressures           • Efficiency advantages of the
   • Regulations are driving             increase to support               PX G grows the hotter it gets
     adoption in moderate to             refrigeration cycle               and when refrigeration is
     warm climates                     • This undercuts                    most needed
   • CO2 is a ‘future proof’ green       environmental benefits of       • Helps solve the new CO2
     refrigerant                         CO2 and increases operating       market’s most pressing pain
                                         costs of these systems            point – high electricity costs
                                       • Existing technologies do not
                                         sufficiently address this
                                         hurdle

   The global transition to CO2 refrigeration could translate to ~$1B annual TAM for ERI by 20301

1Energy   Recovery estimates.

                                                                                                      21
PRESSURE EXCHANGER TECHNOLOGY IN ACTION

                                         PX G1300 for CO2 Refrigeration

                             Gas pressurized in PX
                             bypasses the compressor

                                                                                           Compressor
                                                       PX converts low pressure            pressurizes CO2 up to
                                                       gas from evaporator to              1,300 PSI.
      High pressure gas from                           ~1300 PSI, saving energy
      gas cooler is converted in
      PX to low pressure to
      create cold

                                   We have expanded the aperture of the PX technology
                                    to successfully compress gas, allowing for efficient
                                             energy transfer in refrigeration2

                                                                                                             22
WE HAVE COME FAR TO UNLOCKING A LARGE MARKET WITH THE PX G

Current status of the PX G1300
o Successfully tested across a range of
  temperatures in our full refrigeration test-
  loop in California
o Control system developed to manage it in
  operations
o Building our first commercial ready system

                                                             23
VORTEQ

VorTeq seeks to protect pumps from abrasive proppant
o Increase safety of operations
o Reduce emissions, energy intensity of pump operations
o Decrease pump failures
o Lower maintenance, capital costs

Status of Commercialization
o Completed multiple frac stages at live wells in 2021
o Remaining hurdle
      Optimize cartridge life before repairs or
       replacement
            Highest operational cost to ERI

                                                          24
DISCIPLINED FOCUS DRIVING TOP AND BOTTOM-LINE GROWTH

                                                           Drive Diversified PX Top Line Growth1

                              21% Average Annual Growth                                                 Projected Desal
                                                                                                        Revenue Growth
                                                                                                                  25%
                                                                                                         10%
                                                                                            27%                               With successful R&D efforts,
                                                           5%              19%                                            z
     44%                14%               17%                                                                                    diversified growth by
                                                                                                                                applying PX technology
                                                                                                                               across multiple industries

     2015               2016             2017             2018             2019             2020        2021      2022        2023      2024        2025

                                                                                Projections          Actuals

                                       Maintain Gross Margin and Manage OPEX to Drive EBITDA

                          OPEX, % of Revenue1,2                                       ERII
                                                                                                                     EBITDA Margin1,2
                                                                                      Russell 2000 Industrials
                                                                                                       12%
    19%

 2017 2018 2019 2020 2021 2022 2023 2024 2025                                                        2017 2018 2019 2020 2021 2022 2023 2024 2025

 12020   – 2025 are estimated projections; 2Excluding Schlumberger License and Development Revenue

                                                                                                                                                        25
Thank You
CONTACT US

     James Siccardi, VP, Investor Relations        Energy Recovery, Inc.

          +1.832.474.7628 | Mobile                 1717 Doolittle Drive
        jsiccardi@energyrecovery.com            San Leandro, CA 94577, USA

   Lionel McBee, Sr. Mgr., Investor Relations      energyrecovery.com

          +1.832.334.3685 | Mobile
        limcbee@ernergyrecovery.com

          ESG@energyrecovery.com
             (for ESG inquiries)

                                                                             27
You can also read