Ferroglobe PLC Presentation at CRU Silicon Metal Conference Lisbon - November 14, 2018

Page created by Hazel Obrien
 
CONTINUE READING
Ferroglobe PLC Presentation at CRU Silicon Metal Conference Lisbon - November 14, 2018
Ferroglobe PLC Presentation at
Advancing Materials Innovation
                                 CRU Silicon Metal Conference Lisbon
       NASDAQ: GSM               November 14, 2018

                                     -0-
Forward-Looking Statements and Non-IFRS Financial Metrics
This presentation contains forward-looking statements within the meaning of Section 27A of the United States Securities Act of 1933, as amended, and Section 21E of the United States Securities Exchange Act of
1934, as amended. Forward-looking statements are not historical facts but are based on certain assumptions of management and describe our future plans, strategies and expectations. Forward-looking statements
can generally be identified by the use of forward-looking terminology, including, but not limited to, "may," “could,” “seek,” “guidance,” “predict,” “potential,” “likely,” "believe," "will," "expect," "anticipate,"
"estimate," "plan," "intend," "forecast," or variations of these terms and similar expressions, or the negative of these terms or similar expressions.

Forward-looking statements contained in this presentation are based on information currently available to Ferroglobe PLC (“we,” “our,” “Ferroglobe,” the “Company” or the “Parent”) and assumptions that we
believe to be reasonable, but which are inherently uncertain. As a result, our actual results, performance or achievements may differ materially from those expressed or implied by these forward-looking
statements, which are not guarantees of future performance and involve or implicate known and unknown risks, uncertainties and other factors that are, in some cases, beyond our control.

We caution you that all such statements, as well as forward-looking statements made orally in the presentation hereof, involve or implicate myriad risks and uncertainties, including without limitation, risks that
Ferroglobe will not successfully integrate the businesses of Globe Specialty Metals, Inc. and Grupo FerroAtlántica SAU, that we will not realize estimated cost savings and/or the value of certain tax assets, synergies
and growth, and/or that such benefits may take longer to realize than expected. Important factors that may cause actual results to differ include, but are not limited to: (i) unanticipated costs of integration,
including operating costs, customer loss and business disruption being greater than expected; (ii) our ability to optimize organizational and governance structure; (iii) our ability to hire and retain key personnel; (iv)
regional, national or global political, economic, business, competitive, and market conditions; (v) changes in the cost and/or availability of raw materials or energy; (vi) competition in the metals and foundry
industries; (vii) environmental and other regulatory risks; (viii) our ability to identify and evaluate liabilities associated with acquired assets prior to their acquisition; (ix) our ability to manage operational risks
including industrial accidents and natural disasters; (x) our ability to manage international operations; (xi) changes in technology; (xii) our ability to acquire or renew permits and approvals; (xiii) changes in law
and/or regulation and/or compliance costs affecting Ferroglobe; (xiv) conditions in the credit markets; (xv) risks associated with assumptions made in connection with critical accounting estimates and legal
proceedings; (xvi) the risks of currency fluctuations and foreign exchange controls; and (xvii) the risks of local, regional and international unrest, economic downturn, tax assessments, tax adjustments, and changes
in tax rates. The foregoing list is not exclusive or exhaustive.

You should carefully consider the foregoing factors and the other risks and uncertainties that may affect our business, including those described in the “Risk Factors” section of Ferroglobe’s Registration Statement
on Form F-1, Annual Reports on Form 20-F, Current Reports on Form 6-K and other documents we file from time to time with the United States Securities and Exchange Commission. We do not give any assurance
(1) that we will achieve our expectations, or (2) concerning any result or the timing thereof, in each case, with respect to any regulatory action, administrative proceedings, government investigations, litigation,
warning letters, consent decrees, cost reductions, business strategies, earnings or revenue trends or future financial results. Forward-looking financial information and other non-historical metrics presented herein
represent our key goals and are not intended as guidance or projections for the periods presented herein or any future periods.

We do not undertake or assume, and expressly disclaim, any obligation to update publicly any of the forward-looking statements in this presentation to reflect actual results, new information or future events,
changes in assumptions or changes in other factors affecting forward-looking statements. If we update one or more forward-looking statements, no inference should be drawn that we will make additional updates
with respect to those or other forward-looking statements. We caution you not to place undue reliance on any forward-looking statements, which are made only as of the date of this presentation.

EBITDA, adjusted EBITDA, adjusted diluted profit (loss) per ordinary share and adjusted profit (loss) attributable to Ferroglobe are non-IFRS financial metrics that, we believe, are pertinent measures of Ferroglobe’s
success. The Company has included these financial metrics to provide supplemental measures of its performance. We believe these metrics are useful because they eliminate items that have less bearing on the
Company’s current and future operating performance and highlight trends in its core business that may not otherwise be apparent when relying solely on IFRS financial measures.

For additional information, including a reconciliation of the differences between such non-IFRS financial measures and the comparable IFRS financial measures, please refer to our periodic filings with
the U.S. Securities & Exchange Commission, available in the SEC Filings section under the Investors tab on our website, www.ferroglobe.com.                                                          -1-
Topics for discussion

   Introduction to Ferroglobe

   Near-term observations on the silicon metal market

   Medium-term outlook supported by strong fundamentals

                                                          -2-
Introduction to Ferroglobe
Ferroglobe is a leading global player in advanced materials

                    Global leader in an attractive growing industry

                    Best in class operations with unique competitive advantages

                    Entrepreneurial culture with strong growth track record

                    Unrivaled technology development and know-how

                    Disciplined financial management
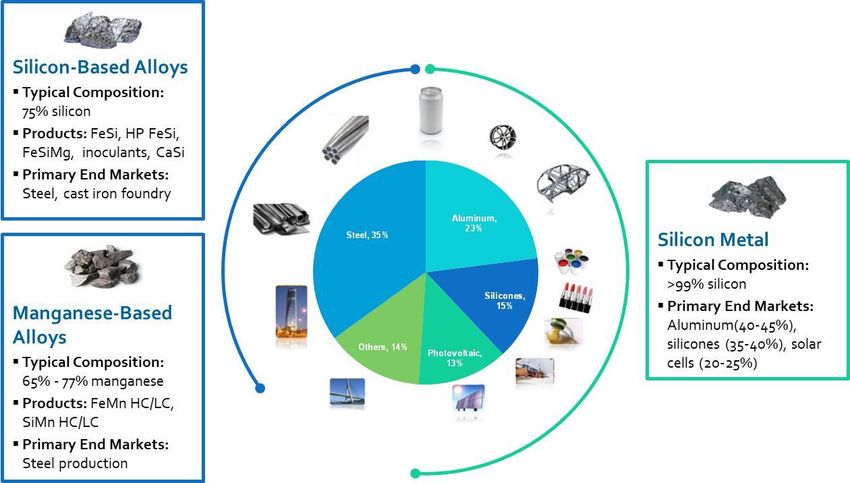
                                                                                  -4-
Global leader in niche, high-value markets

               The leading player in silicon metals…                    …and one of the leading ferroalloys producers
Silicon Metal Capacity (000, mt)                               Other Ferroalloys Capacity (000, mt)

    341                                                             2,145

             207                                                                     1,260
                      164
                                                                                             879
                                                                                                   710   670
                                96
                                           62   60   53                                                        355
                                                          48                                                         250

                                                                      Privat Group
      Source: Ferroglobe, public filings                                                                                   -5-
Diverse product mix provides exposure to a variety of end markets

                                                              -6-
Unparalleled global operations and diversified product offering
provides Ferroglobe and its customers unique optionality
Factories
                                                                                                    Production flexibility
Mining
                                                                                                   Production optionality
Energy
                                                           London, UK                                Natural F/X hedge

                                                                                                   Broadest product range

                                                                                                   Global customer reach

                                                                                                    Low cost operations

                                                                                                    High barriers to entry

                                                         Capacity by Geography
               (000, mt)        Europe   North America             South America   Africa   Asia           Total
Silicon                          178          91                         -          72       -              341
Ferrosilicon / Foundry Alloys    225         120                        109         112      -              566
Manganese-based Alloys           623           -                        34           -       -              657
Other Silicon-Based Alloys       27            -                        10           -       -              37
Total                                                                                        -             1,601

                                                                                                                        -7-
Ferroglobe has amongst the broadest range of capabilities in
silicon metal and ferroalloys

    Broadest range of products

    Diversified and flexible production footprint

    Experience in worldwide international logistics

    Unrivalled quality and reliability

    Track record for innovation and finding customized solutions for our customers

                                                                                     -8-
Near-term observations on the silicon metal market
Key messages

   Macroeconomic picture remains positive

   Trade war: more rhetoric than reality to date

   Trade case ‘overhang’ has passed ― corrections to supply, demand, and pricing

   Recent headlines need to be put into historical perspective

   Ferroglobe will continue to remain disciplined ― swift actions as market evolves

                                                                                      - 10 -
Global macroeconomic view remains positive with
steady growth forecasted for 2019
         Real GDP Growth, by Country Group                Global Growth Outlook (% Change in GDP)

 Source: IMF, World Economic Outlook, Oct. 2018
 Note: Grey area denotes projections

                                                  Source: IMF, World Economic Outlook, Oct. 2018
                                                                                                    - 11 -
Historical context for the recent evolution in SiMe prices

                       Silicon Metal                  Price recovery in 2017
                                                       ‘amplified’ due to
                                                       preliminary trade case
                                                       outcome

                                                      Capacity creep as pricing
                                                       environment improved in
($/t)

                                                       2017, including emerging
                                                       markets benefiting from a
                                                       strong USD

                                                      ‘Overhang’ impact of trade
                                                       case that lead to surplus
                                                       inventories by customer in
                                                       advance of final outcome

        Source: CRU
                                                                                - 12 -
Global silicon supply significantly exceeded demand
during Q2 and Q3…

                                     Quarter over Quarter Change in Global Silicon Metal Supply/Demand

       100

           75

           50
(‘000 t)

           25

            0

           -25

           -50

           -75     2Q-15   3Q-15   4Q-15   1Q-16   2Q-16     3Q-16    4Q-16     1Q-17   2Q-17    3Q-17   4Q-17   1Q-18   2Q-18   3Q-18

                                                           Global Consumption    Global Supply

            Source: CRU

                                                                                                                                         - 13 -
($/t)

                                                                                                                             3,550

                                                                                     2,550
                                                                                                                     3,350
                                                                                                                                     3,750

                                                                             2,350
                                                                                             2,750
                                                                                                     2,950

                                                     1,750
                                                             1,950
                                                                                                             3,150

                                                                     2,150

Source: CRU
                                         Oct. 2008
                                         Feb. 2009
                                         Jun. 2009
                                         Oct. 2009
                                         Feb. 2010
                                         Jun. 2010
                                         Oct. 2010
                                         Feb. 2011
                                         Jun. 2011
                                         Oct. 2011
                                         Feb. 2012
                                         Jun. 2012
                                         Oct. 2012
                                         Feb. 2013
                                         Jun. 2013

              US (98.5% Si, 5-5-3 EXW)
                                         Oct. 2013
                                         Feb. 2014
                                         Jun. 2014
                                                                                                                                             Silicon Metal Pricing ― U.S.

                                         Oct. 2014
                                         Feb. 2015
                                         Jun. 2015
                                         Oct. 2015
              10 Year Average

                                         Feb. 2016
                                         Jun. 2016
                                         Oct. 2016
                                         Feb. 2017
                                         Jun. 2017
                                         Oct. 2017
                                                                                                                                                                            reached near historical averages in recent months

                                         Feb. 2018
                                         Jun. 2018
                                         Oct. 2018
                                                                                                                                                                            …coupled with stockpiled inventory, the index price in the U.S.

 - 14 -
Source: CRU
                                                                                                        ($/t)

                                                                                                                                            3,350
                                                                                                                                                       3,550

                                                                                            2,350
                                                                                                    2,550
                                                                                                                          2,950
                                                                                                                                                               3,750

                                                                    1,950
                                                                                                                2,750
                                                                                                                                  3,150

                                                            1,750
                                                                                    2,150
                                               Oct. 2008
                                               May 2009
                                              Dec. 2009
                                                Jul. 2010
                                               Feb. 2011
                                              Sept. 2011
                                               Apr. 2012
                                              Nov. 2012
                                               Jun. 2013

        EU (98.5% Si, 5-5-3 DDP)
                                               Jan. 2014
                                              Aug. 2014
                                               Mar. 2015
                                                                                                                                                                         Silicon Metal Pricing ― Europe

                                               Oct. 2015
                                               May 2016
                                               Dec. 2016
                                                Jul. 2017
                                                                                                                                                                                                          year averages, respectively

        10 Year Average
                                               Feb. 2018
                                              Sept. 2018

                                                                                                                 ($/t)
                                                                                                                        2,050
                                                                                                                                                    2,450
                                                                                                                                                                2,650

                                                                            1,450
                                                                                            1,650
                                                                                                        1,850
                                                                                                                                    2,250

                                                            1,250

                                              Oct. 2008
                                              Apr. 2009
                                              Oct. 2009
                                              Apr. 2010
                                              Oct. 2010
                                              Apr. 2011
                                              Oct. 2011
                                              Apr. 2012
                                              Oct. 2012
                                              Apr. 2013
                China (98.5% Si, 5-5-3 FOB)

                                              Oct. 2013
                                              Apr. 2014
                                              Oct. 2014
                                              Apr. 2015
                                              Oct. 2015
                                                                                                                                                                        Silicon Metal Pricing ― China

                                              Apr. 2016
                                              Oct. 2016
                                              Apr. 2017
                                              Oct. 2017
                10 Year Average

                                              Apr. 2018
                                              Oct. 2018
                                                                                                                                                                                                          …while the European and China indices dropped below the ten

- 15 -
Catalysts for near-term pricing recovery

    Trade case impact has passed ― lower inventory stockpiles by end users

    Strong demand fundamentals across the chemical, aluminum and photovoltaic sectors

    Limited new capacity to enter the market

    Continued environmental shutdowns in China; greater internal consumption

    Increasing input costs pressuring margins ― provides an inherent pricing floor

    Quicker market discipline and reactivity ― curtailments, idling capacity

                                                                                        - 16 -
After surplus inventory overhang in 2018, CRU is projecting a
            global balance deficit in early 2019…
                                             Global Silicon Metal ― Production vs. Consumption

           900
                                               799                                                                     813          790
                                776    757                                                             772       769          773              765
(‘000 t)

           800                                                   738
                    699 723                            704                  720      693   707
           700
           600
                      1Q-18      2Q-18          3Q-18e            4Q-18e              1Q-19e           2Q-19e          3Q-19e       4Q-19e

                                                         Global Production        Global Consumption

                                                  Global Silicon Metal ― Surplus / (Deficit)
           150
                                                  95
           100
(‘000 t)

                                                                                                                         40
           50                     19                                   19                                                                 25
                                                                                                             4
            0

                          -24                                                          -14
           -50
                      1Q-18      2Q-18           3Q-18             4Q-18               1Q-19             2Q-19           3Q-19       4Q-19

            Source: CRU
                                                                                                                                                     - 17 -
…however, CRU underestimates the capacity changes
made by Ferroglobe
                                      Ferroglobe Silicon Metal Capacity

                250
                                    -40k tons
                                                        Silicon Metal capacity reductions:
                      218
                                                        • Selma, AL (2 furnaces)
                                                        • Beverly, OH (1 furnace)
                200
                             178                        • Château-Feuillet, France: 2 furnaces
                                                        • Laudun, France: 1 furnace

                150
     (‘000 t)

                                                  127               -36k tons

                100                                         91
                                                                                 72            72

                 50

                  0
                        Europe                    North America                       Africa

                                   March 2018    Pro Forma for planned changes

                                                                                                    - 18 -
Increasing input and production costs will tend to force price
 increases
                                   115                                                                                             150
                                                Estimated world SiMe Production Cost Index                                                            SiMe Pricing vs Production Cost Index
  Coal
                                                                                                                                   140
                                   110
                                                                                                                                   130

 Quartz
             Index = 100 (1Q-16)

                                                                                                             Index = 100 (1Q-16)
                                   105                                                                                             120

                                                                                                                                   110
  Oil /
 Natural
  Gas                              100
                                                                                                                                   100

                                                                                                                                   90
                                   95
Electrodes
                                                                                                                                   80
                                                                                                                                         1Q-16 2Q-16 3Q-16 4Q-16 1Q-17 2Q-17 3Q-17 4Q-17 1Q-18 2Q-18 3Q-18

                                                                                                                                                            CRU - US Spot Price ($/t)
                                   90
                                         1Q-16 2Q-16 3Q-16 4Q-16 1Q-17 2Q-17 3Q-17 4Q-17 1Q-18 2Q-18 3Q-18                                                  SiMe Production Cost Index ($/t)

                                                                                                                                                                                                    - 19 -
Medium-term outlook for silicon metal
Steady global silicones consumption growth at levels
beyond GDP
                           World Silicon Demand Driven by Silicones Production
                                                                                                          Recent growth from global
            YoY
           Growth
                                  2.9%        5.8%        6.7%         7.5%         7.3%        5.7%       economic expansion expected
                                                                                                           to continue
          2,400                                                                                2,253
          2,200                                                                     2,133                 Recent consumption gains
                                                                       1,987
          2,000                                           1,848                                            constrained by production
                                              1,732                                                        capacity
(‘000s)

          1,800                   1,637
                       1,591
          1,600
                                                                                                          Announced expansions
          1,400
                                                                                                           support additional growth
          1,200
                                                                                                           expectations
          1,000
                       2017       2018e       2019e      2020e         2021e       2022e       2023e
                                                                                                          New applications and product
           Source: CRU
                                                                                                           developments
                                           Major Silicones Demand Drivers
                                               Growth in automotive and           Personal care and
               Global population growth
                                                    transportation               consumer products
                  Housing and commercial         Increasing consumer           Advancements in medical
                       construction                   electronics                    equipment
                                                                                                                                       - 21 -
Despite recent Chinese reform, the global demand for
       photovoltaic industry expected to remain solid
                                     Global Photovoltaic Demand
                                                                                                                  Photovoltaic installations doubled
                                                                                                                   between 2015 and 2017
                                                                                      Rebound in demand
                                                                                      expected ― lower PV
                                                                                    prices make installations
                                                                                                                  Drop in 2018 PV installations
                                                                                         more attractive           following Chinese reform
                                                                                                                   announcements in June, especially
                                                                                                                   cutbacks in polysilicon production
       150                                                Chinese subsidy policy changes

       125                                                                                                        Global polysilicon output expected
       100                                                                                                         to rebound, as lower rates of
                                                                                                                   installation in China, US, and
(GW)

        75
                                                                                                                   Japan is offset by rapid increases
       50                                                                                                          in India and other countries
       25
                                                                                                                  Grid parity and ease of installation
        0
              2009     2010   2011   2012   2013   2014    2015     2016     2017     2018e     2019e    2020e
                                                                                                                   will make solar the energy of
                                                                                                                   choice in the coming years
             Source: IHS

                                                                                                                                                    - 22 -
Aluminum demand expected to continue delivering steady
    growth for silicon metal
               Global Finished Aluminum Demand Outlook                       Global stocks as days of consumption
                                                                        Lowest stocks to consumption ratio since Sept.2008
                                     2017   2018e    2019e   2020e

         North America (mm, tons)     6.8      6.8     6.9      7.1
          (Y/Y Growth)                      -0.5%    2.5%     1.8%

         Europe (mm, tons)            9.2      9.5     9.6      9.8
          (Y/Y Growth)                       3.0%    1.7%     1.5%

         China (mm, tons)            34.9     36.7    38.4     40.0
          (Y/Y Growth)                       5.2%    4.5%     4.1%

         World (mm, tons)            63.8    66.7     69.0    71.3
          (Y/Y Growth)                       4.5%     3.5%    3.3%

                                             Trade war impact: more rhetoric than reality

            Despite the imposition of wide-ranging tariffs and large anti-dumping duties on Chinese foil and sheet, Chinese
                               aluminium exports have increased substantially in 2018 (year-over-year)
Source: AME Metals & Mining
                                                                                                                              - 23 -
Chinese domestic demand growth coupled with supply
       curtailments is favorable to the global landscape
            Chinese Silicon Production and Exports                Chinese Exports as % of Production

                                                     45%

                                                     43%

                                                     41%

                                                     39%

                                                     37%
(‘000 t)

                                                     35%

                                                     33%

                                                     31%

                                                     29%

                                                     27%

                                                     25%
                                                           2016   2017   2018e 2019e 2020e 2021e 2022e 2023e

                                                                         Export share of production (%)
                                                                                                               - 24 -
Final remarks

    Overall fundamentals for silicon metal are strong worldwide:
    ―   Solid demand momentum
    ―   Supply tightness
    ―   Cost inflation impacting marginal producers

    At current prices certain producers (specifically new entrants) unlikely to cover
    true cost of production, including depreciation and financing costs

    Producers forced to remain disciplined and react to changing market dynamics:
    balancing production vs. commercial strategies vs. profitability

    Ferroglobe is uniquely positioned to serve a variety of customers, products and
    geographies and will apply this flexibility to switch production of products to the
    most profitable locations
    Producing at a loss is not an option!
                                                                                          - 25 -
Ferroglobe PLC Presentation at
                                 CRU Silicon Metal Conference Lisbon
Advancing Materials Innovation

       NASDAQ: GSM               November 14, 2018

                                     - 26 -
You can also read