Second Quarter 2021 Conference Call - August 5, 2021 - Premium Brands ...

Page created by Jeanette Mckinney
 
CONTINUE READING
Second Quarter 2021 Conference Call - August 5, 2021 - Premium Brands ...
Second Quarter 2021
  Conference Call
    August 5, 2021
Second Quarter 2021 Conference Call - August 5, 2021 - Premium Brands ...
Disclaimer

    This presentation is not intended to form the basis of any investment decision and should not be considered as a recommendation by
    Premium Brands Holdings Corporation (the “Company”) or any other person in relation to the Company’s business or the securities
    of the Company. This presentation is not, and nothing in it should be construed as, an offer, invitation or recommendation in respect
    of the securities of the Company, or an offer, invitation or recommendation to sell, or a solicitation of an offer to buy, any of the
    Company’s securities in any jurisdiction. Neither this presentation nor anything in it shall form the basis of any contract or
    commitment. This presentation is not intended to be relied upon as advice to investors or potential investors and does not take into
    account the investment objectives, financial situation or needs of any investor. All investors should consider such factors in
    consultation with a professional advisor of their choosing when deciding if an investment is appropriate.

Extraordinary Times Extraordinary Team                                                                                                      2

                                                                       2
Second Quarter 2021 Conference Call - August 5, 2021 - Premium Brands ...
Forward Looking Statements

  This presentation contains forward looking statements with respect to the Company, including its business operations, strategy and
  financial performance and condition, proposed acquisitions and plans and objectives of or involving the Company. While management
  believes that the expectations reflected in such forward looking statements are reasonable and represent the Company’s internal
  expectations and belief as of the date of this presentation, there can be no assurance that such expectations will prove to be correct as
  such forward looking statements involve unknown risks and uncertainties beyond the Company’s control which may cause its actual
  performance and results in future periods to differ materially from any estimates or projections of future performance or results expressed
  or implied by such forward looking statements. Forward looking statements generally can be identified by the use of the words “may”,
  “could”, “should”, “would”, “will”, “expect”, “intend”, “plan”, “estimate”, “project”, “anticipate”, “believe” or “continue”, or the negative thereof
  or similar variations. Forward looking statements in this presentation include statements with respect to the Company’s expectations
  regarding: (i) the Company’s sales ; (ii) the Company’s operational and business improvement initiatives; (iii) the Company's organic
  growth; (iv) labor challenges; (v) the Company’s projected revenues and EBITDA; (vi) the Company’s acquisition pipeline; (vii) the
  Company’s expectations relating to COVID-19; (viii) the Company's projected investment income; and (ix) the expected rate of return on
  the Company’s acquisitions and capital expenditures.

  Forward looking statements are based on a number of key expectations and assumptions made by the Company, including, without
  limitation the expectations and assumptions outlined in the Company’s MD&A for the 13 and 52 weeks ended December 26, 2020, a copy
  of which is filed electronically through SEDAR and is available online at www.sedar.com. Although the forward looking statements
  contained in this presentation are based on what the Company’s management believes to be reasonable assumptions, the Company
  cannot assure investors that actual results will be consistent with such forward looking statements.

  Forward looking statements involve significant risks and uncertainties and should not be read as guarantees of future performance or
  results. Factors that could cause actual results to differ materially from the Company’s expectations are outlined in the Company’s MD&A
  for the 13 and 52 weeks ended December 26, 2020. Readers are cautioned that the foregoing risks and uncertainties are not exhaustive.

  Forward looking statements reflect management’s current beliefs and are based on information currently available to the Company.
  Unless otherwise indicated, the forward looking statements in this presentation are made as of the date of this presentation and, except as
  required by applicable law, will not be publicly updated or revised. This cautionary statement expressly qualifies the forward looking
  statements in this presentation.

  By delivery of this presentation, the Company is not making any representation or warranty, express or implied, as to the fairness,
  accuracy, correctness, completeness or reliability of the information, opinions or conclusions expressed herein. By accepting this
  presentation, the recipient agrees that the Company shall not have any liability for any representation or warranty, express or implied,
  contained in, or for any omission from, this presentation.

Extraordinary Times Extraordinary Team                                                                                                                    3

                                                                             3
Second Quarter 2021 Conference Call - August 5, 2021 - Premium Brands ...
Today’s Presenters

     •   George Paleologou
         President & Chief Executive Officer

     •   Will Kalutycz
         Chief Financial Officer

Extraordinary Times Extraordinary Team         4
Second Quarter 2021 Conference Call - August 5, 2021 - Premium Brands ...
Key Messages

•   Record Q2 results despite ongoing challenges including acute commodity inflation, labor shortages and supply
    chain disruptions

•   Foodservice channel demand back to pre-pandemic levels while QSR channel demand is now running well ahead

•   Seafood platform benefited from the return of foodservice demand in North America and delivered record growth
    and EBITDA

•   Clearwater continues to outperform plan and is well-positioned to deliver record results for the year
      •   Results driven by strong pricing and excellent cost management
      •   North American branding, marketing and product innovation strategies gaining traction
      •   Co-ordination initiatives with PB ecosystem on track

•   Sandwich platform is benefiting from robust demand in the QSR and retail channels
      •   New capacity being considered to meet future demand
      •   Charcuterie assembly business benefiting from favorable consumer trends
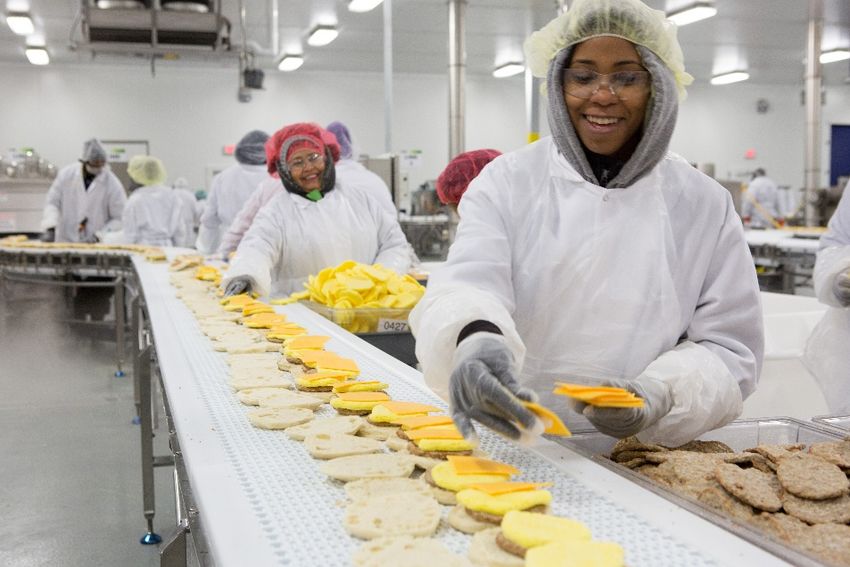
      •   Labor shortages continue to be a major challenge
      •   Progress made on several efficiency and automation initiatives

•   Acquisition activity remains very robust

•   Published 2021 ESG report titled “Healthy Planet, Healthy Food, Healthy People”

Extraordinary Times Extraordinary Team                                                                              5
Second Quarter 2021 Conference Call - August 5, 2021 - Premium Brands ...
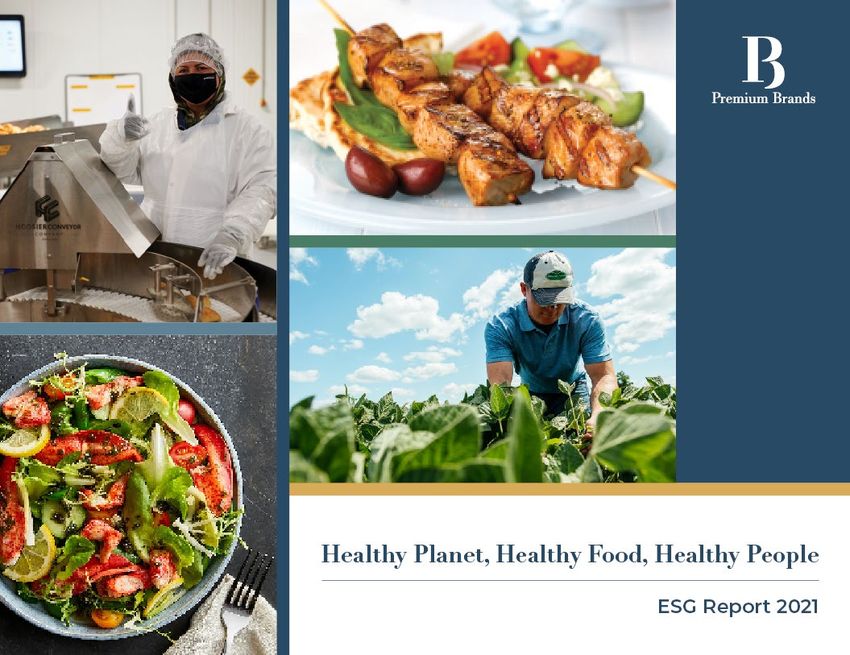
Acquisition Opportunities (millions of dollars except transactions)

Platform           Advanced           Active           Early Stage      Opportunity          Inactive              Total

               #         Sales    #            Sales   #       Sales   #        Sales   #           Sales     #            Sales

Seafood        1          130     2             90     7       1,006   4         277    5               339   19           1,842

Distribution   3          43      2            160     4       1,070   1         873    4               125   14           2,271

Protein        2          121     1             20     12       936    7         469    16          1,751     38           3,297

Sandwich       -              -   -              -     1         13    2        1,433   2               524   5            1,970

Bakery         -              -   2             10     3        238    2         63     4               230   11            541

Culinary       1          25      -              -     1         30    5         155    -                -    7             210

               7          319     7            280     28      3,293   21       3,270   31          2,969     94           10,131

  Extraordinary Times Extraordinary Team                                                                                            6
Second Quarter 2021 Conference Call - August 5, 2021 - Premium Brands ...
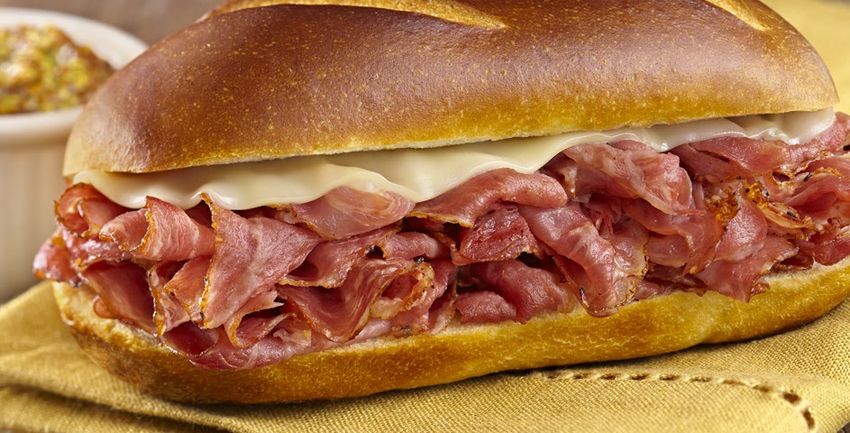
Extraordinary Times Extraordinary Team   7
Second Quarter 2021 Conference Call - August 5, 2021 - Premium Brands ...
Extraordinary Times Extraordinary Team   8
Second Quarter 2021 Conference Call - August 5, 2021 - Premium Brands ...
Extraordinary Times Extraordinary Team   9
Second Quarter 2021 Conference Call - August 5, 2021 - Premium Brands ...
Extraordinary Times Extraordinary Team   10
Q2-2021 Financial Update

Extraordinary Times Extraordinary Team      11
Quarter Sales Performance                                       (millions of dollars except percentages)

                          Long-term targeted organic
                         volume growth rate (4% - 6%)
                                                                                  50.0%
      1,400.0                                                           1,286.3                  Drivers
                                                              1,234.7
                                                                                  40.0%          •   Organic volume growth – $89.7
      1,200.0                                    1,109.0
                                                                                                 •   COVID recovery – $84.6m
                            945.4      976.6
      1,000.0                                                                     30.0%          •   Acquisitions of Allseas, Starboard,
                                                                                                     Distribution Côte-Nord,
                 761.5                                                                               Confederation Freezers and
       800.0
                                                                                  20.0%              Global Gourmet – $83.7m
                                                                                                 •   Selling price inflation – $58.2m
       600.0
                                                                                  10.0%
                                                                                                 Challenges
       400.0
                                                                                                 •   A stronger CAD, which resulted in
                                                                                  0.0%               lower translated values for US
       200.0                                                                                         based businesses – $58.2m

            -                                                                     -10.0%         Lost opportunities
                 2018       2019       2020       2020N        2021     2021N
                                                                                                 •   Capacity constraints
           Covid Impact                                 Revenue (LHS)
           Growth rate (RHS)                            Organic Volume Growth rate (RHS)

Extraordinary Times Extraordinary Team                                                                                                     12
Major Organic Growth Drivers

         Seafood                    Distribution                    Protein                    Sandwich                     Bakery               Culinary

•   Ready lobster             •   Frandon capacity         •   US meat snack sticks     •   Leveraging IP and      •   US expansion      •   Global Gourmet /
    procurement                   expansion                •   Italian charcuterie in       North American         •   Stuyver’s plant       Gourmet Chef
    initiatives               •   Viandex expansion            US and Canada                leading capacity to        expansion             synergies
•   CFG (aka GTA                  initiatives                                               grow in the grocery,                         •   Costco international
                                                           •   US burger strategy                                  •   COVID recovery
    initiative) foodservice                                                                 c-store and QSR
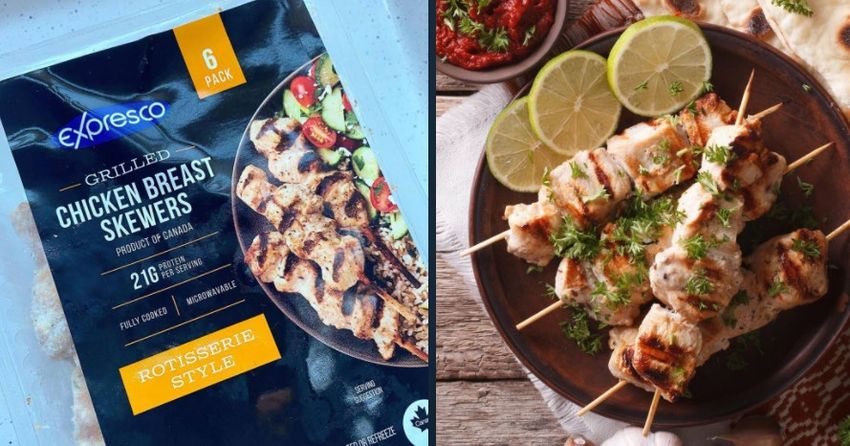
                              •   IMS geographical         •   Pro2Go snack line                                                         •   US expansion
    and retail initiatives                                                                  channels
                                  expansion into ON                                                                                      •   Seafood counter
    including protein and                                  •   Expresco new             •   Supporting legacy
                              •   National healthcare          foodservice skewers                                                           solutions including
    branded product                                                                         customers’ growth
                                  strategy                                                                                                   meal kits
    strategies                                             •   Concord Chicken          •   Charcuterie
                              •   Non-distributive             Bites                                                                     •   Clearwater synergies
•   New Saco facility                                                                       packaging
                                  foodservice sales of
•   Maximum DSD                                            •   US fresh kabobs          •   COVID recovery
                                  differentiated protein
    solutions for grocers         products                 •   Expansion of DSD
•   Maximum US                                                 network into central
                              •   COVID recovery
    expansion                                                  Canada
                              •   Clearwater synergies
•   Branded value-added                                    •   Lou’s RTE meals
    initiatives                                            •   COVID recovery
•   Allseas retail sushi
    program
•   National retail
    seafood programs
•   COVID recovery
•   Clearwater synergies

     Extraordinary Times Extraordinary Team                                                                                                                         13
COVID Sales Impact (millions of dollars)
                                           Recovered COVID Sales Impact

                                                                                  90.9
     90.0                                                                                            84.6

                                                                           69.3
     70.0                                         65.5

     50.0

     30.0    25.4

                                    15.3

     10.0                                                      2.9

    (10.0)                                                                                 (7.2)
                        (10.1)

    (30.0)
              Premium Food Distribution                  Specialty Foods                 PBH Total

                                               Foodservice    Retail   Total

Extraordinary Times Extraordinary Team                                                                      14
COVID Sales Impact (millions of dollars)
                                                                                               Premium Food Distribution
                                                                            20.0

                                                                              -
                                                                                      (9.0)
                                                                                                        (23.7)             (19.2)
                                                                                                                                     (31.4)
                                                                           (20.0)                                (42.8)
                                                                                              (46.7)
                               PBH Consolidated
                                                                       $
                                                                           (40.0)
         20.0
                  6.6
           -
                                                                           (60.0)
        (20.0)                     (33.6)
                                            (52.8)   (45.8)   (47.9)
        (40.0)
                                                                           (80.0)
        (60.0)                                                                       Q1-20    Q2-20     Q3-20    Q4-20    Q1-21     Q2-21
                         (132.4)
   $    (80.0)
       (100.0)                                                                                         Specialty Foods
                                                                             20.0
       (120.0)
                                                                                      15.6
       (140.0)                                                                 -
                                                                                                         (9.9)   (10.0)
       (160.0)                                                                                                                      (16.4)
                                                                                                                          (26.6)
                 Q1-20   Q2-20     Q3-20    Q4-20    Q1-21    Q2-21         (20.0)

                                                                       $    (40.0)            (85.7)

                                                                            (60.0)

                                                                            (80.0)

                                                                           (100.0)
                                                                                     Q1-20    Q2-20     Q3-20    Q4-20    Q1-21     Q2-21

Extraordinary Times Extraordinary Team                                                                                                        15
Weekly Sales Trend

         120,000

         100,000

          80,000
$000's

          60,000

          40,000

          20,000

               -
                                       11

                                            13

                                                  15

                                                        17

                                                             19

                                                                  21

                                                                       23

                                                                            25

                                                                                 27

                                                                                        29

                                                                                             31

                                                                                                  33

                                                                                                       35

                                                                                                            37

                                                                                                                 39

                                                                                                                      41

                                                                                                                           43

                                                                                                                                45

                                                                                                                                     47

                                                                                                                                          49

                                                                                                                                               51
                   1

                       3

                           5

                               7

                                   9

                                                                             Week #

                                                 2019 PBH Total        2020 PBH Total         2021 PBH Total

     Extraordinary Times Extraordinary Team                                                                                                         16
Revenue Trend (millions of dollars except percentages)

                                                                 2010 to 2021 TTM CAGR is 22.2%
                                                                                                                                                      70.0%
   5,000.0                                                                                                                                  4,585.6

                                                                                                                          4,269.0 4,401.8             60.0%
                                                                                                                4,068.9
                  Long-term targeted
   4,000.0       growth rate (6% - 8%)
                                                           Revenue guidance of                        3,649.4
                                                            $4.70b to $4.85b                                                                          50.0%

                                                                                            3,025.8
   3,000.0                                                                                                                                            40.0%

                                                                                  2,198.3
                                                                                                                                                      30.0%
                                                                       1,857.5
   2,000.0
                                                             1,484.5
                                                   1,221.8                                                                                            20.0%
                               960.1     1,043.0
   1,000.0            794.3
             535.2                                                                                                                                    10.0%

         -                                                                                                                                            0.0%
             2010     2011      2012      2013      2014      2015      2016       2017      2018      2019      2020     2020N 2021 TTM     2021
                                                                                                                                            TTM-N

                        Revenue (LHS)                Covid Impact                Growth rate (RHS)              Organic Growth rate (RHS)

Extraordinary Times Extraordinary Team                                                                                                                        17
Quarter EBITDA Performance                                      (millions of dollars except percentages)

                                                                                            Positive factors
                                                                                            •   Sales growth
    140.0                                                                 12.0%
                                                                                            •   Acquisitions, including $13.3m in
                                                                  121.0                         investment income from
    120.0                                               112.2             11.0%                 Clearwater
                                              107.1
                                                                                            •   Reversal of COVID related costs
                                                                          10.0%
    100.0               88.2                                                                •   Production efficiency
            81.1                                                                                improvements
                                                                          9.0%
     80.0                                                                                   Negative factors
                                  67.1
                                                                          8.0%              •   Investment in plant, sales and
     60.0                                                                                       administration infrastructure to
                                                                          7.0%                  support current and future growth
     40.0                                                                                   •   Commodity cost inflation net of
                                                                          6.0%                  selling price increases
                                                                                            •   Wage inflation
     20.0                                                                 5.0%
                                                                                            •   A stronger CAD, which resulted
                                                                                                in lower translated values for US
        -                                                                 4.0%                  based businesses
            2018        2019      2020       2020N      2021     2021N
                                                                                            •   Incentive based compensation
                   EBITDA (LHS)          Covid Impact      Margin (RHS)
                                                                                            •   General cost inflation

Extraordinary Times Extraordinary Team                                                                                              18
Commodity Trends – Pork

                                                                                                                                  Demand factors
                                                                    Pork Index Chart                                              •   Reopening of economies in
           9.0                                                                                                                        North America and Asia
           8.0                                                                                                                    •   Substitution
           7.0                                                                                                                    •   Disposable income
           6.0                                                                                                                    •   Price inflation
 USD       5.0
Based                                                                                                                             Supply factors
           4.0
Index                                                                                                                             •   Labor shortages
Per lbs    3.0
                                                                                                                                  •   Low starting inventories
           2.0
                                                                                                                                  •   Rising feed costs (lower
           1.0                                                                                                                        weights)
           0.0                                                                                                                    •   China ASF recovery
                                            week 13                          week 26                          week 39   week 52
                                                                                                                                  Other factors
                                                                                                                                  •   ASF in Germany
                                                                                                                                  •   New supply sources

           •     Index is comprised of a weighted basket of the following pork products: legs, 72% trim and bellies
           •     Source: USDA

   Extraordinary Times Extraordinary Team                                                                                                                         19
Commodity Trends – Beef

                                                                  Beef Index Chart
          18.0                                                                                                                                              Demand factors
                                                                                                                                                            •   Reopening of economies in
          16.0                                                                                                                                                  North America and Asia
          14.0                                                                                                                                              •   Seasonality
 USD
Based                                                                                                                                                       •   Chinese consumer
Index     12.0                                                                                                                                              •   Disposable income
Per lbs                                                                                                                                                     •   Price inflation
          10.0
                                                                                                                                                            Supply factors
           8.0
                                                                                                                                                            •   Labor shortages
           6.0                                                                                                                                              •   Droughts – US, Australia
                                                                                                                                                            •   Lower weights
           4.0
                                             week 13                         week 26                        week 39                         week 52         •   JBS shutdown

                                                               2019            2020            2021

          •      Index is comprised of a weighted basket of the following beef products: striploins, top butts, inside rounds, and 50%, 85% and 90% trims
          •      Source: USDA

  Extraordinary Times Extraordinary Team                                                                                                                                                    20
Commodity Trends – Lobster

                                                                     Lobster Index Chart
               35.0
                                                                                                                                       Demand factors
               30.0                                                                                                                    •   Reopening of economies
                                                                                                                                           in North America and
               25.0                                                                                                                        Asia
 USD                                                                                                                                   •   Low starting inventories
Based                                                                                                                                      (processed products)
               20.0
Index
                                                                                                                                       •   Disposable income
Per lbs
               15.0                                                                                                                    •   Price inflation
                                                                                                                                       Supply factors
               10.0                                                                                                                    •   Strong spring landings in
                                                                                                                                           Canada
                5.0
                                                week 13                          week 26                          week 39    week 52
                                                                      2019            2020             2021

           •    Index is comprised of a weighted basket of the following lobster products: 4-5oz tails, claws and knuckles
           •    Source: Urner Barry

    Extraordinary Times Extraordinary Team                                                                                                                             21
Commodity Trends – Salmon

                                                Canadian Whole Atlantic Salmon Index Chart
          6.0

          5.0
   CAD
  Based
Index Per 4.0
    lbs
          3.0                                                                                                                              Demand factors
                                                                                                                                           •   Reopening of economies in
          2.0                                                                                                                                  North America and Asia
                                                                                                                                           •   Disposable income
          •      Index is comprised of following salmon products: west coast Atlantic, 12-14 pound
          •      Source: Urner Barry                                                                                                       Supply factors
                                                           Chilean Salmon Index Chart                                                      •   West coast shutdowns
          8.0                                                                                                                              •   Chilean algae and labor
          7.0                                                                                                                                  issues
                                                                                                                                           •   Air freight challenges
          6.0
    CAD
   Based 5.0
 Index Per
     lbs   4.0

          3.0

          2.0
                                          week 13                        week 26                           week 39               week 52
                                                                    2019           2020            2021

          •      Index is comprised of following salmon products: farmed, fillet, fresh, Chile Atl.,D-Trim, FOB Miami,2-3 lbs.
          •      Source: Urner Barry

Extraordinary Times Extraordinary Team                                                                                                                                     22
EBITDA Trend (millions of dollars except percentages)

                                              2010 to 2021 TTM CAGR is 23.2% (Pre IFRS-16: 21.8%)                                        12.0%

      500.0
                                                                                                                                         11.0%
                                                                                                                                 413.6

                                                                                                                                         10.0%
      400.0                                                                                                     369.6    375.9

                     EBITDA guidance
                      of 9% margin                                                                      312.6                            9.0%
                                                                                                307.7
      300.0                                                                            280.2
                                                                                                                                         8.0%

                                                                               190.2
      200.0                                                                                                                              7.0%
                                                                    154.8

                                                           111.6                                                                         6.0%

      100.0                            69.3      77.6
                              66.8
                     54.9
              42.0                                                                                                                       5.0%

          -                                                                                                                              4.0%
              2010   2011     2012     2013      2014      2015     2016       2017    2018     2019    2020    2020N    2021     2021
                                                                                                                         TTM     TTM-N
                              EBITDA (LHS)              IFRS-16 impact (LHS)           Covid Impact       Margin (RHS)

Extraordinary Times Extraordinary Team                                                                                                           23
Quarter Adjusted Earning Performance
      (millions of dollars except per share amounts and percentages)
                                                                                                       Positive factors
                                                                                                       •   EBITDA growth

                                                                                                       Negative factors
                                                                                                       •   Increased normalized income taxes
                                                                                                       •   Increased amortization of right of use
70.0                                                                                                       assets and accretion of lease obligations
                                                                                  60.1         $1.40       primarily due to Confederation sale &
60.0                                                               53.5                                    leaseback
                                                                                               $1.20
50.0                                                  45.9                                             Other considerations
                                                                                               $1.00   •   EPS is still being impacted by a
             38.4         38.5                                                                             conservative balance sheet resulting from
40.0
                                                                                               $0.80       recent equity raises

30.0                                                                                                   Adjusted earnings is based on net earnings
                                                                                               $0.60
                                       21.2                                                            adjusted on a net of taxes basis for the
20.0                                                                                                   following items
                                                                                               $0.40
                                                                                                       •   Acquisition costs
10.0                                                                                           $0.20   •   Accretion on contingent consideration
                                                                                                       •   Puttable interest
  -                                                                                            $-
                                                                                                       •   Amortization of intangibles relating to
            2018         2019          2020          2020N         2021          2021N
                                                                                                           acquisitions (customer names)
             Adjusted Earnings (LHS)          Covid impact (LHS)          Adjusted EPS (RHS)           •   Restructuring costs
                                                                                                       •   Equity losses / earnings
                                                                                                       •   Change in fair value of option liabilities
                                                                                                           relating to convertible debentures
                                                                                                       •   Unusual one-time tax and other gains /
                                                                                                           losses

Extraordinary Times Extraordinary Team                                                                                                                  24
Clearwater Results (millions of dollars)

                                  Q2-2021     %      Q2-2020     %

                                                                        Sales Impacts
       Sales                       138.9    100.0%    106.0    100.0%
                                                                        •   Positive: reopening of economies in
       Gross profit                41.2     29.7%     23.7     22.4%        North America and Asia (China in
       SG&A                        13.2     9.5%       9.4     8.9%         particular) which drove higher volumes
                                                                            and prices
       EBITDA                      28.0     20.2%     14.3     13.5%
       Depreciation                10.4                8.0              •   Negative: stronger CAD relative to the
       Amortization                 1.9                0.9                  USD
       Interest - senior            2.5                8.1              •   Negative: decline in whelk exports
       Non-controlling interest      -                 1.1
       Unrealized FX               (4.2)              (12.5)
       Other                       (0.1)              (1.0)             EBITDA Impacts

                                   17.5                9.7
                                                                        •   Positive: organic growth

       Interest – s/h              11.6                 -               •   Positive: selling price inflation
       Management & quota fees      6.3                 -
       Acquisition costs            0.7                 -               •   Positive: operational efficiencies
       Taxes                       (3.6)              (0.8)             •   Negative: stronger Canadian dollar

       Net earnings (loss)          2.5               10.5              •   Negative: higher shore prices for
       Pre-close earnings            -                10.5                  procured products

                                    2.5                 -               •   Negative: higher incentive
       Ownership                  50.0%                 -                   compensation accruals

       Equity pick up               1.2                 -

Extraordinary Times Extraordinary Team                                                                               25
Capital Allocations (in millions of dollars except percentages)

                                                                                                 Capital
                                                                                   Group                     Investment   Expected IRR
                                                                                                Allocation

                                                                      During the Quarter
      Acquired C.H. Rich                                                         Distribution      1.7          1.7
      Investment in REIT (recent sale & leaseback)                               Corporate        16.5          16.5
      Piller’s Brantford expansion                                                 Protein          -           5.4
      50,000 sf expansion of Hempler’s Ferndale plant                              Protein       US25.7         1.4
      Oberto smokehouse expansion                                                  Protein        US4.7         0.5
      Oberto plant improvement projects                                            Protein          -           0.2
                                                                                                                             >15%
      Concord Montreal cooking (oven) line                                         Protein          -           1.2
      Two Gen 3 automated sandwich lines                                         Sandwich        US22.9         2.7
      Buddy’s plant expansion                                                    Sandwich        US11.9         1.3
      Stuyver’s expansion                                                          Bakery           -           2.6
      Smaller project capex                                                         Cons            -           10.1

      Total in CAD – based on 1.26 exchange rate                                                  100.4         43.6
                                                                 Subsequent to the Quarter
      Acquired Mermax                                                            Distribution                    -
                                                                                                  110.1                      >15%
      Signed purchase agreement for Maid-Rite – subject to consents                Protein                       -
                                                                        Year-To-Date
                                                                                                  931.5        725.5         >15%

Extraordinary Times Extraordinary Team                                                                                                   26
Liquidity (millions of dollars except ratios)

1,020.0                                                                                                           5.5
                                     Top end of targeted                                                                Q2-2021:
                                        total debt to
 920.0                                                                                                            5.0   •   Completed sale & leaseback
                                        EBITDA ratio
                                                                                                                            resulting in $150.0m in net
 820.0                                                                                                            4.5       proceeds

                                                                                                                        Q1-2021:
 720.0                                                                                                            4.0   •   Increased senior credit facility
           Top end of targeted
                                                                                                                            by $200m to $1.2b
             senior debt to
 620.0        EBITDA ratio                                                                                        3.5
                                                                                                                        Q4-2020:
                                                                                                                        •   $287.7m share issuances at
 520.0                                                                                                            3.0
                                                                                                                            $97.55 per share

 420.0                                                                                                            2.5   Q3-2020:
                                                                                                                        •   $150.0m convertible debenture
 320.0                                                                                                            2.0       offering – 7 year maturity,
                                                                                                                            $142.40 conversion price

 220.0                                                                                                            1.5   •   $172.5m in share issuances at
                                                                                                                            $86.30 per share
                                                                                                                        •   Redemption of $86.3m in
 120.0                                                                                                            1.0
                                                                                                                            4.65% debentures – $80.8m
                                                                                                                            was converted at $85.60 per
  20.0                                                                                                            0.5       share

                       Available Credit (LHS)          Total Debt to EBITDA (RHS)   Senior Debt to EBITDA (RHS)

          Extraordinary Times Extraordinary Team                                                                                                               27
Free Cash Flow (millions of dollars except per share amounts and percentages)
                      2006    2007          2008     2009     2010     2011     2012     2013      2014         2015       2016    2017         2018      2019      2020      TTM     2021

Payout ratio         106.4%   77.7%         69.6%   70.6%    65.2%    59.4%    53.0%     53.9%     48.4%        43.2%     36.6%    38.5%       38.1%      43.1%    48.7%     43.6%
Dividend per share    $1.18   $1.18         $1.18    $1.18    $1.18    $1.18    $1.18    $1.23     $1.25        $1.38     $1.52    $1.68        $1.90     $2.10     $2.31    $2.43    $2.54
Dividend increase       -          -          -        -        -        -        -      4.2%        -          10.4%     10.1%    10.5%       13.1%      10.5%    10.1%     10.0%    10.0%
Free cash / share     1.37     1.56         1.71     1.62     1.81     2.02     2.23     2.32      2.60         3.32       4.22       4.41      5.08       4.97     4.87      5.79

                                                                                                                                                                                     $9.00
 240.0
 220.0                                                                                                                                                                               $8.00

 200.0                        •        $626.0m in declared dividends since July 2005
                                                                                                                                                                                     $7.00
                              •        2006 to 2021TTM FCF CAGR is 19.8%
 180.0
                              •        2006 to 2021TTM FCF / share CAGR is 10.5%
                                                                                                                                                                                     $6.00
 160.0
 140.0                                                                                                                                                                               $5.00
 120.0
                                                                                                                                                                                     $4.00
 100.0
  80.0                                                                                                                                                                               $3.00

  60.0                                                                                                                                                                               $2.00
  40.0
                                                                                                                                                                                     $1.00
  20.0
     -                                                                                                                                                                               $0.00
           2006      2007     2008          2009     2010      2011     2012      2013     2014          2015      2016        2017          2018       2019      2020      2021
                                                                                                                                                                            TTM
                                  Free Cash Flow (LHS)                  Dividend per share (RHS)                        Free Cash Flow per share (RHS)

Extraordinary Times Extraordinary Team                                                                                                                                                        28
Questions

Extraordinary Times Extraordinary Team       29
You can also read