Global Market Analysis 2014-2019 - Global Market for Sports Nutrition and Dairy Ingredients - 3A Business Consulting
←
→
Page content transcription
If your browser does not render page correctly, please read the page content below

Global Market for Sports Nutrition
      and Dairy Ingredients

Global Market Analysis
     2014-2019
        Published May 2015
                                                      1
                             3A Business Consulting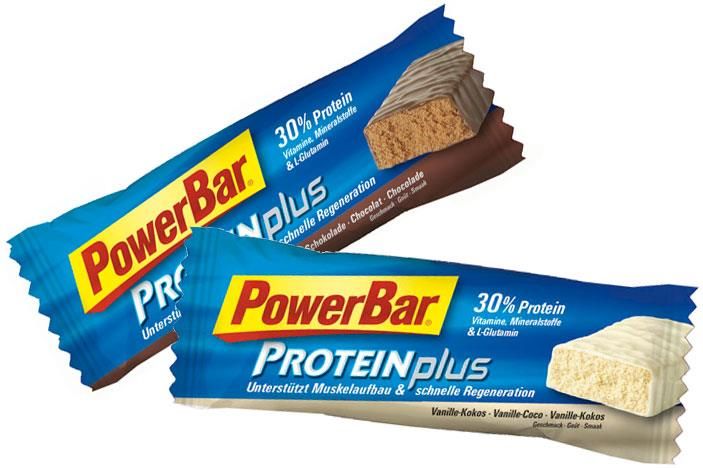
Report Outline

Introduction and Methodology

Sports Nutrition Market and Dairy Ingredients used
  Global Sports Nutrition Market Data and Trends
  Key Players and Distribution Channels
  Ingredient Volume Usage and Major Users
  Ingredient Applications and Product Launches
  Key Dairy Ingredient Companies
  Dairy Ingredient Trade Analysis

Report Summary

Appendix (Volume Estimates for Key Markets)

                                                               2
                                      3A Business Consulting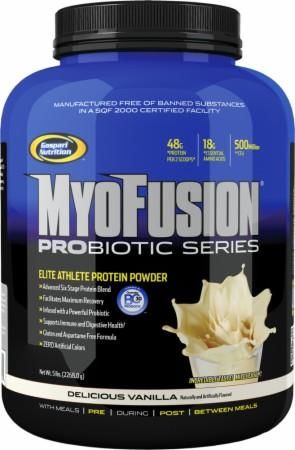
Market Research Approach
 - Sports Nutrition Markets and Dairy Ingredients used

                                                             Global             Dairy              Dairy
     Product              Market             Key
                                                             Market          Ingredients         Ingredients
      Scope               Scope             Players
                                                             Trends             in SN          Trade Analysis

Protein powder        Global            Top 20 global      Consumer         Application/         Import and
Ready-To-Drink           Western        sports nutrition   segments         usage of dairy       export per
RTD                      Europe         companies          Product trends   ingredients          market
                         Eastern
Sports bars              Europe         Top 20 global      Consumer             WPC                 WPC
Other products –         North          brands per         trends               WPI                 WPI
gels, tablets, etc.      America        market                                  MPC                 MPC
                         Latin          Distribution                            MPI                 MPI
                         America        channels                            Competitive
                         Australasia                                        structure
                         Asia Pacific                                           Key dairy
                         Middle East                                            ingredient
                      Value per                                                 companies
                      market                                                    focusing on
                      Volume per                                                sports
                      market                                                    nutrition
                      CAGR 2014-
                      2019

                                                                                                                3
                                                                                3A Business Consulting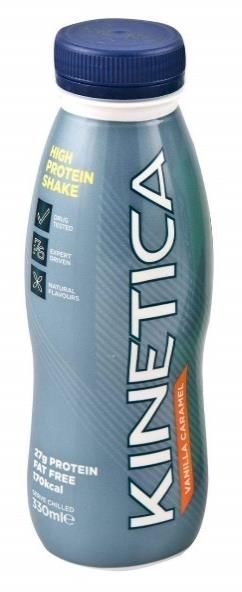
Methodology
                            - Definition of Sports Nutrition
Sports Nutrition products are positioned in the marketplace as
improving physical endurance, increasing muscle
growth/development/mass, or speeding recovery after exercise
The products are sold in powder, bar, ready-to-drink, gel or
tablet formats
Both protein and non-protein based products are included
   However, sugar based drinks often positioned as sports nutrition (e.g.
   Gatorade), energy drinks (e.g. Red Bull), and energy bars (e.g.
   PowerBar) are not included
The Sports Nutrition category definition includes bars with more
than 20 grams of protein in absolute volume, irrespective of
packaging size

                                                                            4
                                                   3A Business Consulting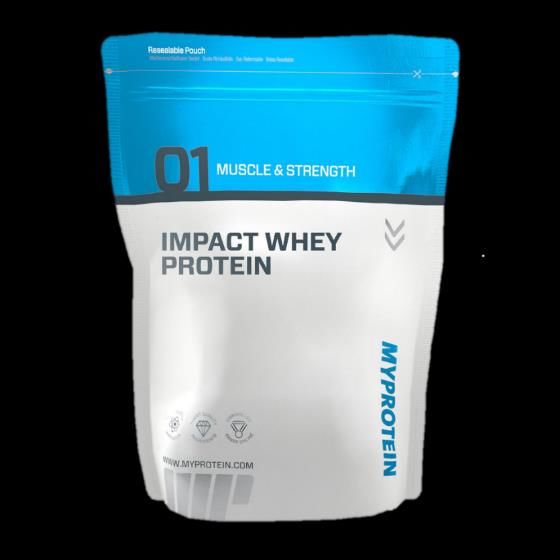
Methodology for Research
                                               - Data Sources and Abbreviations
The building input blocks of this report:

                              Market
          Euromonitor         access
                             database

                                                    Abbreviations:

                        UN             National
                   Comtrade
                                      bureaus of            Sports nutrition is some places
                                       statistics           abbreviated as SN
                                                            Whey protein concentrate / isolate is
                                                            abbreviated as WPC/WPI, and some
                                                            places as WP when mentioned together
                                  3A                        (including WPH)
            Mintel           publications
           database              and                        Milk protein concentrate / isolate is
                              database
                                                            abbreviated as MPC/MPI, and some
                                                            places as MP when mentioned together
                                                            (including MPH)
                                                            Ready-to-drink protein sports drinks are
                     Industry          Company
                                                            abbreviated as RTD’s
                   sources and
                    interviews          Reports

                                                                                                       5
                                                                         3A Business Consulting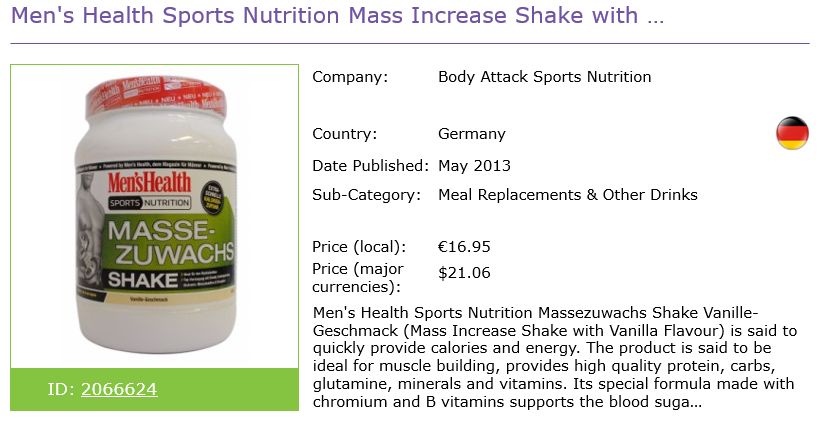
Methodology for Volume Estimations
                    - Calculating Product and Ingredient Quantities
    The percent retail value shares of the four categories within SN (e.g. 64% for protein
    powders) are multiplied with the market value for each market. This results in a value
    estimate for each SN category. These values are then divided by an estimate for the
    average price of the relevant product category (e.g. EUR 25/kg for protein powders),
    resulting in an estimate for the total volume of each product consumed in each market
    The resulting volume estimates are then multiplied by the average percentage of protein
    content of the respective product category (e.g. 75% for powder), and further multiplied by
    the percentage of the protein type out of the total amount of protein in the category (e.g.
    70% WP out of the total 75% protein by volume in protein powders, meaning that 52.5% of
    the total weight of protein powders is derived from WP)
    This respective protein volumes are then subsequently converted to ingredient volumes
    Summing the results of the above calculations for each product type in each market, leads
    to the reported estimates for WP and MP used in SN
    Below the assumed percentage shares of market value, protein content and protein types in
    the four product categories are summarized together with the assumed average retail prices
    (excl. VAT)

Note 1: The quantity estimates for RTD is for fluid RTD’s
Note 2: 3A assumes that the growth for each product category will be equal. Products such as bars and RTD's are favoured for their convenience,
however, protein powders are cheaper for the same amount of protein
Note 3: The protein ingredient category “Other” includes egg protein, soy protein and other vegetable proteins, together with dairy-based protein
ingredients at a lower protein concentration than 80%. Casein/caseinate at above 80% protein are included in the MP category and are assumed to
constitute approx. 15% to 25% of the quantities herein

                                                                                                                                                    6
                                                                                                         3A Business Consulting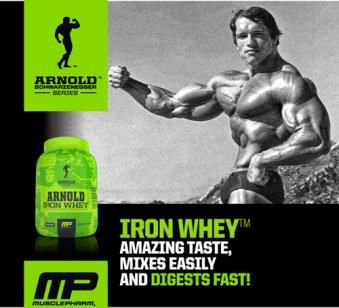
Methodology for Application Analysis
   - Application Trends for Ingredients in Sports Nutrition
     Ingredients:                                  Time Frame:
                                  MP   MPI   MPC                  Geography:
                    WPI                            January 2010   Global and Key Regions
                                                   – March 2015
       WPC
                                                                        Text:
       WP                                                               ”Sport” and Word Variants

Methodology implications:

The used database (MINTEL)
does not record all launches in
SN, particularly given internet
sales. However, the examples
shown are thought to be
representative of all product
launches

                                                                                                7
                                                                       3A Business Consulting
Methodology for Trade Analysis
- Estimating Import and Export Quantities
Inter-EU trade of the protein ingredients are not directly
obtainable. Main sources used to assess trade flows include
national statistical bureaus combined with UN Comtrade
According to industry sources the following HS-codes are used
for WP and MP in the EU:
WPC80+ and WPI are traded under HS code 35022091
“Milk albumin, including concentrates of two or more whey proteins,
dried (for example, in sheets, scales, flakes, powder)”
Not all trade statistics are available to the 8-digit level, and in these
cases the 350220 code is used. As this code also contains other
related products, the methodology chosen to estimate WPC80+/WPI
quantities is to only consider bilateral trade values at above USD 8/kg
MPC 80+ and MPI are traded under HS-code 35040010
“Other protein substances and their derivatives, not elsewhere
specified or included Milk protein concentrates”
Before 2010, the HS code used was 350400, and thus includes other
products than MPC80+/MPI. Thus, the methodology adapted for
estimating trade quantities is to only look at import from countries
known to export substantial amounts of MPC/MPI. These countries are
Switzerland, Netherlands, Germany, Ireland, France, Lithuania,
Hungary, New Zealand, Australia and the U.S. Further, only bilateral
trade flows valued at above USD 6/kg are considered
8
3A Business Consulting
Global Sports Nutrition Market Data and Trends
                                                                        - Global Summary
                                           Forecast CAGR 2014-2019 in %                      2014 Regional Market Shares on
                                 9
                                                                                8,1         Global Sports Nutrition Market in %
                                                                          7,7
Forecast CAGR 2014 -2019 in %

                                 8
                                                                    7,1                                   Eastern Europe
                                                                                          Latin America         2%            Middle East and
                                 7
                                                              6,3                              6%                                  Africa
                                 6                      5,7                                                                         1%
                                            5,3   5,5
                                     4,9                                              Asia Pacific
                                 5                                                        6%

                                 4

                                 3
                                                                                              Australasia
                                 2                                                               8%

                                 1                                                                                         North America
                                                                                                                               61%
                                                                                             Western Europe
                                 0
                                                                                                  16%

                                The North American Sports Nutrition market exhibits highest forecasted CAGR with 8,1%
                                in the period between 2014 and 2019
                                For Middle East and Africa a remarkable CAGR of 7,7% for the period 2014-2019 is
                                estimated which is above the estimated global CAGR of 7,1%
                                                                                                                                                9
                                                                                                               3A Business Consulting
Global Sports Nutrition Market Data and Trends
                                                                   - North America to remain dominant
                                            600
                                                                                                                                 North America
                                                       Bubble size and number in the bubbles
Expected value growth 2014-2019 in USD mn

                                                       represent actual market size in USD mn
                                            500                                                                                                      6202

                                            400

                                                                                                                    Eastern Europe
                                                                                                                    221
                                            300

                                                                                                   Western Europe                  Australasia
                                                                               Asia Pacific        1621                            765
                                            200                                590
                                                                                                                                                 Latin America
                                                                                                                                                 583

                                            100
                                                                          Middle East and Africa
                                                                          114

                                              0
                                                  0        1          2              3             4           5             6           7            8          9    10
                                                                                                       CAGR 2014-2019 in %
                                               Vertical axis represents expected value growth per year within the respective region in USD mn over the period
                                            -100
                                               2014-2019
                                               Horizontal axis represents the CAGR for the period 2014-2019
                                               This chart shows that North America will remain the major growth market over the forecast period

                                                                                                                                                                           10
                                                                                                                                             3A Business Consulting
Ingredient Volume Usage and Major Users
- Calculating Global Ingredients Volume usage in 2014
Applying the calculation method explained in the methodology, the
estimated volumes of SN consumer products are used to calculate
the volume of high-concentration protein ingredients used in SN
This results in the 2014 volume estimates below:
Protein ingredients
2014 Volume Consumer
estimates (‘000 MT) products TOTAL
WP MP Other
ingredients
TOTAL 545 199 52 47 298
Protein powder 303 187 40 40 267
Protein bars 32 3 6 2 11
Protein RTD 162 5 5 4 14
Other SN 48 3 2 1 6
Note: methodology described in the introduction section applied
11
3A Business ConsultingIngredient Volume Usage and Major Users
- Estimated Protein Ingredient usage in 2014
Companies % market share 2014 Estimated protein usage ('000 MT)
Glanbia Plc 14% 41
Hormel Foods Corp 7% 22
General Nutrition Centers Inc 5% 13
NBTY Inc 4% 13
MusclePharm Corp 3% 8
Post Holdings Inc 2% 7
GlaxoSmithKline Plc 2% 5
Abbott Laboratories Inc 1% 4
Twinlab Consolidation Corp 1% 4
Weider Global Nutrition LLC 1% 4
Atlantic Grupa dd 1% 3
Vitaco Health Ltd 1% 3
Clif Bar & Co 1% 2
Hut Group Ltd, The 1% 2
Iovate Health Sciences Inc 1% 2
Labrada Nutrition Inc 1% 2
Sun Bros LLC 1% 2
Ajinomoto Co Inc 1% 2
Amino Active International Pty Ltd 1% 2
Herbalife Ltd 1% 2
Meiji Holdings Co Ltd 1% 2
Private Label 1% 2
USN (Pty) Ltd 1% 2
Universal Nutrition Inc 1% 2
Otsuka Holdings Co Ltd 1% 2
Others 49% 144
Total 100% 297
Note 1: Calculation based on % market share and total Global 2014 market of 298,000 MT of protein ingredients
Note 2: Estimates may vary ±10%. Assuming constant market shares, 2019 estimates would be approx 35% higher
12
3A Business ConsultingGlobal Sports Nutrition Market Data and Trends
- Worldwide SN Market will keep on growing
Market size (USD mn) CAGR CAGR
2010 2014 2019E
Volume estimates (‘000 MT) 10-14 14-19
TOTAL VALUE 6641 10096 11,0%
TOTAL VOLUME 358 545 768
Protein powder 199 303 427
Protein bars 21 32 11,0% 7,1% 46
Protein RTD 106 162 228
Other SN 32 48 68
Despite the current difficult economic outlook, the global sports
nutrition market is estimated to grow 7,1% annually towards 2019
Protein powder and protein RTD are the two big product categories
13
3A Business ConsultingGlobal Sports Nutrition Market Data and Trends
- Global Sports Nutrition Trends (1)
Unlike many packaged food and other consumer packaged goods
industries, sport nutrition is witnessing strong growth rates across a
wide spectrum of global markets, including some of the most mature
Global Growth consumer markets in the world (e.g. North America). The prospect of
growth in stable, business-friendly markets is a major draw for
investors
Growing fitness and health trend to stave off lifestyle diseases are
opening the minds of mainstream consumers. A growing number of
Entering mass producers are capitalizing on the opportunity by reformulating and
market
repackaging sports nutrition to appeal to less sophisticated consumers
and retailers alike
Protein products account for the vast majority of sports nutrition
sales. While ingredient preferences vary by market, in general,
protein has benefited from its “food-like” character and has
Protein on top established itself as the category’s most ubiquitous ingredient. Whey
derived ingredients are the most important proteins, however there is
a increasing trend among health and environmentaly concerned
consumers towards plant derived proteins (e.g. Soy protein, pea
protein)
14
3A Business ConsultingKey Players and Distribution Channels
- Top 20 Brands in Sports Nutrition
Brand Owning Company
2014 Top 20 Global Brands
Optimum Nutrition Glanbia Plc
Aussie Bodies 76,00
Muscle Milk Hormel Foods Corp
Multipower 78
BSN Glanbia Plc
Sunwarrior 79
GNC General Nutrition Centers Inc
Worldwide Pure Protein 80
Labrada 82 MusclePharm MusclePharm Corp
Clif Bar 83 Cytosport Hormel Foods Corp
Precision Engineered 87 Maxinutrition GlaxoSmithKline Plc
Myoplex 98 Body Fortress NBTY Inc
Isopure 100 MET-Rx NBTY Inc
Weider 117
PowerBar Post Holdings Inc
Twinlab 125
Twinlab Twinlab Consolidation Corp
PowerBar 129
Weider Weider Global Nutrition LLC
MET-Rx 131
Isopure Glanbia Plc
Body Fortress 143
Maxinutrition Myoplex Abbott Laboratories Inc
164
Cytosport 220 Precision Engineered NBTY Inc
MusclePharm 260 Clif Bar Clif Bar & Co
451
GNC Labrada Labrada Nutrition Inc
BSN 467 Worldwide Pure Protein NBTY Inc
Muscle Milk 533 Sunwarrior Sun Bros LLC
Optimum Nutrition 775
Multipower Atlantic Grupa dd
0,00 200,00 400,00 600,00 800,00 1.000,00 Aussie Bodies Vitaco Health Ltd
Retail Value RSP in USD mn
15
3A Business ConsultingKey Players and Distribution Channels
- An Internal Analysis of Muscle Pharm Corp
Capabilities Resources VRIO Competitive Advantage
(CA)
Spotting trends and High investments in R&D as Value: Yes, female, consumer health MusclePharm did very well in the last
meeting mass markets well as acquisitions of and wellness products are stongly five years but their market orientation
needs in order to develop established companies like demanded and innovativeness are not the key
products that are BioZone Pharmaceuticals source for a CA. Rather they are a
demanded Rare: No, many companies follow the prerequisite to be able to compete with
trend of producing for mass market companies like Glanbia
and new customer segments
Strong market orientation, building in
Imitable: Yes the voice of the consumer and
innnovativeness are a must in this
Organization: - branch to succeed
Strong communication High advertising budget (28 Value: Yes, trustworthy sources have The social capital and the strong effort
and advertising via mio USD, 16% of revenue) high value for the company and high in advertising are the (temporary) CA of
celebrity and athlete and social capital value to the customer MusclePharm Corp and definitely their
endorsers key to success. Tying important people
A strong network of famous Rare: Yes, social capital and to the company and linking them with
endorsers spreading and networks of contacts are rare and consumer and products have been key
promoting the products also difficult to built up to success and will probably remain it in
via private channels, which the near future
gives MusclePharm free Imitable: No, difficult to imitate or
coverage and high/ copy
trustworthy reach within their
targets (e.g. Arnold Organization: Network well
Schwarzenegger, Tiger established in the organisation and
Woods or Jan Selter) endorsers are tied to the company
(e.g. Arnold Schwarzenegger with his
own product lline)
Note 1: VRIO= Valuable, Rare, Imitable, Organization
Note 2: Method applied from B. Barney, J. (1995). Looking inside for competitive advantage
16
3A Business ConsultingIngredient Applications
- ”Sport” and Milk Protein 2010-2015
Top 10 Countries in Milk Protein
Product Launches per Region
between 2010 - 2015
Number of Variants per Category
Canada
Mexico
Australia
UK
Japan
France
Norway
Brazil
410 launches
Germany recorded globally
USA
0 20 40 60 80 100 120 140
17
3A Business ConsultingIngredient Applications
- “Sport” and Milk Protein 2010-2015 product examples
Company: Nutrition & Santé
Country: Romania
Date Published: Mar 2015
Sub-Category: Snack/Cereal/Energy Bars
Company: Enervit
Country: Italy
Date Published: Feb 2015
Sub-Category: Snack/Cereal/Energy Bars
Company: Activlab
Country: Poland
Date Published: Feb 2015
Sub-Category: Meal Replacements & Other Drinks
Company: DM Drogerie Markt
Country: Germany
Date Published: Feb 2015
Sub-Category: Snack/Cereal/Energy Bars
18
3A Business ConsultingSummary
- SWOT for Sports Nutrition facing the Global Market (1)
Strengths Weaknesses
• Fastest and easiest way to get proteins • Taste and mouth feel of many
after exercise flavoured products are still somewhat
• Young and healthy image flat
Internal
Internal
• The industry has managed to become • SN products are not as appealing as
mainstream fresh food
• Expanding distribution platform • High product prices exclude potential
• investment in lifestyle branding and consumers
gourmet formulations, helping to
• Unhealthy additives (e.g. creatine) in a
overcome lingering perceptions of bad
health-care market
taste and texture
Opportunities
SWOT Threats
• Sports nutrition as fastest growing
category in consumer health segment • Non-threatening formulas, formats and
retail channels will become increasingly
• Growth stimulates investment important
External
External
• People are taking more control of their health
• Competition is intensifying, e.g. increase
and looks
in private label products
• Obesity fighting
• Consumer trends towards more natural
• Aging people becoming more focused on products with similar benefits, e.g.
retaining muscle mass
chocolate milk
• Increased gym membership rates
• Tainted products damage consumer trust
• Customers wants to be incorporated and
engaged -> co-creation of value • Increased government regulations
19
3A Business ConsultingGlobal Sports Nutrition Report
– Project Management and Costs
Team 3A Business Consulting team:
– Managing partner - Tage Affertsholt
– Junior consultant - Stefan Raff
Time Report available in PDF format – in total
more than 90 slides – from June 2015
Cost
EUR 3,400
20
3A Business ConsultingYou can also read