Corona Discharge in Microwave Devices: A Comparison of Ionization Rate Models
←
→
Page content transcription
If your browser does not render page correctly, please read the page content below
July, 2010                                                                                               Microwave Review

                  Corona Discharge in Microwave Devices:
                  A Comparison of Ionization Rate Models
                                             Edén Sorolla, Michael Mattes

   Abstract – In this paper we compare the predicted Corona         The amount of collisions between electrons and neutral
breakdown power threshold obtained by different ionization rate     molecules increases with the pressure, but as the pressure
models for an infinite parallel-plate waveguide. We point out the   increases, the flight time of the electrons between two
lack of a unanimous model of the ionization rate for RF fields      collisions is reduced. This does not let the electrons reach the
and study the differences in the current models.
                                                                    kinetic energy (i.e. the speed) necessary to ionize the gas
   Keywords – Corona breakdown, ionization rate, microwave          molecules, so that the ionization rate decreases with
discharge, weakly ionized plasma.                                   increasing pressure. On the other hand, when the pressure is
                                                                    too low the electrons travel forth and back several times,
                      I. INTRODUCTION                               under the action of the electric field, before impacting against
                                                                    a neutral molecule. This also decreases the collision rate,
   The study of low-pressure electrical discharges caught the       letting diffusion loss dominate the process, with the
attention of the space engineering community several years          subsequent need of a higher microwave field to initiate the
ago with the advent of the space exploration and the                breakdown.
subsequent development of new onboard devices for satellite            The pressure under which the ionizing process is optimum
applications [1-3]. The exploration of planets and their moons,     is called critical pressure and it corresponds to that one for
as well as the TTC (Telemetry, Tracking and Control) phase          which the electrons collide against the neutral molecules with
of spacecrafts launching, and the re-entry of vehicles in the       a collision frequency that exactly equals the RF frequency. In
earth atmosphere are subjected to the risk of plasma                this case electrons that have struck a molecule when the
breakdown occurring either on the aperture of slot antennas or      electric field was in a maximum, will reach the next molecule
inside the satellite payloads.                                      when the electric field will be maximal again, making the
   The molecules of the planetary atmospheric gas remaining         ionization process very efficient. For this pressure, the
within the gaps of microwave devices may collide with the           breakdown electric field threshold reaches a minimum, since
environmental space electrons. The electrons can either be          the ionization rate will be maximal. This is the critical
constrained to the magnetic field lines of a planet, as it          breakdown electric field.
happens in the Van Allen belts around the earth, or come from          Nowadays, an increasing interest from the satellite
external ionization processes as, for instance, the interaction     telecommunication industry as well as from planetary
of the galactic cosmic rays with the matter of the spacecraft.      exploratory missions demands a technology for space
These electrons are accelerated by the RF electric field inside     applications that need microwave components dealing
the microwave devices and can collide with the gas                  properly with larger bandwidths, higher component
molecules, releasing new electrons from the external shells of      integration and better power handling capabilities. These
them.                                                               requirements lead to higher electric field densities which
   The electric field produces a collision rate between             increase the risk of electrical breakdown to occur within
electrons and neutral molecules that results in an ionization       microwave devices on board of satellites.
rate provoking a local electron population growth. At the              The consequences of a Corona discharge are extremely
same time, the electrons tend to move away from the zones           harmful within a microwave device since the electron cloud
where there is a big concentration of electrons to level out the    formed by the breakdown onset reflects the RF signal, what
electron population density and attain the chemical                 can lead to the destruction of the power source. The discharge
equilibrium, process that is called diffusion. Above a certain      can severely increase the temperature, due to the high current
value of RF power the local growth is produced fast enough to       density produced, resulting in the complete destruction of the
forbid the electrons to balance the local increase of the           device, with the subsequent danger of missing the complete
electron density. This lost of local equilibrium between            mission if information between satellite and earth is lost.
ionization and diffusion initiates a bigger ionization process,        In this work we compare the predicted Corona power
inducing a glowing emission. The glowing is the result of the       threshold at the example of an infinitely long parallel-plate
radiation of the free electrons accelerated by the RF field. This   waveguide obtained by several ionization rate models that
kind of discharge is usually called Corona Discharge and one        have been published so far and used in different papers to
fundamental property is the dependence of the breakdown             predict the breakdown power threshold for different
power threshold on the gas pressure.                                geometries.
The authors are with the Laboratoire d’Electromagnétisme et
d’Acoustique (LEMA), EPFL. Lausanne, 1015 Ecublens,
Switzerland. E-mail: eden.sorolla@epfl.ch, michael.mattes@epfl.ch

                                                                                                                                41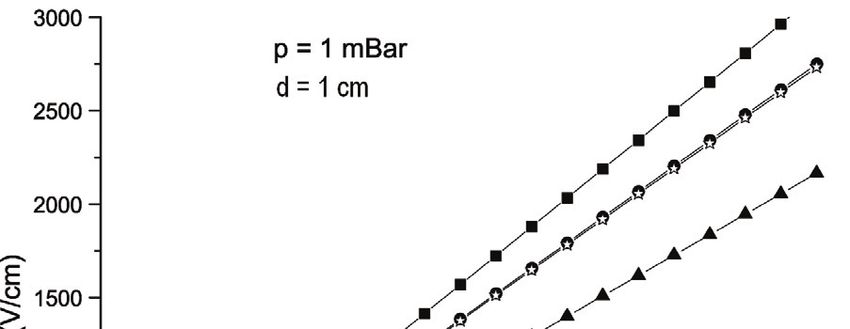
Mikrotalasna revija Jul 2010.
II. THEORY in the CGS system, preserving the form of the diffusion
coefficient as given by the reference above. In this metric
A. Corona equation system of physical units p is the pressure given in Torr
(mmHg) and distances are given in cm. The factor Ee is called
We can consider the remaining gas within the microwave the effective electric field.
devices on spacecrafts as a system of neutral particles and a The electron is accelerated by the RF field and experiences
relatively small number of electrons before the build-up of a many collisions before it reaches enough energy to ionize a
plasma due to the discharge. Some authors [4] call this system gas molecule. The average number of collisions per unit time
weakly ionized plasma which can be described as an electron is called the collision rate, c , which depends on the gas
gas coexisting in equilibrium with a neutral molecular gas pressure. As it was mentioned in the introduction, there is a
provided the following condition is verified [4]: pressure for which the efficiency in the gain of energy of the
electrons, driven by the microwave field, is optimum. That
e6 N e T 3 1 , (1) pressure corresponds to the one for which the collision rate
equals the microwave frequency . Many authors have
where e, Ne and T are the electron charge, the electron density measured the collision rate for air, most of them agreeing with
and the electron temperature, respectively. The electron the expression [8]:
temperature is proportional to the mean kinetic energy of the
electrons. Thus, a plasma whose parameters satisfy Eq. (1) is c 5.3 109 p . (5)
also known as ideal plasma, since the interaction between
electrons and gas molecules is supposed to be weak enough to Since the ionization rate models are based on DC
consider the electron population in thermal equilibrium with experiments the concept of the effective electric field is used.
the gas molecule population. Under this assumption the The effective electric field can be considered as the DC
electron temperature can be considered equal to the one of the equivalent of the RF peak electric field (similar to effective
gas molecules. This point is important since this has been and peak power). The relation is given by [5]:
assumed in the work of the different authors whose ionization
rate models are going to be compared along this paper. E0
If we define the electron population density inside the gas Ee , (6)
2
as n r , t we can recall the continuity equation for the 2 1
c
electron population assuming an arbitrary volume within the
gas cloud. Therefore, the change of the electron population
with respect to the time inside this volume is given by the where E0 is the amplitude of the RF electric field. From Eq.
flow of electrons leaving this zone in order to preserve the (6) follows directly that for DC fields E0 equals to 2 Ee .
conservation of charge principle; this produces a current
density called J . However some electrons are released from
the shells of the molecules because of the ionization. This B. Ionization rate models
increases the change of the electron population density with
Several models for the ionization rate can be found in the
respect to the time n t , by an amount equal to the literature. In this work we have used the models extracted
ionization rate νi times the amount of electrons per unit from [7-10], what are based on semi-empirical arguments, to
volume enclosed in the imaginary volume i n . Therefore, calculate the predicted Corona breakdown threshold for a
the equation we have to deal with can be written as follows: parallel-plate waveguide. We have called each model
according to the name of the first author of the
aforementioned references.
n
in J . (2) In Fig. 1 the different ionization rates, that are going to be
t compared along this paper, are shown in a log-log plot for
better comparison. Noticeable differences between the values
The electron flow through the boundaries of the considered of the ionization rate provided by the models can be observed.
volume is produced by the diffusion process, and it can be We will show how these discrepancies result in noticeably
proved that the current density due to diffusion is given by [5] different predicted breakdown electric fields and,
consequently, in different Corona discharge power thresholds.
J Dn , (3) The ionization rate in Fig.1 has been shown within the
range of validity for Ee p of the most restrictive models, i.e.
where D is the diffusion coefficient. For this work we have Lupan and Woo [7,9]; Tang’s model is valid for the widest
chosen the diffusion model given by [6], where D is expressed range: from 30 to 1200 V cm -1 Torr -1 ; Mayhan does not
for air as:
say anything about the range of validity of his expressions.
E 4 Two main observations must be done about the models.
D 29 0.9 e 10 p (4) Firstly, Mayhan’s ionization rate model is developed in the
p
42July, 2010 Microwave Review
z, t , thus we can apply the separation of variables technique
for 1D. Regarding the boundary conditions, we can expect
Fig. 2. Parallel-plate waveguide.
Fig. 1. Ionization rate of the considered models. that the electrons will quickly recombine with the atoms of the
metal if one reaches any plate, so that the electron density can
framework of re-entry vehicles in a high temperature be considered zero on the metals. This can be expressed by
environment, as it occurs in the ionosphere. It includes the the following boundary conditions
environmental temperature as a parameter. We have chosen
this temperature such that the ionization rate is as low as n z 0 n z d 0 x, y , t . (9)
possible and, thus, as close as possible to the temperature
conditions under which the other models have been
developed. Secondly, Tang’s model is developed such that Therefore, we find the solution to be
both ionization coefficient and collision rates are piecewise
functions. This can be observed in Fig. 1, where the ionization i t
n z , t sin z e , (10)
rate before and after Ee p 54 has different values, although D
this is almost not noticeable.
2
m
C. Parallel-plate waveguide where the parameter must read D , in order to
d
For our purposes it suffices to assume a TEM field verify the boundary conditions, and m is a natural number.
distribution between parallel-plates subject to a voltage V(t) As the ionization rate depends on the electric field and the
and separated by a distance d (see Fig. 2). In this case the pressure, and the diffusion coefficient does on the latter one,
electric field is E0 t V t d , i.e. constant in the region too, there will exist, at a given pressure, a breakdown electric
field, EB , corresponding to m 1 , which establishes the
between the plates. Thus the ionization rate and the diffusion
breakdown condition as
coefficient are also constant since they both depend on the
electric field. Therefore we can solve Eq. (2) analytically
because all the coefficients are constant. We can write the i p, EB p 0 , (11)
usually called Corona equation for RF fields as follows:
above which Corona discharge will occur.
n
i n D 2 n . (7)
t
III. RESULTS
The general breakdown criterion is found when the electron
population density is just in equilibrium or when n t 0 , A. Paschen curve
that is, when
For a given distance between the plates we can calculate the
i n D 2 n 0 (8) electric field that verifies Eq. (11) for each pressure by a root
search algorithm. The bisection algorithm has been used in the
Furthermore, due to the symmetry of the problem we can simulations shown along this work since, although its
consider the variation of the electron density only along the z convergence is slow, it is always ensured. We have studied
axis (see Fig. 2) assuming an initially homogeneous two different waveguide dimensions and frequencies. The first
distribution of the electron density between the plates. study corresponds to the values d=4.74 cm, f=0.994 GHz; and
Taking into account the symmetry of the problem we can the second one to d=1.26cm, f=9.4 GHz. We show the
assume that the electron density depends only on the variables threshold EB vs. the pressure obtained with the different
43Mikrotalasna revija Jul 2010.
aforementioned models and added the experimental results Comparing Fig. 1 with Figs. 3 and 4 we can see that, as
obtained by MacDonald [11] for these dimensions (see Figs. 3 expected, the higher the ionization rate, the lower the
and 4). The plots representing the breakdown electric field vs. predicted breakdown threshold. From MacDonald’s
pressure are called the Paschen curve of the microwave measurements we can see that for different values of RF
device. frequency and gap distance, they show either a higher or a
The effect of the discontinuity of the ionization rate in lower breakdown threshold than the one predicted by
Tang’s model (squared markers) shown in Fig. 1, can be Mayhan’s model around the critical pressure. Let us recall
observed in Figs. 3 and 4. The change of trend in the curve that Mayhan’s ionization rate is always greater than the one of
obtained by Tang’s model from some pressure on comes from any other model for the complete range of validity; therefore
the search of the root in Eq. (11). Around the pressure for it is expected to predict the minimum breakdown electric field
which the predicted breakdown electric field has associated a at all pressures.
value of Ee =54p, the ionization rate oscillates between the The predicted breakdown electric fields obtained by Lupan
values for which the ratio of effective electric field over and Woo models miss some points in Fig. 4 below a certain
pressure is greater or lower than 54. Thus, at pressures that pressure. This occurs because under the represented range of
have associated roots corresponding to values of Ee p 54. models.
This fact also shows that small differences in the value of the
ionization rate can noticeably change the predicted breakdown B. Critical pressure
electric field. Strictly speaking for Ee p 54 no breakdown
In the design of microwave components for space
threshold can be defined due to the discontinuous ionization applications it is usual to look for the critical breakdown
rate. power threshold. This one can be linked to the breakdown
electric field at the critical pressure by means of the following
expression [12]:
dPrms d 2
E0 (12)
dy 240
to calculate the predicted critical breakdown power. We
remark that Eq. (12) is understood as power per unit length
since the parallel-plate configuration is assumed to have an
infinite width. In Tables 1 and 2 the predicted values obtained
by the models for the two waveguide geometries considered
before are shown.
Table 1 shows the predicted critical power discharge for the
geometry considered in Fig. 3 together with the corresponding
model. For these values of gap distance and frequency we can
Fig. 3. Paschen curve for air in a parallel-plate waveguide together see that the ratio between the maximum and the minimum
with MacDonald measurements.
predicted value is more than 3dB assuming the same plate
width.
TABLE 1
CRITICAL BREAKDOWN POWER ASSOCIATED TO FIG. 3
dPBcrit
Models (kW/m)
dy
Lupan 4.3
Mayhan 2.3
Tang 5.1
Woo 4.2
Table 2 shows the same for the geometry considered in Fig.
4. The differences are also noticeable in this case, though this
time the ratio between maximum and minimum is slightly
Fig. 4. Paschen curve for air in a parallel-plate waveguide together smaller than 3dB.
with MacDonald’s measurements.
44July, 2010 Microwave Review
TABLE 2 similar dimensions, all of them corresponding to values of
CRITICAL BREAKDOWN POWER ASSOCIATED TO FIG. 4 d 10 mm.
Another interesting study is made fixing the pressure and
dPBcrit the distance between the plates to calculate the breakdown
Models (kW/m) electric field sweeping the RF frequency. In this study a
dy
curious correlation between the working pressure and the
Lupan 454.1 agreement of the models with each other can be seen when
Mayhan 271.2 comparing the results at two different given pressures.
Tang 527.9 Some simulations have been undertaken sweeping the
Woo 440.0 frequency and keeping constant the distance between the
plates at a given pressure. For instance, in Fig. 6 we present
the results of the aforementioned study at 1mBar for a gap
C. Influence of parameters on the breakdown distance of 1cm. In this case we can see that all the models,
even Mayhan’s one, tend to the same predicted values of the
It is interesting to fix the pressure and sweep other
breakdown threshold as the frequency tends to low values.
parameters to see the influence of the frequency and the gap
distance in the predicted breakdown electric field for the
different models. Some correlation between the values of the
parameters and the closer agreement in the predicted
breakdown threshold obtained by different models might be
found.
Indeed, in Fig. 5 the critical breakdown electric field is
represented vs. the gap distance for a given frequency. The
plot shows how, as the gap distance decreases, the models
tend to converge to the same values except Mayhan’s model.
We cannot reduce the distance as much as we want to check
whether Mayhan’s model agrees with the others as
d decreases because, below a certain distance, the predicted
breakdown electric field increases too much to stay within the
range of validity of Lupan and Woo models. In any case, other
simulations for smaller distances have shown that the
predicted values by Mayhan’s model diverges from the Fig. 6. Breakdown electric field vs. frequency at 1 mBar.
tendency of the other models for values of d below the ones
shown in Fig. 5.
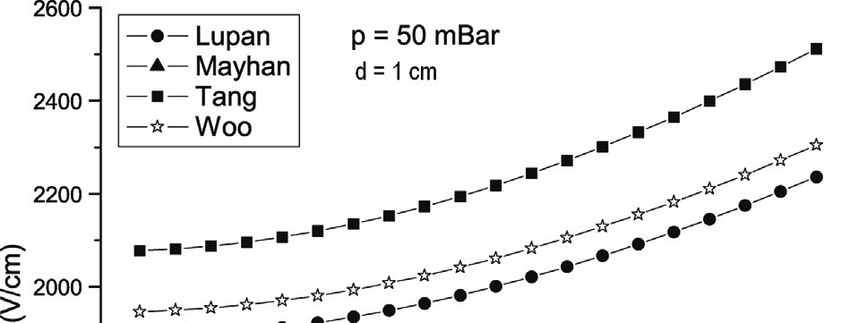
Fig. 7. Breakdown electric field vs. frequency at 50 mBar.
Fig. 5. Critical breakdown electric field vs. gap distance. However, in Fig. 7, where the pressure is 50mBar and the
distance is the same as in the previous case, this effect cannot
From the description of the models in the literature it is not be observed. These results are not surprising if we think about
clear why the models of Lupan, Tang and Woo predict nearly the frame under which all the ionization rate models, based on
the same breakdown values as the distance decreases. One semi-empirical approaches, have been developed. On the one
possible explanation might be that their ionization rate models hand, all attempts to develop a model for the RF ionization
had been obtained from experiments done with waveguides of rate have been based on corrections of the ionization rate
models developed for DC conditions. This is the reason why
the models tend to the same predictions for low frequencies.
45Mikrotalasna revija Jul 2010.
On the other hand, most of the DC models are based on models studied are based on experimental data mainly
measurements made under low pressure conditions, what obtained from DC experiments at low pressures. It would be
explains the discrepancies of the models shown in Fig. 7 when interesting to develop ionization rate models based on
the frequency tends to low values while the pressure is higher microwave frequency experiments at higher pressures.
than the one considered in Fig. 6.
ACKNOWLEDGEMENT
IV. CONCLUSION
This research work has been conducted in the framework of
The critical breakdown power threshold of a microwave the European Space Agency Project High Power SMA
device for space applications is fundamental to ensure the connectors (ESA/ESTEC contract No. 20967/07/NL/GLC)
good performance of satellites and space vehicles. This factor and supported by the COST Action IC-0803 RF/Microwave
provides an important constraint in the design of electron Communication Sub-systems for Emerging Wireless
devices on board of satellites. Four different available models Technologies (RFCSET).
of the ionization rate for low-pressure microwave discharges
are studied in this paper. Although all of them use the same REFERENCES
model of the effective electric field, noticeable discrepancies
in the predicted critical breakdown power obtained by the [1] P. A. Clavier and L. Webb, “Electromagnetic Breakdown of
different models could be observed. Air”, Journal of Applied Physics, vol. 37, no. 2, pp. 742-744,
For most of the models the ionization rate is only valid for a 1966.
relatively small range of values of the ratio of effective [2] G. C. Light, “Microwave Breakdown in High-Temperature-
electric field over pressure. Apparently, there are many Air”, Journal of Applied Physics, vol. 39, no. 3, pp. 1591-1597,
technical difficulties to measure the ionization rate under 1968.
[3] G. C. Light, “High-Temperature-Air Microwave Breakdown”,
conditions of very low pressure and very high effective
Journal of Applied Physics, vol. 40, no. 4, pp. 1715-1720, 1969.
electric fields. This fact limits the values of the RF frequency [4] B. M. Smirnov, Physics of Weakly Ionized Gases, Mir
and gap distance for which the search of the Corona Publishers Moscow, 1981.
breakdown power can be done without leaving the validity [5] E. Nasser, Fundamentals of gaseous ionization and plasma
range of the models. We have shown that the predicted electronics, John Wiley & Sons Inc. 1971.
breakdown power for a given frequency increases as the gap [6] A. D. MacDonald, D. U. Gaskell and H. N. Gitterman,
distance decreases. This means that at certain pressures the “Microwave Breakdown in Air, Oxygen and Nitrogen”,
breakdown effective electric field predicted for some parallel- Physical Review, vol. 130, no. 5, pp. 1841-1850, 1963.
plate waveguides will lie beyond the upper or the lower limit [7] Wee Woo and J. S. DeGroot, “Microwave absorption and
plasma heating due to microwave breakdown in the
of validity range. Thus none of the models available can be
atmosphere”, Physics of Fluids, vol. 27, no.2, pp. 475-487,
used to calculate the predicted breakdown threshold for all 1983.
geometries and RF frequencies at every pressure. It would be [8] Joseph T. Mayhan, “Comparison of Various Microwave
interesting to propose experimental setups to measure the Breakdown Prediction Models”, Journal of Applied Physics,
ionization rate dealing with lower pressures and higher vol. 42, no. 13, pp. 5362-5369, 1971.
effective electric fields than considered so far. This will [9] Yu. A. Lupan, A. A. Krasutskii and S. V. Zakrevskii,
increase the validity range of the models and thus a larger “Microwave breakdown field in air”, Zh. Tekh. Fiz. vol. 48, pp.
range of waveguide dimensions, frequencies and pressures 1161-1164, 1978.
could be used to simulate the critical pressure. [10] Tang Tao, Liao Cheng, Yang Dan and Li Jun, “Simulation of
the Attenuation and Refraction of High Power Microwave
A study of some parameters to see under which conditions
Breakdown in the Atmosphere”, ICMMT2008, Conference
the models tend to predict the same breakdown threshold has Proceedings, pp. 1916-1918, Nanjing, P. R. China, 2008.
been done. It has been shown that the breakdown values [11] A. D. MacDonald, Microwave breakdown in gases, John Wiley
predicted by the different models at low pressures tend to be & Sons, Inc. 1966.
equal for low RF frequencies. On the contrary, for high [12] D. M. Pozar, Microwave Engineering, Addison-Wesley
pressures and high frequencies the models differ significantly. Publishing Company, Inc. 1990.
This can be explained by the fact that the currently available
46You can also read