EARLY GUIDANCE FOR TROPICAL WEATHER SYSTEMS - UNDERSTANDING WHAT'S OUT THERE JENNIFER MCNATT - PREPARING TEXAS
←
→
Page content transcription
If your browser does not render page correctly, please read the page content below
Early Guidance for Tropical
         Weather Systems
   Understanding What’s Out There

             Jennifer McNatt
        National Weather Service
Material from: Dan Brown, Mike Brennan
and John Cangialosi, National Hurricane
                 Center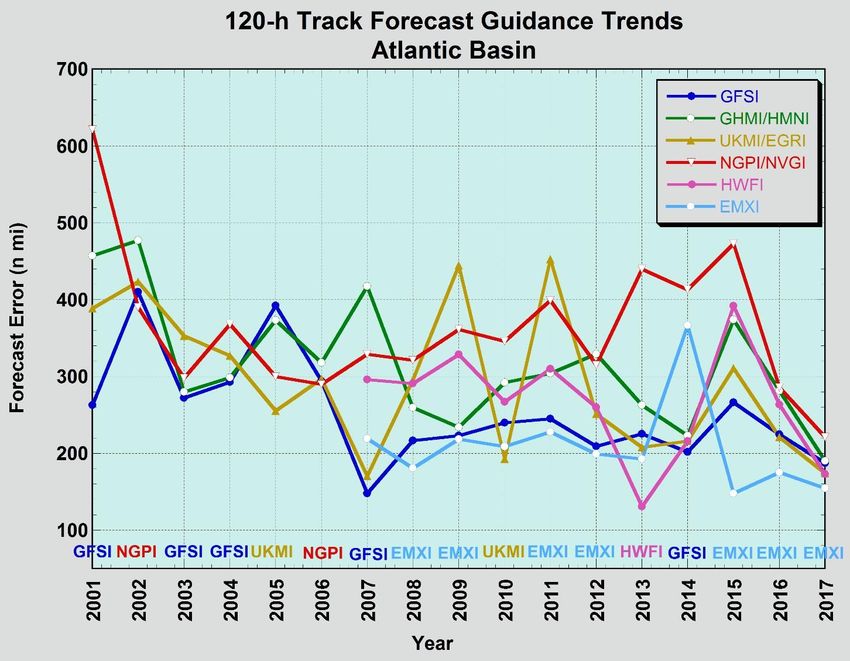
Which of the following is
         not true for “Invests”
a. Allows NHC to collect additional data and run
   model guidance

b. Implies that the system is likely to develop

c. Model guidance is not always run for invests

d. The initial location can be moved tens of miles
   from cycle to cycle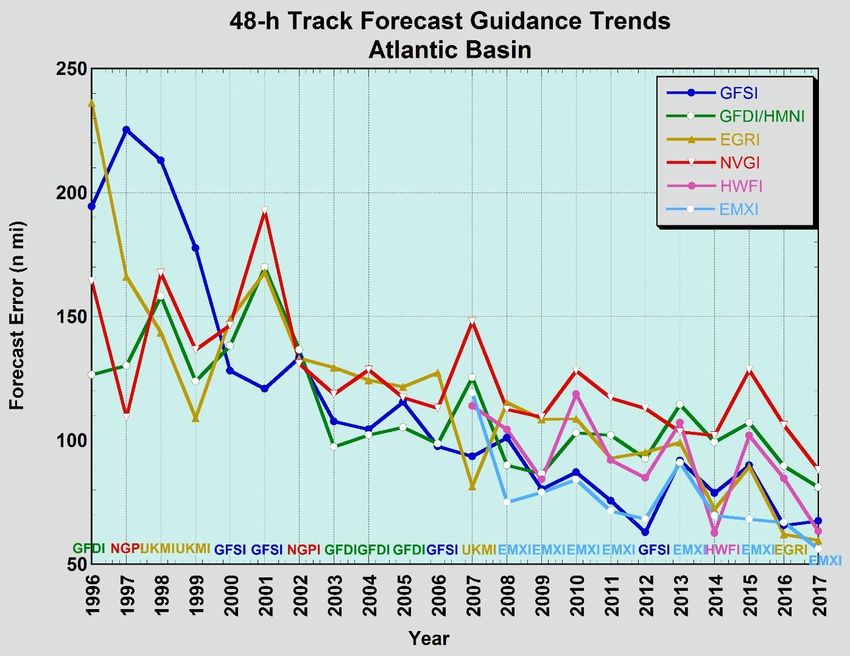
What is an “Invest”
A weather system for which a tropical cyclone forecast
center (NHC, CPHC, or JTWC) is interested in collecting
specialized data sets and/or running model guidance. (In
other words, something we want to investigate further.)
Caveats for Invests
• Opening an “invest” allows NHC to
  monitor disturbances more carefully:
   • Collection of microwave data
   • Ability to run model guidance

• No standard for opening an invest

• Guidance is typically run when a cloud
  system center is apparent

• More meteorological uncertainty
  associated with invests!
   • Extreme caution should be used
     when looking at model plots for
     invests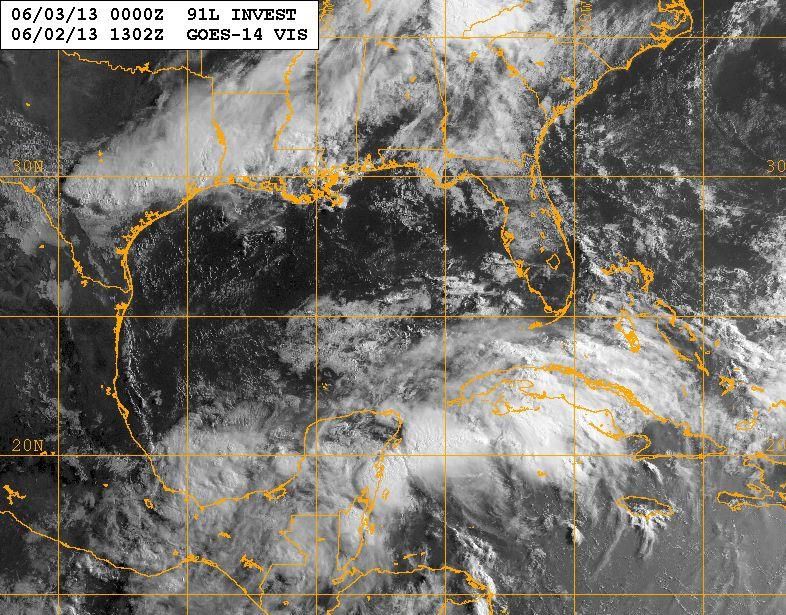
Tropical  Cyclone
    Tropical WeatherModels
                    Outlook
Track and Intensity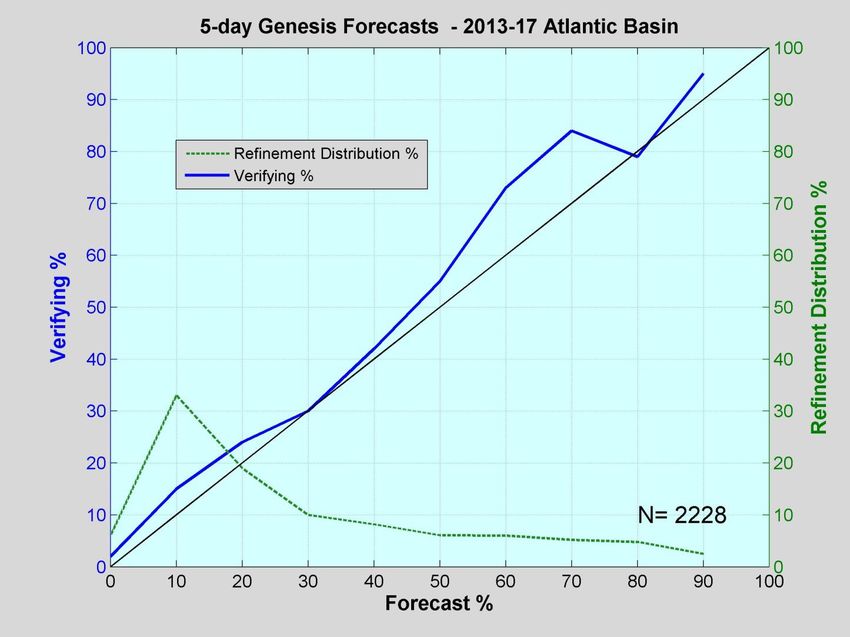
Tropical  Cyclone
    Tropical WeatherTrack
                    Outlook
Overview
• Track forecasting is a
  relatively simple
  problem
   – “Cork in a stream” analogy

• Important atmospheric
  features that control
  track are relatively large
  and easy to measure

                                  7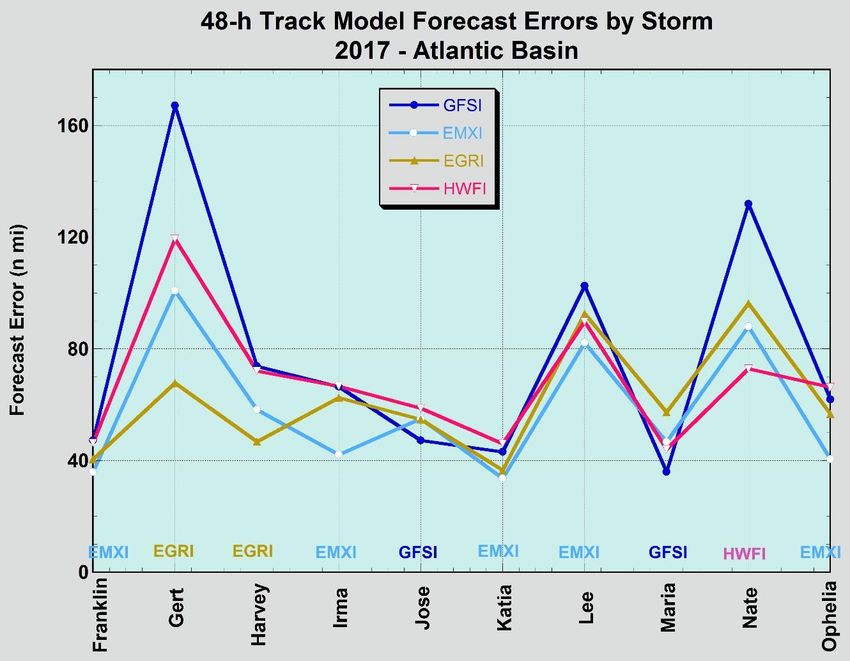
Tropical  Cyclone
    Tropical WeatherModels
                    Outlook
Statistical and Dynamical
• Statistical
  – Tells you what normally occurs based on the
    behavior of previous storms in similar situations
    (i.e., storm location, time of year, current motion,
    intensity, environment)

• Dynamical
  – Attempt to predict what will happen in this specific
    situation

                                                           8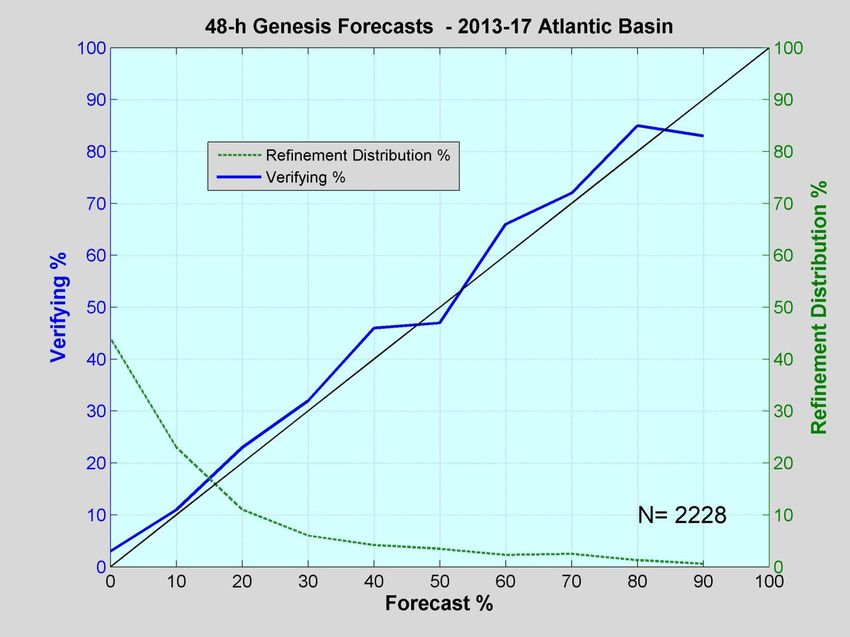
Tropical  Cyclone
    Tropical WeatherModels
                    Outlook
Spaghetti Plots
                     • What does this set of
                       lines represent?
                     • Do they accurately
                       convey the
                       uncertainty in the
                       track forecast?
                     • Are they all created
                       equal?
                     • What’s missing?

                                         9
Tropical  Cyclone
    Tropical WeatherModels
                    Outlook
Spaghetti Plots

                              11
Tropical  Cyclone
    Tropical WeatherModels
                    Outlook
Extrapolated Motion

                      Useful if models aren’t handling
                      initial motion well in the very
                      short term

                      No utility beyond 6 or 12 hours
                      at most

                                                 12
Tropical Cyclone
Tropical WeatherModels
Outlook
Climatology and Persistence
Used as a baseline to compare
other forecasts with
Not used as a forecast tool
13Tropical Cyclone
Tropical WeatherModels
Outlook
Global Models
• Best forecast models for TC
track
• Developed for general
weather forecasting
• Handle large-scale pattern
and steering flow well
• Can’t see details of TC inner
core
• Sometimes struggle with
storm structure and intensity,
which can affect track
forecasts
14Tropical Cyclone
Tropical WeatherModels
Outlook
Regional Hurricane Models
• Developed specifically for TCs
• Higher resolution means they
can potentially do better job
of handling interactions
between TC and environment
• Limited coverage means
features far away from TC
may not be handled as well,
which can degrade longer-
range forecasts
15Tropical Cyclone Models
Consensus Models
Typically the best track guidance,
especially if the member models
all show a similar forecast
scenario
Doesn’t work well when
members forecast very different
track scenarios
16Tropical Cyclone Models
Model Plots
Spaghetti Plots – Caution!
• People looking at publically
available model track plots,
aren’t seeing the whole picture
• Some of the best guidance
(ECMWF, FSSE) isn’t publicly
available for proprietary reasons
• No sense of continuity from
cycle to cycle for the various
models, trends, etc.
• Users/viewers don’t have the
forecaster’s perspective and
knowledge to know model
strengths and weaknesses,
trends, etc.
17Consensus Models
Consensus Example
Examples – Tropical Storm Cristobal (2014)
•Model errors are often random (e.g., small variations on a common theme)
18
•Consensus frequently cancels out these random errors, resulting in a better forecastConsensus Models
Consensus Example
Examples – Tropical Storm Cristobal (2014)
•Model errors are often random (e.g., small variations on a common theme)
19
•Consensus frequently cancels out these random errors, resulting in a better forecastConsensus Models
Consensus Example
Examples – Hurricane Joaquin (2015)
HWFI
GFDI
GFSITVCA
ERGI EMXI
•Consensus approach doesn’t always work, especially when model scenarios are completely different
•Sometimes the forecaster might want to exclude certain models and form a “selective consensus”, if the
discrepancies among the models can be resolved
20
•Resolving these discrepancies is very difficultTrack
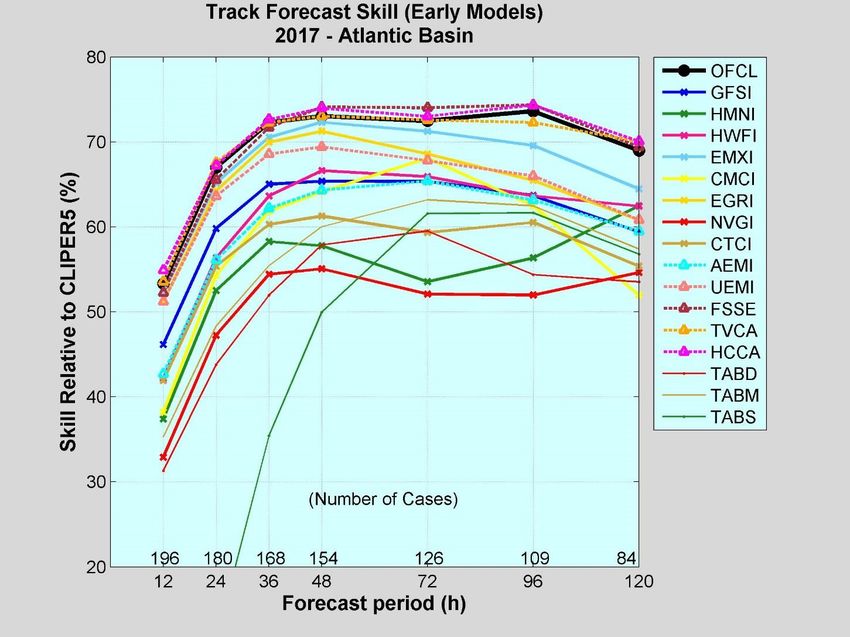
Yearly Model
Track ModelVerification
Performance Trends
Atlantic – 2017 (Preliminary)
OFCL very skillful and was near
best-performing consensus
models (HCCA, TCVA, FSSE)
EMXI was best individual
model at all lead times, but
trailed OFCL and consensus
EGRI and UEMI were next best
models
GFSI, HWFI, AEMI, and CMCI
were fair performers
NVGI, HMNI, and CTCI lagged
29 April 2018 2018 National Hurricane Conference 22Track
Yearly Model
Track ModelTrends
Performance Trends
Best 48-h Track Model by Storm – 2017
Considerable variability
from storm to storm,
with no clear best
model at 48-h across
the board
EGRI: Gert, Harvey
EXMI: Irma, Ophelia
GFSI: Jose, Maria
HWFI: Nate
29 April 2018 2018 National Hurricane Conference 23Track
Yearly Model
Track ModelTrends
Performance Trends
Best 48-h Track Model 1996-2017
Due to model changes and
other factors, the best
performing model often
varies from season to
season
ECMWF (EMXI) was best
model in 2017, just edging
UKMET and HWRF
A global model has been
the best at 48 h every year
since 2006 except 2013
29 April 2018 2018 National Hurricane Conference 24Track
Yearly Model
Track ModelTrends
Performance Trends
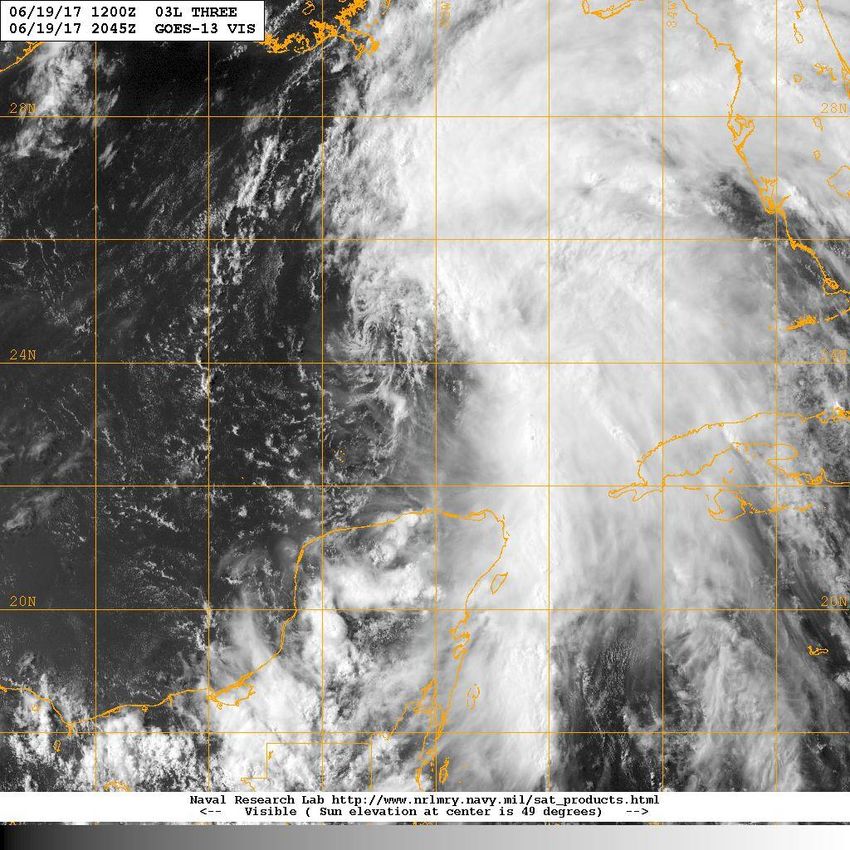
Best 5-day Track Model 2001-2017
Due to model changes and
other factors, the best
performing model often
varies from season to season
EMXI was best model at 5
days in 2017 and has been
since 2015 years running
HWFI was tied with EGRI for
second place in 2017
A global model has been the
best at 5 days every year
since 2001 except one
25Tropical Cyclone
TC Track Models
Models – The NAM
The NAM
TC track errors
from the NAM are
about 50% higher
than the GFS
The NAM should
not be used for
TC forecasting
29 April 2018 2018 National Hurricane Conference 26TC TrackForecast
Forecasting
Continuity
Forecast Challenges
• Large track forecast errors often result from the
following scenarios
1. Low predictability in the large-scale steering pattern
2. Misrepresentation of TC structure in models, resulting
in improper steering flow
3. Weak steering currents, resulting in track being driven
by mesoscale or convective scale factors
27Tropical Weather Outlook
Two-Day Graphic
Current location of
disturbances
(discussed in the Tropical
Weather Outlook)
Formation chance
during the next 48 hrs
• Categorical
(Low, Medium, and High)
• ProbabilitiesTropical Weather Outlook
Five-Day Graphic
• Formation potential
during the next 5 days
• Initial location of
disturbance (X) indicated
• Shading represents
potential formation area
• Single disturbance-based
graphics available to help
when areas overlapPotential Formation Area
Not a 5-day Track Forecast
Tropical Outlook
31 @ 8am
July 28
70%
2 Day – 30%
5 Day – 70%Special Tropical Weather Outlook • Issued anytime there are significant changes with respect to disturbances in the TWO. • Can be updated for either the 2- or 5-day probabilities • Most commonly updated when formation probabilities are too low • Often used to report findings of a recon invest mission
Verification of TWO Probabilities
             48 hour
                            Forecasts very reliable. For
                            example, when NHC has
                            issued a 30% chance of
                            formation of a disturbance
                            within 48 hours, about 32%
                            of the time they have
                            become a TC within that
                            time period.
   Low bias

              High bias
Verification of TWO Probabilities
5-day probabilities
Forecasts generally well-
calibrated.
Low bias for probabilities
from 50-70 %
Low bias
High biasPotential Tropical Cyclone Advisories How Did We Make Due Without This Capability • Allows timely issuance of watches and warnings before a tropical cyclone has formed
Summary of 2017 Pre-TC Watches/Warnings
                             Additional Lead Time*
               Storm
                                    (hours)
               Bret                    24

               Cindy                   21

             Franklin                  6

              Harvey                   6

                Ten               False Alarm

            Lidia (EPAC)               27

              Maria                    6

             Philippe                  21

             Average              15.9 hours
       *Based on Operational Assessments
Watches and Warnings Before
Tropical Cyclone Formation
• Issued only for systems threatening
land within the watch/warning time
frame.
• Initial advisory issuance is not directly
tied to tropical cyclone formation
chance.
• Initial issuance criteria include:
• Likely impacts
• Need for tropical cyclone watches
or warnings
• Desire to avoid switching warning
types (tropical vs. non-tropical)Reminders of Messaging Considerations
for Potential Tropical Cyclones
• Advisory packages will be
discontinued when watches POTENTIAL TROPICAL CYCLONE ONE PUBLIC ADVISORY NUMBER 1
NWS NATIONAL HURRICANE CENTER MIAMI FL AL012016
and warnings are no longer 400 PM CDT WED JUN 5 2016
...TROPICAL DISTURBANCE OVER THE EAST-CENTRAL GULF OF
necessary. MEXICO EXPECTED TO BECOME A TROPICAL STORM...
...TROPICAL STORM WARNING ISSUED FOR PORTIONS OF THE WEST
COAST OF FLORIDA...
• When the threat is not SUMMARY OF 400 PM CDT...2100 UTC...INFORMATION
-----------------------------------------------
LOCATION...25.3N 86.5W
imminent this could result ABOUT 310 MI...500 KM SW OF TAMPA
ABOUT 320 MI...510 KM SSW OF APALACHICOLA FLORIDA
in occasional gaps in MAXIMUM SUSTAINED WINDS...35 MPH...55 KM/H
PRESENT MOVEMENT...N OR 360 DEGREES AT 3 MPH...6 KM/H
MINIMUM CENTRAL PRESSURE...1010 MB...29.92 INCHES
product issuance.
WATCHES AND WARNINGS
--------------------
CHANGES WITH THIS ADVISORY...
A Tropical Storm Warning has been issued for the west
coast of Florida from Boca Grande to Ochlockonee River.
SUMMARY OF WATCHES AND WARNINGS IN EFFECT...
A Tropical Storm Warning is in effect for...
* The west coast of Florida from Boca Grande to Ochlocknee
River
A Tropical Storm Warning means that tropical storm
conditions are expected somewhere within the warningPotential Tropical Cyclone
Messaging Considerations
• Earlier NHC advisories for systems
that pose a long-range threat to the
United States or other land areas.
• Forecasts likely to have greater
uncertainty.
• Intensity forecasts are likely to
be conservative.
• False alarms could:
• Reduce long-term effectiveness
of watches and warnings
• Affect reputation & trust of NHC
tropical cyclone forecastsPre-Harvey Timeline (Texas)
• NHC began mentioning potential hazards
for Texas in 1 PM CDT Tuesday Tropical
Weather Outlook, a little more than 24
hour before redevelopment occurred
• Storm surge
• TS or hurricane-force winds
• Heavy rainfall
• Mentioned likelihood of a TS or hurricane
watch at 1 AM CDT Wednesday
• Hurricane and Storm Surge Watch issued
at 10 AM CDT Wednesday when Harvey
regenerated as a Tropical Depression
• If confidence in development and potential impacts to land are high, should
NHC have the option to issue Potential Tropical Cyclone advisories before
the watch phase?
• Would the potential for additional false alarms outweigh the need for
watch, warning, and forecast information before formation?Potential Tropical Cyclone
Invest in New Terminology?
• Feedback suggests that Potential Tropical
Cyclone wording is not well understood by
the public
• Media indicated that it was difficult to
communicate
• Suggested wording has included:
• Potential Tropical Storm
• Potential Hurricane
• Potential Tropical Threat
• Tropical Disturbance
• Others?
• Does the name Potential Tropical Cyclone cause public confusion?
• Is there a better naming convention?Key Takeaways • Invests say nothing about a systems development potential. Users should refer to the Tropical Weather Outlook! • Genesis probabilities are reliable – Low does not mean no! • Hatched areas on the 5-day Graphical TWO represent the potential formation area – not a true track forecast. • NWS/NHC now able to provide appropriate lead time for watches and warnings for potential tropical cyclones!!
TCConcluding
   Track Models
             Remarks – Track Models
Summary
• Global models are the most skillful for TC track prediction
• Consensus aids are more skillful than most individual
  models, and often beat the official track forecast
   – NHC forecasters have philosophical constraints on the official
     forecast that leads to a certain amount of response lag
   – May contribute to forecast biases and slightly poorer
     performance than the consensus
• While it is possible to beat the models from time to time,
  model performance has improved significantly over the
  years, and they are very difficult to beat consistently
                                                                  47
TCConcluding
Track Models
Remarks – Track Models
Summary
• Large track forecast errors often occur due to
– Uncertainty in large-scale atmospheric flow
– Uncertainty in TC intensity and structure
• Track guidance for invests should be treated
with extreme caution
48NHC Forecast Philosophy
Forecast Continuity
Forecast Continuity
• Previous official forecast exerts a strong constraint on the
current forecast
• Credibility can be damaged by making big changes from
one forecast to the next, and then having to go back (flip-
flop, windshield-wiper)
– Changes to the previous forecast are normally made in small
increments
– We strive for continuity within a given forecast (e.g., gradual
changes in direction or speed from 12 to 24 to 36 h, etc.)
• As a result, NHC official forecasts are often slower to
reflect big changes than the model guidance 49Rapid Changes
Forecast Continuity
Messaging Large Forecast Shifts
• Large shifts in the NHC
track forecast are
sometimes necessary,
typically due to large
shifts in the guidance
• This can be difficult to
message, since the shift
may occur over 2 or 3
forecast cycles
• Look for key messages in
the TCD, and can be
discussed by your local
TS Debby (2012) Cone Graphics
office or NHC Advisories 4 through 9 50Rapid Changes
Forecast Continuity
Messaging Large Forecast Shifts
THE TRACK FORECAST IS EVEN MORE COMPLEX.
THE GFS INSISTS ON A TRACK TOWARD THE
NORTHEAST AS DEBBY BECOMES EMBEDDED WITHIN
A LARGE MID-LATITUDE TROUGH. HOWEVER...THE
ECMWF AND THE HWRF BUILD A RIDGE TO THE
NORTH OF DEBBY AND FORECAST A WESTWARD
TRACK. GIVEN THE WESTWARD TURN INHERITED
FROM THE PREVIOUS FORECAST...AS WELL AS
THE HISTORICAL STRONG RECORD OF THE
ECMWF...THE NEW OFFICIAL FORECAST MOVES
DEBBY INITIALLY A LITTLE BIT TO THE
NORTHEAST TO REFLECT CURRENT TRENDS BUT
THEN TURNS THE CYCLONE BACK TOWARD THE
WEST OR WEST-NORTHWEST IN 24 TO 36 HOURS.
A MAJORITY OF THE GFS ENSEMBLE MEMBERS NOW
ARE CONSISTENT WITH THE DETERMINISTIC
RUN...WHICH WAS NOT THE CASE
YESTERDAY...MAKING A STRONGER CASE FOR THE
EASTWARD SOLUTION. WE MUST BE READY TO
MAKE A CHANGE OF THE FORECAST TRACK AT ANY
TIME.
TS Debby (2012) Advisory 5 Discussion TS Debby (2012) Advisory 5 Cone Graphic
51Rapid Changes
Forecast Continuity
Messaging Large Forecast Shifts
THERE HAS BEEN A SIGNIFICANT CHANGE IN THE
FORECAST TRACK WITH THIS ADVISORY. THE
OFFICIAL FORECAST NO LONGER BRINGS DEBBY
WESTWARD ALONG THE NORTHERN GULF OF MEXICO
AND INSTEAD KEEPS THE CYCLONE MEANDERING OVER
THE NORTHEASTERN GULF FOR THE NEXT 3 TO 4
DAYS. THIS FORECAST IS A COMPROMISE BETWEEN
THE CONSISTENT EASTWARD SOLUTION PROVIDED BY
THE GFS FOR THE PAST SEVERAL DAYS AND THE NEW
TWIST OF THE ECMWF. THE ECMWF MODEL...WHICH
HAS BEEN FORECASTING DEBBY TO MOVE WESTWARD
ALONG THE GULF OF MEXICO... NOW HAS THE
CYCLONE MEANDERING FOR THE NEXT 3 DAYS OVER
THE NORTHEASTERN GULF. SINCE THESE TWO
RELIABLE MODELS ARE IN MARGINALLY BETTER
AGREEMENT...I AM A LITTLE MORE
CONFIDENT...BUT NOT COMPLETELY...THAT DEBBY
IS NOT GOING TO TURN WESTWARD OVER THE GULF.
HOWEVER...NEW OFFICIAL TRACK REMAINS A LOW-
CONFIDENCE FORECAST.
TS Debby (2012) Advisory 6 Discussion TS Debby (2012) Advisory 6 Cone Graphic
52Rapid Changes
Forecast Continuity
Messaging Large Forecast Shifts
BEST GUESS AT INITIAL MOTION IS QUASI-
STATIONARY. DEBBY REMAINS IN A COL REGION OF
THE MID-TROPOSPHERIC STEERING FLOW BETWEEN
TWO ANTICYCLONES...AND IS LIKELY TO REMAIN SO
FOR THE NEXT COUPLE OF DAYS. THEREFORE LITTLE
MOTION IS ANTICIPATED DURING AT LEAST THE
FIRST HALF OF THE FORECAST PERIOD. IN THE
LONGER-TERM...THE TRACK GUIDANCE CONTINUES TO
BE ALL OVER THE PLACE...WITH SOME MODELS
TAKING DEBBY WEST AND NORTH OF ITS CURRENT
POSITION AND OTHERS MOVING EAST OR NORTHEAST
AND ULTIMATELY INTO THE ATLANTIC. THE LATTER
SCENARIO ASSUMES THAT DEBBY WILL EVENTUALLY
BE INFLUENCED BY A MID-TROPOSPHERIC TROUGH
OVER THE NORTHEASTERN UNITED STATES. THIS
SCENARIO SEEMS MORE LIKELY SINCE IT IS
SUPPORTED BY BOTH THE GFS AND THE ECMWF
MODELS. REGARDLESS OF WHICH SCENARIO PLAYS
OUT...THE CYCLONE DOES NOT SEEM TO BE GOING
ANYWHERE ANYTIME SOON.
TS Debby (2012) Advisory 8 Discussion TS Debby (2012) Advisory 8 Cone Graphic
53Rapid Changes
Forecast Continuity
Messaging Large Forecast Shifts
GLOBAL MODELS DEPICT AN AMPLIFYING TROUGH
OFFSHORE THE EASTERN SEABOARD CAUSING DEBBY
TO MOVE GENERALLY EASTWARD THROUGH THE
FORECAST PERIOD...WITH THE CENTER EMERGING
OVER THE SOUTHWEST ATLANTIC BY DAY 5. THE
ECMWF/GFS SOLUTIONS BEGIN TO LIFT OUT THE
WESTERN ATLANTIC TROUGH IN ABOUT 72
HOURS...WHICH COULD LEAVE DEBBY IN WEAK
STEERING CURRENT AGAIN AFTER THAT TIME. SINCE
YESTERDAY... THE GUIDANCE HAS COME INTO
BETTER AGREEMENT...WITH ONLY THE UKMET NOW
SHOWING A WESTWARD MOTION. IN ADDITION...THE
LATEST GFS ENSEMBLE MEMBERS FAVOR AN EASTWARD
MOTION BY ABOUT A 3 TO 1 RATIO. THE NEW
FORECAST TRACK REPRESENTS A SUBSTANTIAL
CHANGE FROM THE PREVIOUS ONE BUT IS STILL
SLOWER THAN THE MULTI-MODEL CONSENSUS IN THE
SHORT TERM.
TS Debby (2012) Advisory 9 Discussion TS Debby (2012) Advisory 9 Cone Graphic
54Are the NHC track forecasts
improving?Atlantic Track Error Trends
1960-69
1970-79
1960-69
1980-89
1970-79
1980-89
2000-09
1990-99
2000-09
1990-99 2010-16
1954-59 2010-17
2017
preliminary3 day average track errors
19903 day average track errors
1990
2017Track Errors over the past 5 years
In general, track errors increase
about 30-40 n mi per day. 210
181
158
138
113
98
77
67
45
37Average track errors
Average track errors
Average track errors
Average track errors
Average track errors
Average track errors
Outside RMW, significant storm surge
Average track errors

Direct hit, highest surge and strongest winds
Average track errors
Averages are nice to know, but each
         case is different
2017 Storms 5-year average
48-h Model Track Errors by Storm

        Considerable storm-to-storm variability
Track Errors by Intensity
As the initial intensity
of the storm increases,
NHC track errors on
average get smaller.NHC Forecast Cone • Represents probable track of tropical cyclone center • Formed by connecting circles centered on each forecast point (at 12, 24, 36 h, etc.) • Size of the circles determined so that, for example, the actual storm position at 48 h will be within the 48-h circle 67% of the time
2018 Atlantic Cone
Forecast period (h)   Circle radii   Change from 2010
                         (n mi)

        12                26           28% smaller

        24                43           31% smaller

        36                56           34% smaller

        48                74           31% smaller

        72               103           36% smaller

        96               151           31% smaller

       120               198           31% smaller
NHC Track Cone Questions
Does the cone tell you about impacts?
No
Does the cone know if the system is big or small?
No
Does the cone know if the forecast is
confident or highly uncertain?
NopeWill the NHC track forecasts
continue to improve?
Skill has been levelling off for the
past few years.Tropical Cyclone
Tropical Intensity
Cyclone Intensity
Overview
• Much more complex forecast
problem than track
– Involves interactions between
thunderstorms in the core, the
environment, and atmosphere-ocean
interactions
• Important factors
– Track
– Wind, temperature, and moisture
patterns in the core and the near
environment
– Internal processes, such as eyewall
replacement cycles, that are poorly
understood 76Tropical Cyclone
Tropical Intensity
Cyclone Intensity
Overview
• Statistical models tell us normal behavior in a given
situation
– Extremely difficult to forecast unusual or extreme changes in intensity
– Consequently, confidence is usually not high enough to show rapid changes
in intensity in the official forecast
• Dynamical intensity models have typically lagged the
statistical models, but HWRF and HMON both beat the
statistical models in 2017
• Intensity consensus aids typically shows the most skill
• Official forecast tries to maintain continuity with
previous forecast, if possible
77Intensity Model
Concluding RemarksVerification
– Track Models
Atlantic – 2017 (Preliminary)
OFCL skillful at all times, but
trailed consensus models at
most time periods
FSSE best model from 24 to
72 h
HWFI was a strong performer,
best individual model
HMNI not as good as HWFI, but
beat statistical aids
DSHP and LGEM were fair
performers, but not as good as
HWFI, HMNI, and consensus
models
CTCI showed increased skill
with time, strong performer days
3-5
GFSI had some skill, but not
competitive; EMXI not skillful
29 April 2018 2018 National Hurricane Conference 78Tropical Cyclone
Tropical Intensity
Cyclone Intensity
Challenges – Rapid Intensification
• Intensity guidance from
first forecast when Harvey
regenerated in the Gulf of
Mexico (12Z 23 August
MH 2017)
• Actual intensity increased
30 kt in 24 h and
65 kt in 48 h
H
• No guidance from this
cycle showed Harvey
reaching hurricane
intensity before landfall
• Landfall intensity
115 kt (cat 4)
29 April 2018 2018 National Hurricane Conference 79TCConcluding
Intensity Models
Remarks – Track Models
Summary
• Forecasting rapid intensification remains a big
challenge, but we are making some progress
• Regional dynamical hurricane models are now
competitive with statistical approaches
• Proper specification of the initial vortex remains a big
roadblock to improving dynamical model forecasts
– How to best use the data in the models?
– What do you use for storms with little in situ data?
29 April 2018 2018 National Hurricane Conference 83Are the NHC intensity forecasts
improving?Atlantic Intensity Error Trends
1970-79, 80-89, 90-99 2000-09
2010-16
2017
Prelim
Only small improvements between 1980-2009, but errors have
decreased more sharply this decade.Intensity Errors over the past 5 years
Intensity errors increase for 3 days, then level off.
15 15
13
11
8So What WILL you see in NWS
briefings before guidance is
available?Instead of Spaghetti Plots…
Setting the Stage
We still struggle with words!
Verification Web Page
Questions?

 Thanks again to Dan Brown, Mike
Brennan and John Cangialosi at the
   National Hurricane Center!!!!
You can also read