North Island Monthly Fire Danger Outlook (2020/21 Season)
←
→
Page content transcription
If your browser does not render page correctly, please read the page content below
North Island Monthly Fire Danger Outlook (2020/21 Season)
 ISSUE: November 2020
Current fire danger situation                                                  For the month of November, a wetter than usual North Island is forecast.
In general, monthly fire danger and fire climate severity are Low to           November temperatures are predicted to run well above average, with
Moderate across much of the North Island (Figures 4, 5 & 9). The               muggy conditions common across the North Island.
exceptions being small pockets in the Wairarapa, Hawke’s Bay and
Palmerston North, where Moderate to High conditions exist.
                                                                               Locations to watch
                                                                               The fire seasons coinciding with moderate strength La Niña events
Fuel and soil moisture status                                                  occurred in 2010/11, 2007/08, 1999/00 and 1998/99, and are potentially
The Low to Moderate fire danger levels are reflected in the current FWI        good indicators for what to expect this coming fire season (Figure 11).
System codes and indices (BUI, DC, DMC and FFMC). These codes                  As we transition into summer, the combination of warm temperatures,
indicate the ease of ignition, the amount of fuel available for combustion,    low rainfall and strong gusty winds for eastern and southern North Island
and how difficult and prolonged mop-up could be. Currently, fuels are          locations will continue to dry out soils and vegetation, elevating the fire
damp across much of the North Island, making it difficult for a fire to        risk in these areas, increasing the chance for fires starting and spreading
ignite, spread and become deep-seated. Medium to heavy fuels are               more easily.
beginning to show signs of dryness (Moderate to High levels) in northern
and eastern locations, and it is expected to dry out further in November       Over the next three months, the risk of wildfire outbreaks will be Low for
if there is a continued lack of rain and warm temperatures (Figures 5-6 &      much of the North Island, up until Christmas/New Year. However, areas
7-8).                                                                          that continue to experience below normal rainfall, low soil moisture levels
                                                                               and above normal air temperatures will develop an elevated risk. These
Regions with DC and BUI values generally above the historical trend for        locations include the Gisborne, Hawke’s Bay, Manawatu/Whanganui,
this time of the year include: Auckland, Bay of Plenty and the Wairarapa.      Wellington and Wairarapa regions.
Regions with above average DC values but below average BUIs include:
Northland, Waikato, Gisborne, Hawke’s Bay, and the Chatham Islands.            Fire dangers and severity for November are expected to be Low to
Remaining regions are either on trend or below the average (Central            Moderate for most of the North Island. However, there are areas of
North Island, Taranaki, Wellington, Whanganui/Manawatu). Graphs                concern due to current soil moisture status and forecasted below normal
tracking individual station trends are available on the Scion website.         rainfall and increases in air temperature. Specific places to watch include
                                                                               coastal locations in the Bay of Plenty, Gisborne (East Cape), Hawke’s Bay
Soil moisture levels across much of the central North Island are at or         and Wairarapa. Northland and Auckland are also drier than normal, but it
nearing field capacity and are about normal for this time of the year          is anticipated these regions will receive welcomed rainfall relief.
(Figure 2 and 3). However, soils in other areas are showing signs of
dryness, with soil moisture below 50% storage in the Far North, Auckland,
northern Waikato, and coastal areas in the Bay of Plenty, Gisborne,
Hawke’s Bay, Taranaki and Wairarapa regions. Soils are significantly
drier than normal for these northern and eastern locations (and coastal
Taranaki) (Figure 3).

Forecast climate and weather
A moderate to strong La Niña event is now well underway in the tropical
Pacific Ocean. La Niña weather patterns are signalled for November
and will likely continue through until February. High pressure systems
are forecast to centre over the south east of the country, with intermittent
lows in the Tasman Sea. This combination draws moist, warm north-
easterly winds from the tropics across northern New Zealand. This
coming season, there is an elevated risk of significant weather impacts
from a passing ex-tropical cyclone. There are also indications for a marine
heatwave developing in the waters surrounding New Zealand, which can
elevate air temperatures further.
Over the next three months (November – January), New Zealand is
expected to experience above average temperatures. Some significant
warm spells are also forecast as we transition from spring into summer.
Normal rainfall levels are expected for the upper North Island, and normal
to below normal levels expected for remaining North Island locations.
November is likely to experience continued dryness for many locations
and transition to increased chances of moisture and rainfall during
December-January, consistent with recent La Niña events. There is a
greater chance of heavy rainfall events for northern regions, but western
and lower North Island locations are likely to experience dry conditions
into summer. Soil moisture levels and river flows are most likely to be
below normal in the north and near normal or below normal in the west          Map 1. Locations identified as specific areas of interest that have
and east of the North Island.
                                                                               or may develop an elevated risk of high fire danger danger over the
                                                                               next three months.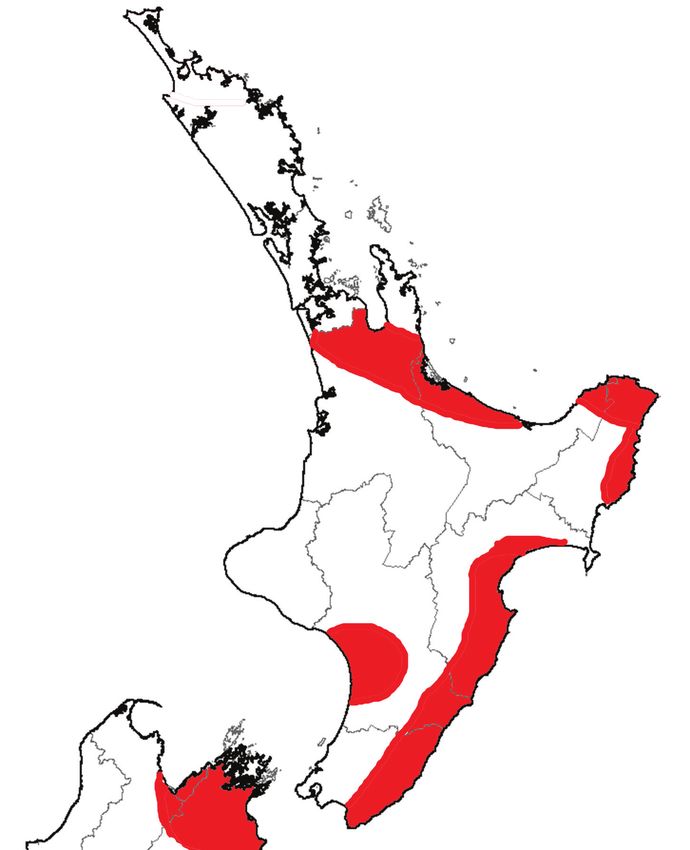
Background
 The purpose of these monthly outlooks is to provide a heads up on current and potential fire danger as we transition from spring to summer
 and, later, into autumn. This is not a detailed fire seasonal outlook for specific localities, nor does it summarise fire potential (which depends
 on fuel conditions (i.e. grass curing), risks of ignitions, recent fire history and fire management resources available in an area, as well as
 weather and climate).
 It aims to forewarn fire agencies of current and potential fire danger conditions that can be used as a prompt for local and regional
 discussions on fire potential. Now is the chance to carry out your pre-planning (if you haven’t done so already), by discussing where
 conditions are at, where they are heading, and how this can drive awareness about what this might mean for fire risk in your patch and for
 your neighbours.

EXPECTED CLIMATE OUTLOOK:                                                    There is a heightened risk for New Zealand to be affected by an
                                                                             ex-tropical cyclone this season. The risk is considered above normal,
One of the major climate drivers for New Zealand is the El Niño–             with equal probabilities of an ex-tropical cyclone passing either to the
Southern Oscillation (ENSO). During the 2020 winter (June to August)         east or west of the North Island. Significant rainfall, damaging winds,
and early spring (September), the ENSO was neutral but developing            and coastal damage by waves are possible in the lead up to and
towards La Niña conditions. La Niña is now currently underway                during these events. These cyclone events can reduce the fire risk
in the tropical Pacific and the ENSO outlook remains at La Niña              in affected areas, with effects often being spread over a large area,
levels for November. International climate models suggest there is a         especially if a decaying storm system interacts with other existing
96% chance that La Niña will continue until the end of summer. For           weather systems.
February to April 2021, the probability for La Niña declines to 59%
and 40% for ENSO-neutral conditions.
Oceanic and atmospheric forecasts indicate moderate to strong La             This month: November 2020
Niña conditions are likely during summer. Most models are predicting         High pressures are forecast over areas in the east and south of the
La Niña to peak in December, with around half the models anticipating        country, with intermittent Tasman lows and easterly winds across
a strong event, the others suggesting it may not be as severe. To            northern New Zealand (a typical weather pattern associated with La
help understand what the fire season could look like in the next             Niña).
three months, recent past events (historical analogues) reminiscent
of a moderate La Niña included 1998/99, 1999/00, 2007/08 and                 For all North Island regions, expect some decent rainfall for the
2010/11. Weak La Niña seasons included 2000/01 and 2011/12. Each             first half of the month, due to the presence of northern Tasman Sea
historical La Niña event has resulted in different weather patterns          lows. The rainfall is likely to be ‘hit and miss’ as to which locations
for New Zealand, with our weather very dependent on where the                experience heavy rainfall. Overall, a wetter than usual November is
high-pressure systems sit (which determines the air flow over New            signalled across most of the North Island. Dryness is expected to
Zealand).                                                                    continue in the Wairarapa.
There is a possibility that the peak strength could reach levels similar     Well above average temperatures are expected for all regions, with
to the La Niña seasons of 2010–12 (a moderate year followed by a             muggy high-humidity conditions expected for the first half of the
weak year). There is a chance weather patterns could match that of           month.
the brief event in the 2017/18 season (classed as a neutral season). If
the season follows a climatic trend for 2017/18, warm seas (compared         Further ahead:
to average) will likely occur in November-December, and a marine
heatwave may develop, pushing up air temperatures for all regions of         Over the next three months (November – January 2021), New
the country, and provide fuel to cyclones approaching from the north.        Zealand will often find itself stuck in the middle of high pressure to
                                                                             the south-east and low pressure to the north-west. This set up is
                                                                             commonly associated with La Niña events, and allows for warm humid
Tropical Cyclone outlook                                                     air to be pulled southwards from the tropics across New Zealand.
November marks the start of the tropical cyclone season for the              North-easterly air flows are also more common with this set up.
Southern Hemisphere (which runs from November to April). On the
odd occasion, cyclone activity can still happen outside this period.         Above average air temperatures are forecast for all regions across
In general, La Niña conditions result in average to below average            New Zealand. Our surrounding sea surface temperatures are
cyclone activity in the South Pacific. On average, about 10 tropical         currently warm and are expected to continue to get warmer over the
cyclones form in the South Pacific between November and April, and           next three months. If the warmth continues to persist over the next
at least one of these affects New Zealand, not as a Tropical Cyclone         few months, New Zealand will likely experience a marine heatwave
but as a large-scale low-pressure system called an ex-tropical               which will have an upward influence on air temperatures (as
cyclone.                                                                     experienced during the 2017/18 season, where New Zealand had its
                                                                             hottest summer on record).
This season, up to 8 named cyclones are expected to form in the
south-west Pacific. Past years similar to this current season suggest        Rainfall is most likely to be near normal in the north of the North
that at least 3 cyclones could reach category 3 strength (considered         Island and about equally likely to be near normal or below normal for
severe, with 118 km/h winds).                                                all remaining regions. November is expected to remain dry for the
                                                                             lower North Island. However, there is the chance for moisture further

Figure 1. Outlook for November 2020 to January 2021: air temperature (left), rainfall (middle), available soil moisture (right).
Source: NIWA.
page: 2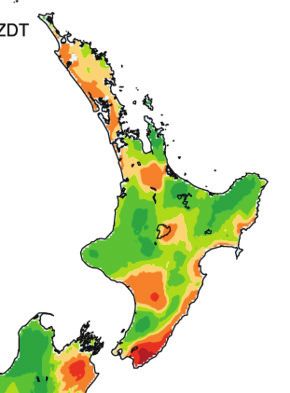
out, with sub-tropical or tropical disturbances likely during December-      the common denominators of tragedy fires.
January.
Soil moisture levels and river flows are expected to be below normal         Grass growth & curing:
in the north of the North Island and near normal or below normal in          During spring, grasses are undergoing a period of growth, and much
the west and east of the North Island.                                       of the countryside is looking green and lush.
                                                                             Normally if a fire was to start in these fuels, fire spread would be
                                                                             difficult. Any burning will produce small flame heights and low
Regional Breakdown (Figure 1):                                               intensities for easy suppression. This will become more of a concern
                                                                             once these green grasslands eventually dry out as we transition from
Temperatures are most likely to be:                                          spring into summer. Warm dry conditions will trigger the maturing
• above average (75% chance) for Northland, Auckland, Waikato,               process of grasslands and set the curing process in motion. Areas of
   Bay of Plenty, Central North Island, Taranaki, Whanganui,                 lush green grass will form seeds and begin turning yellow over the
   Manawatu, and Wellington;                                                 next few months. Higher than normal grass fuel loads could contribute
• above average (65%) for Gisborne, Hawke’s Bay and Wairarapa.               to increased fire intensities and faster rates of spread during the peak
                                                                             of summer.
Rainfall is most likely to be:
• near normal (40% chance) for Northland, Auckland, Waikato, Bay             For locations that are experiencing notable winter and spring
   of Plenty;
• near normal (40%) or below normal (35%) for the Central North
   Island, Taranaki, Whanganui, Manawatu, Wellington, Gisborne,
   Hawke’s Bay and Wairarapa.
Soil moistures and river flows are most likely to be:
• below normal (50% chance) for Northland, Auckland, Waikato and
    Bay of Plenty;
• below normal (40%) or near normal (35%) or for the Gisborne,
    Hawke’s Bay, and Wairarapa;
• average (near their climatological value) for the Central North
    Island, Taranaki, Whanganui, Manawatu, Wellington.

Last month: October 2020
Looking back, intense highs were common during October, often
sitting near the Chatham Islands. This resulted in an extremely dry
October for most of the North Island.
October monthly temperatures were well above average (typically
1.5°C above the monthly average). Intermittent westerly winds
produced unusual heat in eastern regions of both islands during the
month. Once highs became stationary east of the country, warm
northerly air flooded across all regions.
Sea surface temperatures (Tasman Sea and New Zealand coast)                     Figure 2. Soil moisture deficits as of 01/11/2020.
warmed considerably compared to normal. Pockets of ocean                        Source: NIWA.
temperatures in the Tasman Sea and around the New Zealand
coastline were 3 degrees above average.                                         Note: Soil moisture deficit means the amount of water needed to bring
                                                                                the soil moisture content back to field capacity, which is the maximum
                                                                                amount of water the soil can hold.
Soil moisture (Figure 2 & 3)
Eastern and northern locations have had a dry start to spring. Dry
soils continue for the Auckland and Northland regions (but expect
this to change over the next few months). Soils are also dry (at 50%
storage or less) in coastal locations of the Bay of Plenty, Gisborne
(East Cape), Hawke’s Bay and Wairarapa. Soil moistures in remaining
locations (central, lower and western North Island) are nearing or at
field surplus (Figure 2).
This is also reflected in the soil moisture anomaly map (Figure 3).
Drier than normal soils (compared to this time last year) are found
across northern and eastern regions. This includes Northland,
Auckland, northern Waikato, Bay of Plenty, northern Gisborne, coastal
Wairarapa and Taranaki. In contrast, normal to wetter than normal
soils are present in southern Waikato, Manawatu/Wanganui, Taranaki
and Wellington.
According to NIWA’s Drought Index (NZDI), dry and very dry
conditions are present in parts of Northland, Auckland, northern
Waikato, and coastal Bay of Plenty, Gisborne and Wairarapa. There
are currently no locations across the North Island in meteorological
drought.

Fine Fuel Status
Although BUIs may seem below levels considered extreme, fine fuels
under forest canopies or scrublands, and grass pastures (as they
brown off), can still contribute to fast fire spread and large fire sizes,      Figure 3. Soil moisture anomaly as of 01/11/2020.
even under moderate soil moisture dryness and wind strengths. If                Source: NIWA.
a heat source is present in fine fuels with a FFMC of 86 or more, or
grass curing over 80%, ignition will be easy, and a fire can still spread.      Note: Soil moisture anomaly means the difference between the
Don’t be surprised to see incredible rates of spread and surprising             historical normal soil moisture deficit (or surplus) for a given time of year
flame lengths, even with shorter grass. Light, flashy fuels are one of          and actual soil moisture deficits.
                                                                                                                                                    page: 3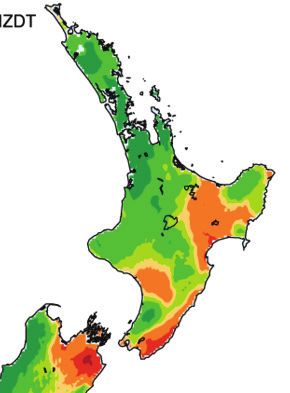
soil moisture deficits, grasslands will be dry and dead (cured),              Oscillation (IPO). Both these operate over the Pacific Ocean and
 increasing the potential for a fire to ignite and spread. Dead                beyond, and cause fluctuations in the prevailing trade winds and in
 material can also come about from snow and frost curing. We’ve                the strength of the subtropical high-pressure belt.
 already seen an early start to the fire season in Otago and South
 Canterbury, where the risk of fires has been exacerbated by                   ENSO in particular has a significant effect on New Zealand’s
 grasses cured by heavy frosts and strong, gusty NW and SW                     weather, explaining around 25% of seasonal temperature and rainfall
 winds.                                                                        differences. El Niño and La Niña are opposite phases of the global
                                                                               ENSO climate cycle. The two phases disrupt the typical wind and
 In some areas, the presence of dead matted material from the                  rainfall patterns for New Zealand. Neutral conditions encourage far
 previous season’s growth (thatch) can contribute to the ease of a             more variability in weather patterns for New Zealand, whereas El Niño
 fire starting and spreading. The material is often hidden underneath          or La Niña tend to have more predictable patterns.
 lush green grass that appears to have low curing (30 - 50%).
 However, thatch can increase a fires ability to carry and sustain
 a fire. These fires will typically produce small flame heights and            Effects on New Zealand
 spread in a patchy manner.                                                    La Niña can encourage warmer than average sea temperatures, and
                                                                               fuel cyclones. The north can experience frequent lows and subtropical
                                                                               storms, occasionally stretching down as far as Canterbury. New
 The finer details:                                                            Zealand is typically warmer than average during a La Niña, although
 The degree of grassland curing represents the proportion of dead              there are regional and seasonal exceptions.
 material in a grassland fuel complex, expressed as a percentage.
 It is an important input for models to predict rate of fire spread and        During La Niña, more high-pressure systems than normal lie over
 determine fire danger levels in grasslands.                                   the east of the country (South Island and Chatham Islands). This
                                                                               generally leads to more north-easterly and easterly winds (as
 Grassland curing will affect fire behaviour in several ways: it               opposed to westerlies).
 increases the amount of dead material present and affects fuel
 moisture content. The result is an increased chance of fire ignition,         Effects on the North Island
 fire intensity and rates of spread. The moisture content of fine grass        For the North Island, this means northern and eastern parts are
 fuels (as well as pine litter and other fine fuels) also dramatically         wetter than normal. It can typically mean a wetter, milder and cloudier
 affects the ignition potential and ability of a wildfire to spread. High      spring. Summer tends to be warmer and more humid than average.
 amounts of moisture increase the heat and thermal conductivity of             The exceptions being eastern locations experiencing onshore winds
 fuel, so that more heat is required for the fuel to reach its ignition        and cloudy skies. Outbreaks of warm northeasterly winds bring rain to
 temperature. As grasses cure, and become drier, less heat is                  areas in the north and east of the North Island, especially Gisborne,
 required to ignite and sustain a fire.                                        Coromandel and Northland. Above normal summer and autumn
                                                                               rainfall often occurs over the far north of New Zealand (Coromandel
 In partially cured grasslands, enough dead fuel needs to be present           northwards).
 to ignite and sustain fire spread. Surrounding green grass with
 higher fuel moisture contents will require substantial heat input to
 burn off excess moisture and ignite. If there is not enough heat to           Note:
 ignite the greener sections of the grass, fire spread will either be          It’s important to note that ENSO events have an important influence
 very patchy or not spread at all. Burning under these conditions              on New Zealand’s climate, but account for less than 25% of seasonal
 will produce very small flame heights, be low intensity and easily            rainfall and temperatures. La Niña is only an important climate driver
 suppressible.                                                                 for New Zealand over long durations (2-6 months) when a moderate
                                                                               or strong event is in force. If a weak La Niña occurs, it means our
 It is often necessary to part the current season’s grass to examine           ‘local’ climate players (the Southern Ocean southerlies and Tasman
 how much thatch is underneath. Even if a paddock has been                     Sea lows) will continue to take turns ruling our weather.
 harvested or grazed, there is often a couple centimetres of dead
 grass remaining.                                                              This is a good reminder that local climate patterns (blocking Highs
                                                                               over or near New Zealand, Lows over the Tasman Sea or to the north
                                                                               of the country, and the Southern Ocean storms) generally ‘trump’
 What does La Niña mean for NZ?                                                climate patterns such as El Niño and La Niña.
 New Zealand’s climate is influenced by two key natural cycles: the
 El Niño-Southern Oscillation (ENSO) and the Interdecadal Pacific

                         October 2020                                     November 2007                             November 2011

     Low

Moderate

    High
Very high
 Extreme

Figure 4. Monthly average Severity Rating for: the previous month (left), and expected average monthly values during the 2007/08
moderate strength La Niña (left) & 2011/12 (right) weak strength La Niña year.
 page: 4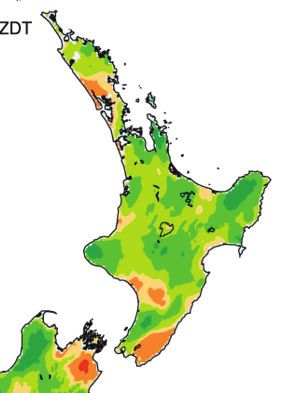
October 2020                                November 2007                            November 2011

 FWI values
      Low
 Moderate
      High
 Very high
  Extreme

                      October 2020                            November 2007                              November 2011

BUI values

     Low
Moderate
     High
Very high
 Extreme

                     October 2020                               November 2007                            November 2011

 ISI values
      Low
 Moderate
      High
 Very high
  Extreme

Figure 5. Previous Monthly Average for the: Fire          Figure 6. Expected average Monthly values of: Fire Weather Index (top), Buildup
Weather Index (top), Buildup Index (middle) and Initial   Index (middle) and Initial Spread Index (below); and during the 2007/08 moderate
Spread Index (below).                                     strength La Niña (left) & 2011/12 (right) weak strength La Niña year.

                                                                                                                               page: 5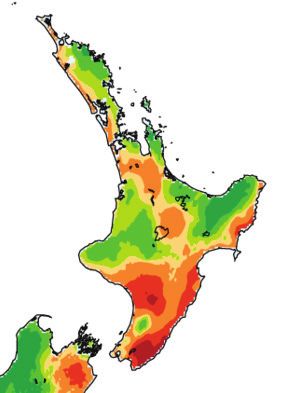
October 2020                             November 2007                        November 2011

 DC values
      Low
 Moderate
     High
 Very high
  Extreme

                    October 2020                             November 2007                          November 2011

DMC values

     Low
Moderate
    High
Very high
 Extreme

                    October 2020                            November 2007                          November 2011

FFMC values

     Low
Moderate
    High
Very high
 Extreme

Figure 7. Previous monthly average for the: Drought    Figure 8. Average monthly values of: Drought Code (top), Duff Moisture Code
Code (top), Duff Moisture Code (middle) and the Fine   (middle) and Fine Fuel Moisture Code (below); and during the 2007/08 moderate
Fuel Moisture Code (below).                            strength La Niña (left) & 2011/12 (right) weak strength La Niña year.

    page: 6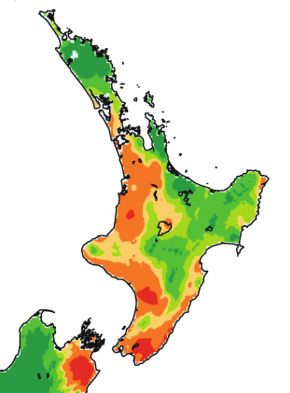
October 2020                            November 2007                            November 2011

 Forest Fire Danger
      Low
 Moderate
      High
 Very high
  Extreme

                      October 2020                        November 2007                              November 2011

Grass Fire Danger

     Low
Moderate
     High
Very high
 Extreme

                      October 2020                          November 2007                            November 2011

 Scrub Fire Danger
      Low
 Moderate
      High
 Very high
  Extreme

Figure 9. Previous Monthly Average for: Forest Fire   Figure 10. Expected average monthly values of: Forest Fire Danger (top),
Danger (top), Grassland Fire Danger (middle) and      Grassland Fire Danger (middle) and Scrub Fire Danger (below), during the
Scrub Fire Danger (below).                            2007/08 moderate strength La Niña (left) & 2011/12 (right) weak strength La Niña
                                                      year.
                                                                                                                           page: 7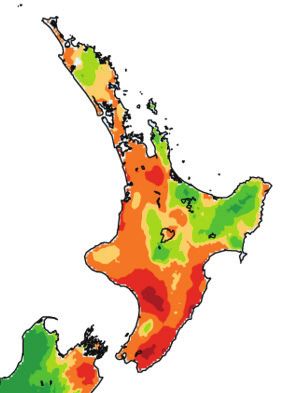
September             October              November               December                 January                February                 March                    April                  May

page: 8
          2011 - 2012
          2007 - 2008
          2010- 2011
                                                                                                                                                                                                                 Low

                                                                                                                                                                                                            Moderate

                                                                                                                                                                                                                High
                                                                                                                                                                                                            Very high

          2020 - 2021
                                                                                                                                                                                                             Extreme

                Figure 11. New Zealand Fire Season Severity (monthly)
                The years of 2007/08, 2010/11, 1999/00, and 1998/99 and are ideal comparisons for what the North Island might experience over the next few months. These years were moderate strength La Niña years,
                2011/12 was a weak La Niña event. DSR values of less than one equates to low fire behaviour potential, 1-3 moderate fire potential, 3-7 high to very high fire potential, and above 7 extreme fire behaviour
                potential.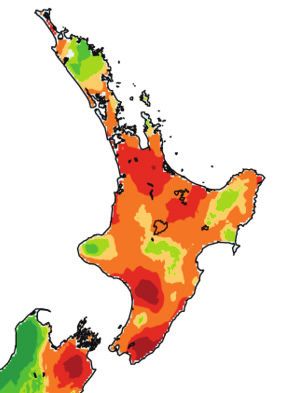
Note:
Tracking trends
Comparisons of fire dangers for individual indicator stations for different regions are not shown in this outlook due to the low fire danger and
severity across the country. As fire dangers increase, more detailed regional outlooks will recommence highlighting where Buildup Index (BUI),
Drought Code (DC) and Cumulative Daily Severity Rating (CDSR) values sit in comparison with previous fire seasons.
For fire managers who are interested in tracking fire season trends for all your weather stations, the graphs are
available monthly on the Scion Rural Fire Research website. If tracking is required on a more frequent basis (as
opposed to the monthly analysis done here), please contact Scion for the data.
Background info on FWI codes and indicies:
Fine Fuel Moisture Code (FFMC) Duff Moisture Code (DMC) A rating of the Drought Code (DC) A rating of the average
An indicator of the relevant ease of average moisture content of loosely moisture content of deep, compact,
ignition and flammability of fine fuels. compacted organic soil layers (duff/ organic soil layers, and a useful indicator
humus) of moderate depth, and of seasonal drought effects on forest
0 - 74 Difficult medium-sized woody material fuels and amount of smouldering in deep
duff layers and large logs.
75 - 84 Moderately easy 0 - 10 Little mopup needs
85 - 88 Easy 0 - 100 Little mopup needs
11 - 20 Moderate
89 - 91 Very easy 101 - 175 Moderate
21 - 30 Difficult
92 + Extreme easy 176 - 250 Difficult
31 - 40 Difficult & extended
251 - 300 Difficult & extended
41 + Difficult & extensive
301 + Difficult & extensive
Buildup Index (BUI) Initial Spread Index (ISI) Combines the Fire Weather Index (FWI)
Combines the DMC and DC, and effect of wind speed and the FFMC,
represents the total amount of Combines the ISI and BUI to indicate
providing a numerical rating of the potential head fire intensity of a
fuel available for combustion. potential fire spread rate. spreading fire (on level terrain).
0 - 15 Easy control 0-3 Slow rate of spread
0-5 Low fire intensity
16 - 30 Not difficult 4-7 Moderate fast
6 - 12 Moderate
31 - 45 Difficult 8 - 12 Fast
13 - 20 High
46 - 59 Very difficult 13 - 15 Very fast
21 - 29 Very High
60 + Extremely difficult 16 + Extremely fast
30 + Extreme
Daily Severity Rating (DSR) A numerical rating of the daily fire weather severity at a particular station, based on the FWI. It
indicates the increasing amount of work and difficulty of controlling a fire as fire intensity increases. The DSR can be
averaged over any period to provide monthly or seasonal severity ratings.
Monthly Severity Rating (MSR) is the average of the DSR values over the month. DSR and MSR captures the effects of
both wind and fuel dryness on potential fire intensity, and therefore control difficulty and the amount of work required to
suppress a fire. It allows for comparison of the severity of fire weather from one year to another.
0-1 Low fire behaviour potential
1-3 Moderate fire potential
3-7 High to very high fire potential
7+ Extreme fire behaviour potential
Acknowledgements:
Fire Danger interpretation was from information gathered from the Average Monthly Maps for: Severity Rating, FWI, BUI, ISI, DC,
DMC, FFMC, Grassland FDC, Scrub FDC & Forest FDC. These maps were obtained from the Fire and Emergency New Zealand’s
Fire Weather System powered by Eco Connect.
Information on the Expected Climate Outlook was gathered from:
• MetService, Rural Monthly outlooks:
www.metservice.com/rural/monthly-outlook
• NIWA, Seasonal Climate outlook:
www.niwa.co.nz/climate/sco
• Australian Bureau of Meteorology Climate outlooks
http://www.bom.gov.au/climate/ahead/?ref=ftr
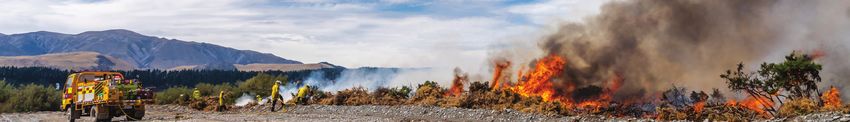
Front Cover Image: 2020 Research Burns (V Clifford, Scion).
page: 9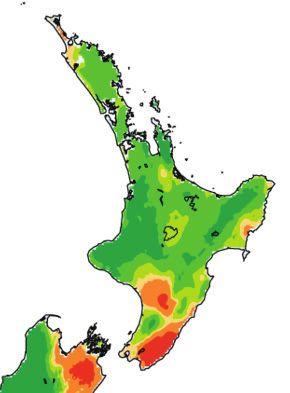
You can also read