Liquefaction exposure and impacts across New Zealand State Highways
←
→
Page content transcription
If your browser does not render page correctly, please read the page content below
Liquefaction exposure and impacts
across New Zealand State Highways
A. Lin & L. Wotherspoon
University of Auckland, New Zealand.

D. Blake, B. Bradley & J. Motha
University of Canterbury, New Zealand.

ABSTRACT
New Zealand State Highways are exposed to a range of natural hazards including earthquake triggered
liquefaction and lateral spreading. Using a recently developed geospatial model, a framework to assess the
liquefaction risk across the State Highway network was proposed, combining liquefaction probability,
recurrence and potential socio-economic impact. To demonstrate this framework, liquefaction susceptibility
and probability was estimated across the State Highway network for a set of ten earthquake scenarios.
Overall exposure was measured for each network section by counting the number of earthquakes that result
in a liquefaction probability of 40 % or higher (liquefaction recurrence). In addition, results were linked to
the One Network Road Classification (ONRC) in order to quantify the potential socio-economic impact.
Model outcomes suggests that network sections with a high liquefaction exposure do not necessarily lead to
extensive consequences, and vice versa, suggesting that both exposure and impact are important to evaluate
liquefaction risk across the State Highway network. Further research needs to include more seismic events,
elaborate on network criticality, such as the consideration of indicators specific to freight movement, and
take alternative routes as well as alternative transport modes into account. This research aims to support
decision making processes regarding infrastructure investment, emergency planning and prioritisation of
post-earthquake reconstruction projects.

1   INTRODUCTION
Liquefaction and lateral spreading can result in major damage to buildings and infrastructure, such as
differential settlement of buildings, distortion of roads, or breakage of buried infrastructure (Mian et al.
2013). Because of the presence of large regions of loose, young soil deposits and high seismic activity, much
of New Zealand is prone to liquefaction-induced damage. One example is the 2010-2011 Canterbury
earthquake sequence, when liquefaction and lateral spreading caused substantial damage to the built
environment, including 60,000 residential houses and major parts of the urban infrastructure systems

                                                       1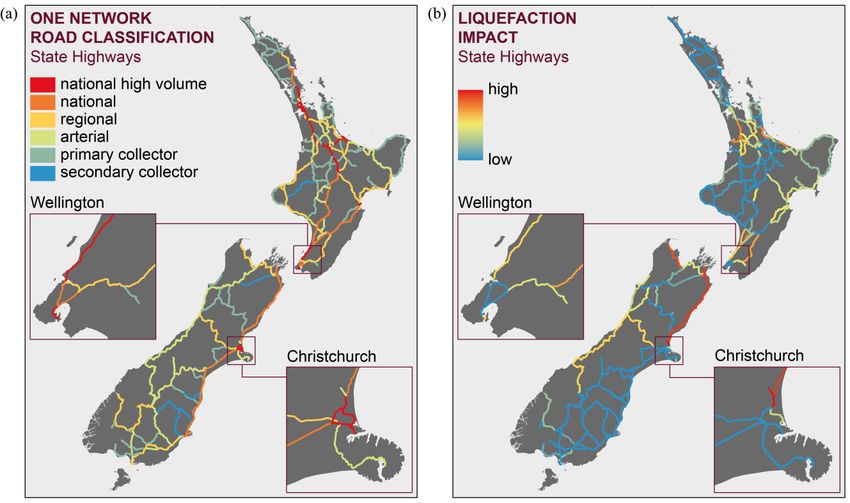
(Cubrinovski 2013). To estimate the potential extent of affected properties and assets, liquefaction hazard
maps are commonly used. However, obtaining information on soil properties, which is required to develop
hazard maps, usually involves extensive field investigations (e.g. cone penetration testing) and the
application of simplified liquefaction evaluation procedures (Boulanger & Idriss 2014; Zhu et al. 2017).
When assessing distributed infrastructure networks, these methods may not be suitable due to cost and time
required to adequately characterise long linear extents. In this case, prediction models based on geospatial
data can be used as an alternative approach. Zhu et al. (2015, 2017) developed and updated a globally
applicable model to predict liquefaction based on geospatial information, such as water table depth and
near-surface shear wave velocity of soil deposits (details provided in the section 2).
The paper uses the Zhu et al. (2017) model to estimate liquefaction susceptibility and probability for ten
earthquake events across the New Zealand State Highway network. Because of its large spatial distribution,
it can be disrupted in a range of different earthquake scenarios. This paper focusses on sections of the State
Highway network that are predicted to be affected by liquefaction in multiple scenarios. Linking the results
to the One Network Road Classification (ONRC), a framework to standardise the performance of New
Zealand roads, provides further information on potential socio-economic impacts.
2 GEOSPATIAL LIQUEFACTION MODEL
Zhu et al. (2015, 2017) developed and updated a model based on globally accessible geospatial variables that
can be related to liquefaction manifestation. Using logic regression, they evaluated each variable by
correlating them to 22 earthquakes in the United States, New Zealand and Asia. They found that a
combination of time-averaged shear wave velocity over the first 30 m of the soil profile (VS30, by Wald &
Allen (2007)), water table depth (by Fan et al. (2013)), distance to closest water body (HydroSHEDS,
OceanColor), precipitation (WorldClim) and peak ground velocity (by Stirling et al. (2012)) leads to the
most promising results in terms of predicting the extent of liquefaction manifestation. A common limitation
that was observed when applying the Zhu et al. (2017) model to different regions around the globe was the
tendency to overestimate liquefaction in areas with high rainfall or for seismic events with large epicentral
distances (Baise & Rashidian 2017). Another constraint arises from the input variables, which are retrieved
from sources that use simplified methods and provide low resolution in order to achieve global coverage
(except for peak ground velocity), possibly leading to spatial inaccuracy when applied on regional or local
level. Despite these limitations, the model shows great potential for large scale liquefaction assessments, and
proved to perform reasonably well for the 2010 Darfield and 2011 Christchurch earthquake (Baise &
Rashidian 2017; Maurer 2017; Zhu et al. 2017).
3 EARTHQUAKE SCENARIOS
According to GeoNet statistics (n.d.), New Zealand experiences around 20,000 earthquakes per year, around
30 of them result in moderate shaking (magnitude 5 or higher). The events discussed in this paper were
chosen based on their (expected) ground shaking intensity and areal distribution, intending to achieve a
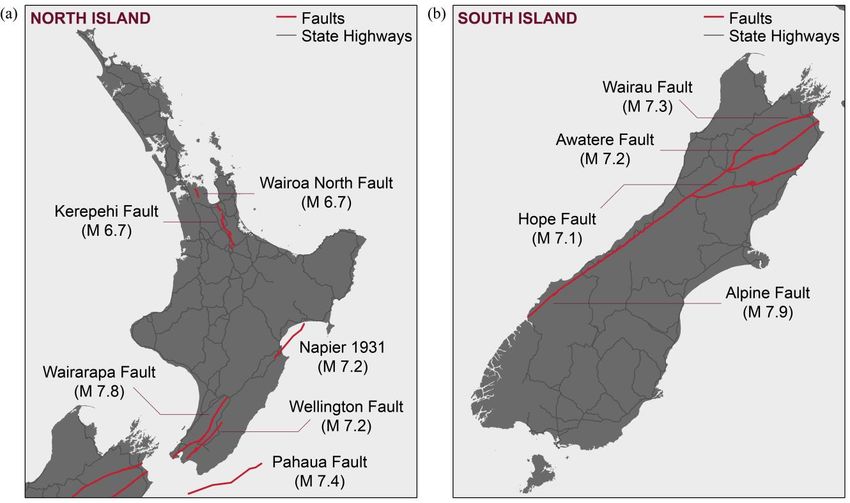
maximum disruption of the State Highway network. Figure 1 presents the faults (red lines) on which the
ruptures are predicted to occur and the location of the State Highways (grey lines). The simulation uses the
updated National Seismic Hazard Model for New Zealand developed by Stirling et al. (2012). Each
earthquake is expected to lead to a moment magnitude of 6.7 or higher, causing strong ground shaking. The
probability of the rupture in the next 50 years ranges from 0.4 % (Wairoa North Fault) to 16 % (Hope Fault).
Except from the Pahaua Fault, all faults are on-shore. Five of the faults are located in the North Island
(Figure 1a), with the highest probability in 50 years being the Wairarapa Fault (4.1 %) and the Wellington
Fault (5.8 %), both affecting the southern part of the North Island. On the Wairarapa Fault, a magnitude 8 +
rupture occurred in 1855, which is assumed to be the largest seismic event in New Zealand since European
2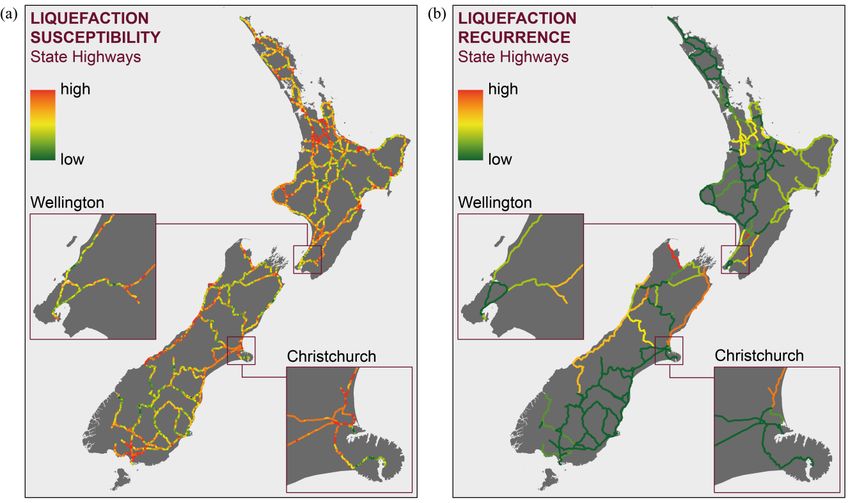
Figure 1: Location of faults (including magnitude M of rupture) and State Highways on the (a) North Island
and (b) South Island, New Zealand.

settlement (Rodgers & Little 2006). “Napier 1931” refers to the Hawke’s Bay earthquake in 1931, the most
destructive earthquake in terms of casualties in New Zealand (NZMCH 2017).
The remaining earthquakes are on four faults in the South Island (Figure 1b) with the Wairau Fault, Awatere
Fault and Hope Fault primarily affecting the northern part of the island, and the Alpine Fault extending down
the majority of the West Coast. The Alpine Fault is one of the longest (approx. 850km) and fastest moving
plate boundary transform faults in the world (Berryman et al. 2012). A rupture propagating northwards
(Fiordland to Kaniere) is expected to result in severe ground shaking (magnitude 7.9) and to affect much of
the South Island infrastructure networks. The probability of an Alpine Fault earthquake in the next 50 years
is 14 % based on the simulation model used in this paper (Stirling et al. 2012); however, research relying on
other models suggests probabilities up to 29 % (Sutherland et al. 2006).
All ten earthquakes result in strong ground shaking covering large areas of the State Highway network. The
location of the faults indicates that State Highways in the northern central and southern part of the North
Island, as well as in the west northern part of the South Island are more likely to be affected by at least one of
the earthquake scenarios. However, this information is not sufficient to properly evaluate liquefaction
exposure as soil properties vary across the country. Liquefaction susceptibility and probability also need to
be calculated for each part of the network in order to identify the State Highways that could be affected.

4    LIQUEFACTION EXPOSURE OF THE STATE HIGHWAY NETWORK
The State Highway network is converted into a point feature class by creating points along the road
centrelines with a spacing of 100 m. This high resolution allows for a detailed assessment of the network on
both a national and regional level. Liquefaction susceptibility and liquefaction probability (for the ten
earthquake scenarios) is then calculated for each point using the Zhu et al. (2017) model.

                                                        3
Figure 2: Hazard maps of New Zealand State Highways showing (a) liquefaction susceptibility and (b)
liquefaction recurrence based on a liquefaction probability of 40 % and above.

4.1 Liquefaction susceptibility
Annual precipitation, water table depth, distance to closest water body, and VS30 are used to calculate
liquefaction susceptibility for each State Highway point following the Zhu et al. (2017) approach. Figure 2a
shows the liquefaction susceptibility map of the entire State Highway network. On a national scale, hotspots
can be observed in the central area of the North Island and along both the East and West Coasts of the South
Island. In general, parts of the network which are close to the coast seem to be more susceptible than parts
located inland. This is a result of the input variable distance to water accounting for higher ground
saturation, which is a main indicator for liquefaction susceptibility (Zhu et al. 2017). Focussing on
Wellington and Christchurch on a regional level, emphasises that other factors contributing to saturation,
such as water table depth, are relevant to susceptibility as well. Although both cities are in close proximity to
water, the State Highways in Christchurch appear to be more susceptible to liquefaction than the State
Highways in Wellington (except for southern end of the State Highway headed to CentrePort). Christchurch
is situated on a sedimentary basin with low lying alluvial soil and a shallow groundwater level, increasing
the likelihood of liquefaction across major parts of the State Highway network (Cubrinovski 2013).
The assessment of liquefaction susceptibility is the first step to understanding the potential exposure of the
infrastructure network on both a national and regional level. However, high susceptibility does not
necessarily lead to high probability. State Highways which are highly susceptible to liquefaction but not
prone to strong ground shaking may be less important for the hazard evaluation than less susceptible State
Highways with a higher exposure to high intensity motions (Glassey & Heron 2012). Therefore, it is
important to link the susceptibility results with ground shaking intensity in order to estimate liquefaction
probability for each earthquake.

                                                        4
4.2 Liquefaction probability and recurrence
Using the point format of the State Highways network, liquefaction probability is calculated for the ten
ground shaking events leading to ten different liquefaction probability maps. In order to link the events to a
combined hazard map, the number of earthquakes which result in a predicted liquefaction probability of 40 %
or above is calculated in each network point. The percentage is chosen based on the results of a receiver
operating characteristic analysis of liquefaction observation data from the Canterbury earthquake sequence,
suggesting that a threshold of 40 % leads to the best prediction outcome regarding the question of whether
liquefaction manifests or does not manifest. The recurrence value allows evaluation of liquefaction
probability in a broader sense rather than in the context of a single event. Points are merged back to line
features (sections) to represent the link between two State Highway intersections. The liquefaction
recurrence of each section equals the maximum point value along the section. Although the section format
has its limitations as it conceals the critical points along the section and tends to overestimates the recurrence
value of longer sections, this format has been used because it better represents the features of a network
(nodes and links) and because it is more compliant with the One Network Road Classification (ONRC)
discussed in the following section.
Figure 2b shows the recurrence map for the entire State Highway network. Low values can be observed in
the north and in the lower central part of the North Island, as well as in the southern areas of the South
Island. It is expected that these sections are unlikely to experience liquefaction manifestation and potential
damage caused by any of the ten earthquake scenarios due to low susceptibility (Figure 2a) and limited
exposure to high intensity ground motions (Figure 1). Moderate liquefaction recurrence (where around three
of the ten earthquakes result in a liquefaction probability of 40 % or higher) can be found in the upper central
part of the North Island, around Wellington and along one of the State Highways connecting the East and
West coasts of the South Island. All these sections are highly susceptible to liquefaction and relatively close
to faults. High recurrence (up to six out of the ten earthquakes result in a liquefaction probability of 40 % or
higher) occurs mainly in the north and north western region of the South Island. These sections are in very
close vicinity to the causative faults of these events, leading to high probability and recurrence even for
sections with lower susceptibility, such as some inland State Highways on the South Island.
A closer look at Christchurch shows that despite a consistently high susceptibility for all the State Highways,
the link heading to the North seems to be the most exposed section in this area. The reasons for this are both
the length of the section and direct crossings of the Wairau, Awatere and Hope Faults. A similar observation
can be made for Wellington: Most of the network has a low to moderate susceptibility, but considering the
recurrence results, the State Highways in the Upper Hutt are more likely to be affected by liquefaction than
the State Highways closer to the city (Lower Hutt).
The liquefaction susceptibility and liquefaction recurrence map provide valuable information about exposed
State Highways on a national and regional scale. It should be noted that the set of earthquakes chosen for the
assessment is very limited. Events on other faults need to be included to capture the full extent of seismic
hazards and liquefaction potential. Nevertheless, the results show that a combined analysis of susceptibility,
probability and recurrence can provide a suitable framework to assess liquefaction exposure.
5 POTENTIAL IMPACT ON NETWORK PERFORMANCE
In order to better understand liquefaction impact, potential socio-economic consequences as a result of
disrupted network sections have to be included to the assessment. A strong earthquake may cause damage to
various sections of the State Highway, but may not affect a large number of people or businesses and thus,
not have a large socio-economic impact. On the other hand, the outage of a short but important section may
significantly impede the traffic flow.
5Figure 3: (a) One Network Road Classification (ONRC) and (b) liquefaction impact map of New Zealand
State Highways.
This paper uses the One Network Road Classification (ONRC) as a measure for network criticality. The
ONRC is a framework developed by the New Zealand Transport Agency (NZTA) to support the
management of New Zealand’s road network. It is based on indicators such as average daily traffic,
population linked to the network and relevance for tourism. The classification consists of seven categories
ranging from access (small roads which provide access to local facilities and the wider road network) to
national high volume (major roads linking large population centres and transportations hubs) (NZTA 2013).
Figure 3a presents the State Highways network categorised by ONRC, which uses a section format (road
between two intersections) similar to the format introduced earlier in this paper. As State Highways generally
have higher significance compared to local roads, the access category is not represented here. On the North
Island, State Highways connecting the Auckland region and the Wellington region are classified national or
national high volume. These sections are critical to the social and economic wellbeing as they link major
populations (> 100,000) and carry large numbers of heavy commercial vehicles. On the South Island, the
State Highway along the east coast is the most significant, being classified national and national high volume
(Christchurch). It connects most of the hubs including larger cities, airports and seaports. State Highways on
the South Island classified as regional or arterial (connecting the east and west coast, or located along the
west coast) are primarily used for tourism.
To link the ONRC with the outcome of the liquefaction exposure assessment, a numerical value from 1
(secondary collector) to 6 (national high volume) is assigned to each ONRC category. The liquefaction
impact is then calculated by multiplying the liquefaction recurrence (numerical value between 0 and 6
representing the number of earthquakes that result in a liquefaction probability of 40 % or higher) with the
ONRC indicator. A lower number represents lower impact meaning it is unlikely that a large number of
people or businesses will be affected by a State Highway disruption as a result of liquefaction induced
damage. On the other hand, a higher number represents higher impact, e.g. where a State Highway to a major
city or seaport becomes unavailable. Figure 3 illustrates liquefaction impact measured for the entire State
Highway network. On a national scale, the sections with low liquefaction recurrence also lead to low impact
6(northern and lower central area of the North Island, and south eastern area of the South Island). Moderate
impact can be found for the upper central part of North Island and the West Coast of the South Island. While
the results for the State Highways on the North Island are more influenced by higher criticality (regional to
national high volume), the outcome of the network sections on the South Island is instead driven by higher
exposure. The State Highways with the highest impact are located along the northern and north eastern
coasts of the South Island. These sections show both relatively high liquefaction recurrence and network
criticality.
The impact assessment demonstrates that some State Highways with moderate to high liquefaction
recurrence (e.g. in the west central area of the South Island) do not necessarily result in high impact; thus,
may not need to be prioritised during decision making processes regarding infrastructure investment or post-
earthquake reconstruction. However, the lack of alternative routes along the West Coast of the South Island
restricting the accessibility for emergency vehicles, emphasises the need for other factors to be included in
the criticality and impact assessment. Attention should also be paid to State Highways with lower
liquefaction occurrence but high network criticality according to ONRC (e.g. in the upper central part of the
North Island). Although the likelihood of a disruption caused by liquefaction is rather low, the consequences
would affect a large number of people and businesses. These examples show that both exposure and impact
are essential in order to understand the overall liquefaction risk and to make more appropriate decisions for
the State Highway network.
6 DISCUSSION
Applying the geospatial model by Zhu et al. (2017), liquefaction susceptibility and liquefaction probability
of ten earthquake scenarios across New Zealand was calculated. Liquefaction recurrence – the number of
earthquakes that result in a 40 % or higher chance of liquefaction manifestation – was used to combine the
events and quantify the overall exposure. The One Network Road Classification (ONRC) was used as an
indicator for network criticality to assess liquefaction impact. The results showed that both exposure and
impact need to be considered to properly evaluate liquefaction risk across the State Highway network.
Further research needs to include more earthquake scenarios. The ten events discussed in this paper are
appropriate examples to demonstrate the impact of major earthquakes (magnitude 6.7 or higher); however,
all earthquakes that could potentially cause damage to State Highway sections should be assessed. In
addition, more research on network criticality is required. Apart from the One Network Road Classification
(ONRC), which works reasonably well to describe general criticality, other indicators more specific to
transport services, such freight volume and value, or type of commodity, should also be considered to
identify what business sectors (e.g. dairy, coal etc.) could be affected and to what extent (e.g. monetary loss).
Another important aspect is the availability of alternative routes. The lack of redundant routes linking certain
locations increases the criticality of a State Highway section in case of an event. In the same context,
alternative transport modes (rail or coastal shipping) could also be part of future research. Rail often follows
the path of State Highways and coastal shipping is less dependent on soil conditions (assuming harbours are
able to operate). These options improve network redundancy and should be accounted for in a broader
impact assessment.
This paper introduced an approach to estimate liquefaction exposure and impacts across New Zealand State
Highways by combining the output of a geospatial liquefaction model and the ONRC. Increasing the number
of ground shaking events, elaborating on the criticality factors and taking alternative routes and transport
modes into account can help improve the results of this research, which can be used to support decision
making processes regarding infrastructure investment, emergency planning, and prioritisation of post-
earthquake reconstruction projects.
7REFERENCES
Baise, L., & Rashidian, V. 2017. Validation of a geospatial liquefaction model for non-coastal regions
including Nepal. Technical report, USGS Award G16AP00014.
Berryman, K., Cochran, U., Clark, K., Biasi, G., Langridge, R., Villamor, P. 2013. Major earthquakes occur
regularly on an isolated plate boundary fault. Science, 336(6089), 1690-1693.
Boulanger, R., & Idriss, I. 2014. CPT and SPT based liquefaction triggering procedures. Report No.
UCD/CGM.-14, 1, Center for Geotech. Modelling, Civil & Environmental Eng., UC Davis, CA.
Cubrinovski, M. 2013. Liquefaction-induced damage in the 2010-2011 Christchurch (New Zealand)
earthquakes. Proceedings of the 7th International Conference on Case Histories in Geotechnical Engineering.
29 April to 4 May 2013.
Fan, Y., Li, H., & Miguez, Macho, G. (2013). Global patterns of groundwater table depth. Science, 339: 940-
943.
Foster, K., Bradley, B., McGann, C., & Wotherspoon, L. 2019. A VS30 map for New Zealand based on
geologic and terrain proxy variables and field measurements. Earthquake Spectra, 35(4), 1865-1897.
GeoNet n.d. Earthquake Statistics. URL: https://www.geonet.org.nz/earthquake/statistics (retrieved 15
January 2020).
Glassey, P., & Heron, D. 2012. Amplified ground shaking and liquefaction susceptibility, Invercargill City.
GNS Science Consultancy Report 2012/2014.
Maurer, B. 2017. Field-testing liquefaction models based on geospatial vs. geotechnical data. Proceedings of
the 6th International Young Geotechnical Engineers’ Conference (iYGEC6). 16 to 17 September 2017.
Mian, J., Kontoe, S., & Free, M. 2013. Assessing and managing the risk of earthquake-induced liquefaction
to civil infrastructure. Handbook of Seismic Risk Analysis and Management of Civil Infrastructure Systems,
113-138, Woodhead Publishing.
Ministry of Transport 2011. Connecting New Zealand – A summary of government’s policy direction for
transport.
New Zealand Ministry for Culture and Heritage (NZMCH) 2017. Hawke’s Bay earthquake strikes – 3
February 1931. New Zealand History. URL: https://nzhistory.govt.nz/hawkes-bay-earthquake-0 (retrieved 15
January 2020).
New Zealand Transport Agency (NZTA) 2013. Applying the One Network Road Classification – Guidelines.
New Zealand Transport Agency (NZTA) 2018. State highway frequently asked questions. URL:
https://www.nzta.govt.nz/roads-and-rail/research-and-data/state-highway-frequently-asked-questions/#state-
highways (retrieved 8 January 2020).
Rodgers, D., & Little, T. 2006. World's largest coseismic strike‐slip offset: The 1855 rupture of the
Wairarapa Fault, New Zealand, and implications for displacement/length scaling of continental earthquakes,
Journal of Geophysical Research, 111(B12408).
Sutherland, R., Berryman, K., Norris, R. 2006. Quaternary slip rate and geomorphology of the Alpine fault:
Implications for kinematics and seismic hazard in southwest New Zealand. GSA Bulletin, 118(3-4), 464–474.
Stirling, M., McVerry, G., Gerstenberger, M., Litchfield, N., Van Dissen, R., Berryman, K., ... & Lamarche,
G. 2012. National seismic hazard model for New Zealand: 2010 update. Bulletin of the Seismological Society
of America, 102 (4), 1514–1542.
8Wald, D., & Allen, T. 2007. Topographic slope as a proxy for seismic site conditions and amplification.
Bulletin of the Seismological Society of America, 97 (5): 1379–1395.
Zhu, J., Daley, D., Baise, L. G., Thompson, E. M., Wald, D. J., & Knudsen, K. L. 2015. A geospatial
liquefaction model for rapid response and loss estimation. Earthquake Spectra, 31(3), 1813-1837.
Zhu, J., Baise, L. G., & Thompson, E. M. 2017. An updated geospatial liquefaction model for global
application. Bulletin of the Seismological Society of America, 107(3), 1365-1385.
9You can also read