ANALYZING ISLAND PROVINCE POLICY ON POVERTY ALLEVIATION IN MALUKU PROVINCE - MUNICH PERSONAL REPEC ARCHIVE
←
→
Page content transcription
If your browser does not render page correctly, please read the page content below
Munich Personal RePEc Archive

Analyzing Island Province Policy on
Poverty Alleviation in Maluku Province

Satyakti, Yayan and Rum, Irlan Adiatma and Pamungkas,
Eksa and Sihaloho, Estro Dariatno and Rijoly, Jacobus Cliff
Diky

Department of Economics Universitas Padjadjaran (UNPAD)
Bandung, Indonesia, Department of Economics Universitas
Padjadjaran (UNPAD) Bandung, Indonesia, Department of
Economics Universitas Padjadjaran (UNPAD) Bandung, Indonesia,
Department of Economics Universitas Padjadjaran (UNPAD)
Bandung, Indonesia, Department of Economics Universitas
Pattimura Ambon

2017
Online at https://mpra.ub.uni-muenchen.de/100525/
MPRA Paper No. 100525, posted 28 May 2020 17:03 UTC
Analyzing the Island Province Policy on Poverty
             Alleviation in Maluku Province*

                          Yayan Satyakti                                                                Irlan Adiatma Rum
                    Department of Economics                                                         Department of Economics
                 Universitas Padjadjaran (UNPAD)                                                 Universitas Padjadjaran (UNPAD)
                       Bandung, Indonesia                                                               Bandung, Indonesia
                        yayan@unpad.ac.id                                                             irlan.rum@unpad.ac.id

                         Eksa Pamungkas                                                                   Estro Sihaloloho
                    Department of Economics                                                          Department of Economics
                 Universitas Padjadjaran (UNPAD)                                                 Universitas Padjadjaran (UNPAD)
                       Bandung, Indonesia                                                               Bandung, Indonesia
                  eksa.pamungkas@unpad.ac.id                                                        estro.sihaloho@unpad.ac.id

                                                                                                        Jacobus D. Rijoly
                                                                                                    Department of Economics
                                                                                                   Universitas Pattimura Ambon
                                                                                                     valdyrijoly@gmail.com

    Abstract— This paper investigates the effects of island                biodiversity conservation on coastal zone economics which is
province policy based on Law No. 23 Year 2014 on Regional                  affected by poverty traps. This issue is important because
Autonomy particularly in article No. 27. It is stated that the             according to BPS (2017)1, eastern part of Indonesia has vast
island province has additional jurisdiction to manage maritime             natural resources based on maritime resources. Unfortunately,
cadastral zone up to 12 miles from the coastline. To measure its           the regions are remained left behind compared to the central
influence, policies are differentiated with or without additional          and west regions of Indonesia especially in Maluku Province.
marine boundary areas that affect the coastal zone economic                Therefore, this paper is elucidating whether poverty alleviation
development. To estimate the cadastral zone potential, the                 improvement exists if island province policy is applied in
growth of chlorophyll area is calculated as a proxy of in site
                                                                           Maluku Province.
economic potential for regional development.

    Keywords—spatial          enometrics,   chlorophyll   concentration,                         II. LITERATURE REVIEW
village fund transfer.
                                                                           A. Ecosystem Services in Coastal Zone
                         I.     INTRODUCTION                                   Humans benefit from ecosystem of endowment and
    This paper investigates the effects of island province policy          entitlements, as a capital: natural, social, human, financial, and
based on Law No. 23 Year 2014 on Regional Autonomy in                      physical, preferences, means other than ecosystem services.
particular article No. 27 about Island Province definition.                Endowments, entitlements and capitals play a vital role in
Focus point of this paper is developing model of island                    access; while human preferences affect the ecosystem character
economic activities on poverty alleviation in Maluku Province.             in human dominated landscapes [3]. The framework
                                                                           differentiates services between how they are accessed and
    This paper is close to [1] where ecosystem services and its            controlled. The distinction between ecosystem services that are
economic values are affected by household activities. They                 physical entities (i.e. cash provisioning services) and a second
develop causal pathways between conservation actions and                   group includes regulating, cultural, and supporting services.
environmental outcomes. These impacts should be translated                 The framework supports           people to benefit cash from
into changes in ecosystem services through spatial variability             commoditized services, as opposed to direct services.
of impact on carbon storage in Brazil, Costa Rica, Indonesia               Ecosystem services can access payments. When people are
and Thailand. The study was conducted by cost-benefit                      unable to access non-commoditized services, they cannot
analysis that delivered ecosystem services due to deforestation.           obtain direct payment services. Limitation and restriction of
Assessing with different contexts from previous studies is done            these conditions (i.e. control and access of endowment,
which is based on hypothesis that poverty has strong                       entitlements, and capitals) lead to lose access to direct services
relationship with rapid loss biodiversity [2].                             and increase poverty due to losing assets of biodiversity.
   The transmission analysis between Island Province Policy
and poverty alleviation examines the ecosystem services of                           1
                                                                                         https://www.bps.go.id/linkTableDinamis/view/id/1219

                                                                                                                                               1

                                   Electronic copy available at: https://ssrn.com/abstract=3063070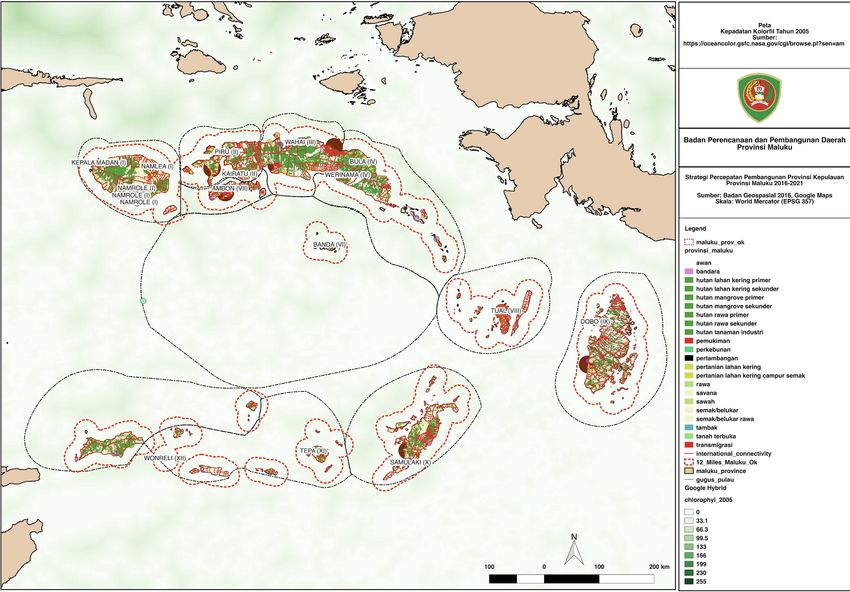
This study focuses on biodiversity loss in coastal zone          coastal areas. Decrease in ocean chlorophyll impacts on the
biodiversity in islands area. Several important issues to be          local economic business sectors; rural economic revenue
addressed in Maluku Province are: a) many fish farmers in             declines due to the loss of chlorophyll ecosystem services.
Maluku Provinces are in subsistence level and small-scale
fisheries cultivation. These fish farming activities are highly
dependent on the aquaculture sector which relies on marine
ecosystem services [4]. According to recent studies [5] coastal       C. Policy Analysis of Poverty Alleviation
areas are the most vulnerable areas in the adverse effects of             As noted earlier, policy analysis is conducted by analyzing
climate change. This impact has negative externalities on poor        Island Province Policy. In article No. 27 Law No. 23 Year
household in Bangladesh. b). [6] reported in Ambon Coastal            2014 which stated that island provinces have additional
Zone, the fish farmers cannot catch fish within 20 miles              authority to manage maritime cadastral zone up to 12 miles
distance from the coastline. It is noted that the fish catchment      beyond coast line. Following policy analysis according to [10],
zone has shifted towards advance zone beyond 20 miles. This           modelling effect of policies is conducted by simple equation
phenomenon suggets [7] that climate change has decreased              that is:
production of organic matter which supports all marine
ecosystems in chlorophyll concentration. [8] It is reported that                         dp/dp ³ 0 where p* < pBAU                      (1)
climate change has reduced net primary production that is                 d is change of policy between poverty of policy affect (p*)
photosynthesis by oceanic phytoplankton. These growth                 smaller than poverty of business as usual (BAU). Increasing in
limiting factors reduce marine ecosystems which restrict              dp/dp less than 0 where improving of island policy will
physical processes of ocean circulation, dynamic mixed-layer,         increase poverty alleviation.
upwelling, atmospheric dust deposition and the solar cycles
within surface layer of marine ecosystem.
                                                                                                        III. DATA
                                                                          Two types of databases are applied in order to measure the
                                                                      policy analysis. The databases consist as follow:
B. Climate Change and Social Vulnerability in Coastal
    Communities                                                                    1.   Spatial database comprises of land use change
                                                                                        database and ocean resource database. Land use
    As discussed earlier, climate change affects coastal zone
                                                                                        data are retrieved with 100.000 scales with
area; especially fish farmers since climate change has impact
                                                                                        projected Mercator World Projection (the data
on ocean productivity and decreases marine ecosystem
                                                                                        were obtained from Indonesia Geospatial
productivity as well as reduces payment ecosystem services
                                                                                        Database). The ocean database was obtained from
(PES) for fish farming. [9] a case in the United States reports
                                                                                        NASA chlorophyll database with 4 band density2.
that coastal communities are increasingly pressured by the
                                                                                        Land use change data were collected from 2005 to
effects of climate change that has a direct impact on the
                                                                                        2014. The database was adjusted into parcel land
availability of fish stock due to changes in ocean temperature
and acidification.                                                                      use unit analysis by 10° x 10° which
                                                                                        disaggregated into 70.020 parcels for each cross
    They developed practical indicators of Community Social                             section with three sets of databases (2005, 2010,
Vulnerability Indicators (CSVIs) i.e. community social                                  and 2014) of island in Maluku Province.
vulnerability indices (e.g. personal disruption index, labor force                      Decomposition of land use is distinguished
structure index, commercial fishing engagement index, poverty                           according to land use classifications which are in
index, housing characteristic index, and commercial fishing                             line with economics sectors such as agriculture,
reliance index); community climate change indices (e.g. sea                             manufacture, residence and commercial;
level risk, sea level rise and business affected, species
vulnerability and catch composition diversity).                                    2.   Non       spatial    database    comprises       of
                                                                                        macroeconomics indicators database as an anchor
    They measured the impacts using Generalized Linear                                  of land use composition trajectory towards 2021.
Model (GAM) to estimate the timing of both linear trends as                             These indicators (e.g. Gross Domestic Product,
well as non-monotonic responses. The chlorophyll (Chl)                                  Private Consumption, Gross Fix Capital
estimation employed through model is as follow:                                         Formation, Government Consumption, Export,
                                                                                        Import, Labor Force, Investment, and Sectoral
   h(µ) = b0 + byear yeari + b1x1,i + f1(x2,i) + f2(x3,i,x4,i) + ei                     Output) were employed within 14 years period
    where i is the individual observation, h is the monotonic                           across 9 municipalities (rural area classification,
link function of the expected mean Chl concentration, µi, yeari,                        “kabupaten”) and 2 regencies (urban area
x1, x2, x3 and x4 are predictors variables, b0 is the model                             classification, “kota”). The data were retrieved
intercept, b denotes parametric and f denotes functional effects                        from Maluku Statistical Agency (Badan Pusat
                                                                                        Statistik Provinsi Maluku).
estimated from the data, and ei represents the residual error
term.
    This indicator impacts on potential business risk in the          2
seafood commerce sector which affects the business revenue in             https://oceancolor.gsfc.nasa.gov/cgi/browse.pl?sen=am

                                                                                                                                         2

                                Electronic copy available at: https://ssrn.com/abstract=3063070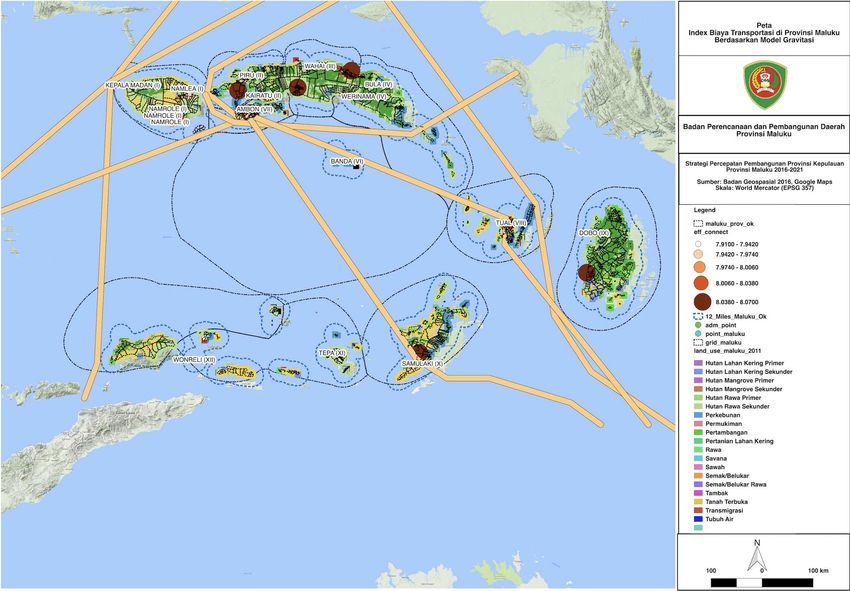
3. 3. In addition to macroeconomic indicators, inter- where tri is land use composition for i parcel, in region r within
island trade activities are estimated through period of t. Whilst l*itr is land use assets which is evaluated
export and import trading activities. The inter- through Payment Ecosystem Services (PES) as conducted by
island trade density is estimated through the [12]. The values of changing l*itr for both land use and ocean
traffic of shipping activities within two years with coastal zone estimated through these following equations,
the frequency of daily activities. This data can be
retrieved from https://www.marinetraffic.com. LUitr = l*itr ´ PESLU (6)
4. The poverty data were obtained spatially from OCUitr = W*itr ´ PESOCU (7)
Village Potential Data (PODES) where village Where LU is terrain land use multiplied by PES with terrain
data level was synchronized into administrative land use values as stated in [12]. OCU is ocean cadastral use
level village database provided by BPS as well. consist of W*itr with respect to chlorophyll estimation given by
The PODES data are essential for aligning
poverty data with spatial database. These W*itr = h(µ) ´ PESOCU (8)
administrative boundaries spatial as well as
PODES data will be attached into parcel data for for both LUitr and OCUitr incorporate into poverty model that
both land use as well as ocean database. escaping of poverty (define in binary probability of poverty) is
a function of natural resource assets and income of households
[2],
IV. MODEL SETUP AND METHODS
P(pitr=(1,0)) = f(Yitr, Aitr) (9)
The analysis is done by incorporating several steps before
evaluating the policy analysis. The pivotal point in the Where P(pitr) is probability of poor in parcel i within period of t
estimation is business-as-usual forecasting for both economic in region r, where r is village level. Yitr is household income in
indicators and spatial expansion. The economic indicators will parcel i, within period t in region r, where assets (Aitr = f(LUitr,
estimate the future of sectorial compositions such as OCUitr)). The policy impact scenarios according to article No.
agriculture, manufacture, services and residence sector. 27 Law No. 23 Year 2014 can be assessed through this
equation,
A. Model Setup
P(pitr)BAU = f(Yitr, Aitr) (10)
The demand function drives the supply function for each
sector across island cluster in Maluku Province. Output P(p*itr)POLICY = f(Y*itr, A*itr) (11)
forecasting in macroeconomics indicators is extrapolated
The policy impact is P(p*itr)POLICY < P(pitr)BAU there is
towards 2021 through panel Vector Auto-regression as an
anchor for estimating demand of land use change. A macro significance of dP(pitr) = P(p*itr)POLICY - P(pitr)BAU where
model is estimated through: dP(p*itr) POLICY / d P(pitr)BAU < 0.
Q*t,r = f(Ct,r,It,r,Gt,r,Tt,r) (2) B. Methods
where Qtr is output in cluster island across Maluku Province, The first step of estimation is forecasting Business as Usual as
Ctr is private consumption, Itr is investment sectors, Gtr is a baseline scenario forecasted from 2017 towards 2021The
government expenditure, and Ttr is intra+inter trade activities equations used for estimation are as follow: In the beginning
between islands and outside of Maluku Province. The Ttr of forecasting, equation 2 is estimated by Panel VAR to
estimated through gravity equation as noted in [11] given by, forecast output (Q*). From this estimation decomposed
Tt,r, = ln X’rXs = Si – Sn - qrs - qd - qb -qe + er (3) sectoral composition inline with historical share and
forecasted along with equation (2);
where X is export of an island cluster to other island clusters as
well as export outside Maluku, Si is island competitiveness as a 1. Equation (3) following [11] by employing forecasting
technology adjusted for its labor cost, proxied by Human of export and import Ttr is re-estimated by gravity
Development Index in each island cluster, and Sn is otherwise. equation as noted by [11];
q represents percentage cost increase for each imposes, the q 2. The output (Q*) also affects factors of production
follow iceberg transportation cost assumption for each trade demand such as land demand, as noted in equation
parameters in rs from island cluster to other cluster. d for the [5]. This equation is estimated through Bayesian
distance, b for sharing border with binary value that 1 share probity analysis to get l*itr;
border, 0 for not sharing border. e is trading special zone for 3. The value of l*itr is converted and multiplied to
island cluster. following the production function connected PESLU whilst OCUitr is measured through equation
between economic and spatial data h(µ) = b0 + byear yeari + b1x1,i + f1(x2,i) + f2(x3,i,x4,i) +
Q*tr = f(Ktr,Ltr,ltr) (4) ei [7] through employing GLM method;
4. Equations (10) and (11) are estimated by Bayesian
Where Q* is output forecasting in each sectoral composition panel probity analysis to estimate P(pitr)BAU that later
across sectors. So land demand to stimulate growth by adopting on simulating similar equation with improving
applying equation (4) into
village fund transfer due to increasing revenue island
l*itr = ¶litr/¶Q*tri = f(Q*tri) (5) province by enacting Law No. 23 Year 2014 that
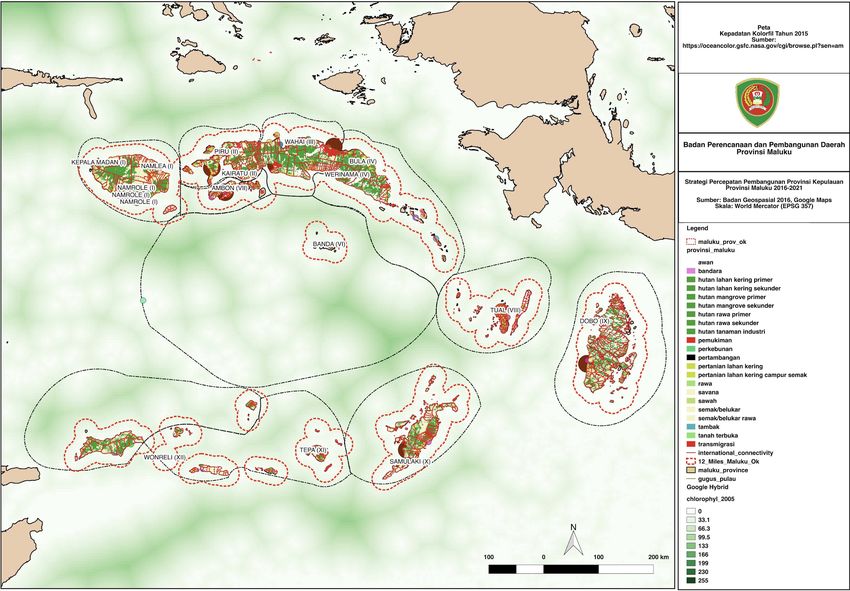
3creates new A*irt and Y*irt. It is assumed that Comparing to previous condition in 2005, it is shown that
revenue from enacting article No. 27 Law No. 23 across areas in Maluku Province
Year 2014.
Fig. 3. Ecosystem Services Productivity surrouding 12 miles due to shift
beyond 12 miles. Chlorophyll in 2005
V. RESULTS
After the estimation process from steps (1) – (5), the
forecasting results shows in estimation map towards land use
map year 2021 as shown in Figure 1.
Fig. 1. Terrain Map Projections in 2021.
Source: Author Calculation, 2017.
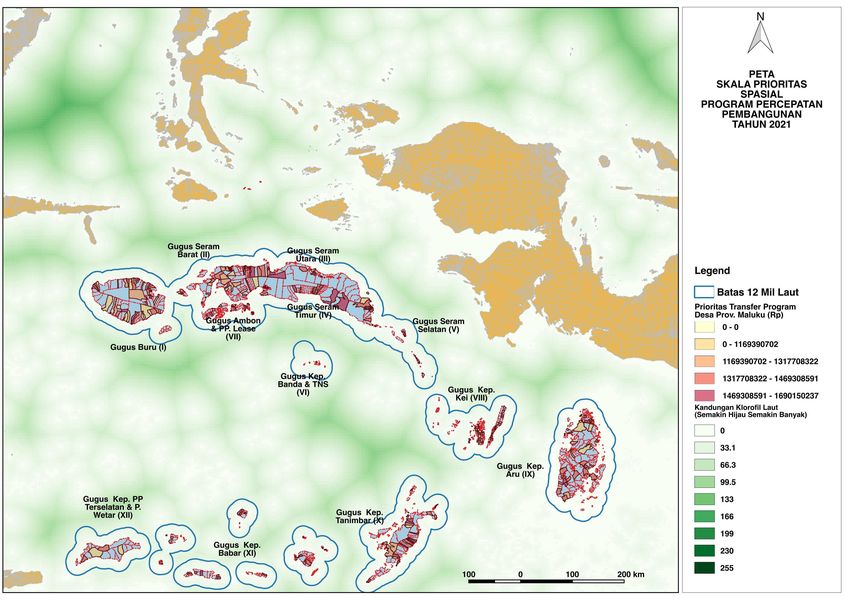
From both Figure 2 and Figure 3, it can be seen that OCUirt
has been shifted and concentrated beyond 12 miles. The
decrease of Ecosystem Services within cadastral zone without
policy estimation (OCUirt calculated only in coastal zone – 1-5
Source: Author Calculation, 2017.
miles) results in lowered Payment Ecosystem Services for
The estimation results are presented in forecasting maps household in coastal zone area. From these database then
rather than econometrics, due to small space in this paper. estimations for equation (6) and (7) are calculated. The results
According to baseline results as shown in Figure 1, Buru Island from these estimates are fed into poverty model as noted in
Cluster and South East Island Cluster will be more advance equation (10) and (11). The estimation shows that the
rather than other island clusters. Improving connectivity probability of escaping poverty without any policy intervention
between islands and decreasing transportation cost in these in Maluku Province is about -3%. This value indicates that the
areas will improve economic activities by labor migration probability of a baseline estimation of poverty reduction is only
between these island-clusters. In ocean cadastral space, the 3% over a four-year period.
chlorophyll has been sifted into advanced, as noted earlier by
[6]. TABLE I. MEAN POVERTY PROBABILITY WITHIN PERIOD 2017 – 2021.
Fig. 2. Decreasing of Ecosystem Services Productivity surrouding 12 miles Escaping of Poverty Baseline Scenario
due to shift beyond 12 miles. Chlorophyll in 2015
Probabillity of Escaping -3% -7% - 9.5%
In order to compare the policy, a simulation is conducted on
regional transfer to incorporate island province policy which
includes the assets of 12 miles cadastral zone in each islands
cluster. The OCUirt for PESirt is done in each parcel of cadastral
zone as economic potential revenue. Another simulation is run
to potential revenue allocated into each village in Maluku
Province. There are four basic fund transfers as priorities to
improve rural development; those are (A recommendation
based on Focus Group Discussion):
1. The total number of poor household is above the
average of poor household in Maluku Province;
2. Economic empowerment in maritime sectors; every
village is expected to at least have maritime local
Source: Author Calculation, 2017.
enterprises. The activities include business
4development, capacity building of local community, especially for maritime sectors and renewable energy in
and market introduction; Maluku Province.
3. Technological appropriateness; every farmers and fish
farmers should be assisted by skill programs to ACKNOWLEDGMENT
promote local technology; An acknowledgement is sent to Maluku Province Planning
4. Increasing availability of energy access through local Agency for financing this research as a part of project Strategic
technology and renewable. Agenda for Development Acceleration Program in Maluku as
an Island Province.
The funding transfer is allocated by 60% of basic fund which
is distributed equally without any condition; and adding 40% REFERENCES
of allocation transfer according econometric estimation in
[1] Ferraro, Paul. J, Merlin M. Hanauer, Daniela A. Miteva, Joanna L.
equations 10 and 11. The result shows that in 2021, the poverty Nelson, Subhrendu K. Pattanayak, Christoph Nolte, Katharine R.E.
alleviation would improve as shows in Table 1. The transfer Simms, “Estimating the Impacts of Conservation on Ecosystem Services
allocation program likely reduces poverty than business as and Poverty by Integrating Modeling and Evaluation”, Proceding of
usual. . National Academy of Science , vol. 112, no.24, pp. 7420-7425, 2015.
[2] Barret, Chirstopher. B, Alexander J. Travis, Partha Dasgupta,”On
Fig. 4. Program Priority in Village in 2021 Biodviersity Conservation and Poverty Traps”,Proceeding National
Academy of Sciences, vol. 108, no. 34, pp.13970-13912, 2011.
[3] Fisher, Janet A., Genevieve Patenaude, Kalpna Giri, Kristina Lewis,
Patrick Meir, Patricia Pinho, Mark D.A. Rounsevell, Mathew Williams,
“Understanding the Relationships between Ecosystem Services and
Poverty Alleviation: A conceptual framework”, vol. 7, pp.34-45,2014.
[4] Kawarazuka, Nozomi., Christope Bene, “Linking Small-Scale Fisheries
and Aquaculture to Household Nutrional Security: An Overview”, Food
Security, vol. 2, pp. 343-357, 2010.
[5] Dasgupta, Susmita., Mainul Huq, Md. Golam Mustafa, Md. Istiak
Sobhan, David Wheeler, “The Impact of Aquatic Salinization on Fish
Habitats and Poor Communities in a Changing Climate: Evidence from
Southwest Coastal Bangladesh”, Ecological Economics, vol. 139, pp.
128-139, 2017.
[6] Khouw, Abraham Semuel, “Potensi Maritim dan Pengelolaan Sumber
Daya Alam di Provinsi Maluku”, Workshop Forum Investasi Percepatan
Pembangunan Provinsi Kepulauan Maluku, 2016.
[7] Boyce, Daniel G., Mmichael Dowd, Marlon R. Lewis, Boris Worm,
“Estimating Global Chlorophyll Changes over the Past Century”,
Progress in Oceanography, vol. 122, pp.163-183, 2014.
[8] Behrenfeld, Michael J., Robert T. O’Malley, David A. Siegel, Charles R.
Source: Author Calculation, 2017. McClain, Jorge L. Sarmiento, Gene C. Feldman, Allen J. Milligan, Paul
G. Falkowski, Ricardo M. Letelier, Emmanuel S. Boss, “Climate-drive
Trends in Contemporary Ocean Productivity”, Nature, vol. 444, pp. 752-
VI. CONCLUSION 755, 2006.
It is concluded that direct policy on local community [9] Colburn, Lisa L., Michael Jepson, Changhua Weng, Tarsila Seara,
Jeremy Weiss, Jonathan A. Hare, “Indicators of Climate Change and
empowerment will decrease poverty in rural area. In Maluku Social Vulnerability in Fishing Dependent Communities along the
Province, direct policy of government transfer on local Eastern and Gulf Coast of the United States”, Marine Policy, vol. 74, pp.
economic empowerment is crucial to improve poverty 323-333.
alleviation. Climate change decreases economic potential [10] Shahidur, Khandker R., Gayatri B. Koolwal, Hussain A. Samad,
revenue from cadastral zone policy. Although in article 27 Law “Handbook on Impact Evaluation: Quantitative Methods and Practices”,
No. 23 Year 2014, it is stated that island province has The World Bank, 2010.
additional potential revenue to manage their cadastral zone; [11] Eaton, Jonathan., Samuel Kortum., “Technology Geography and Trade”,
Econometrica, vol. 70, no. 5, pp. 1741-1779, 2002.
climate change has shifted ecosystem service beyond 12 miles.
[12] Li, Guangdong., Chuanglin Fang., “Global Mapping and Estimation of
Therefore, the policy would be less benefit than 10 years ago.
Ecosystem Services Values and Gross Domestic Product: A Spatially
Direct transfer policy should accommodate people need Explicit Integration of National Green GDP Accounting”, Ecological
Indicators, vol. 46, pp. 293-314, 2014.
5You can also read