Post-Fire Flood Risk in Northern Nevada - Nevada Division of Water Resources September 2018 - Nevada Floods
←
→
Page content transcription
If your browser does not render page correctly, please read the page content below
Post-Fire Flood Risk in
  Northern Nevada

     Hardscrabble Creek Watershed, Photo Credit: USGS Nevada

       Nevada Division of Water Resources

                     September 2018

                                                               0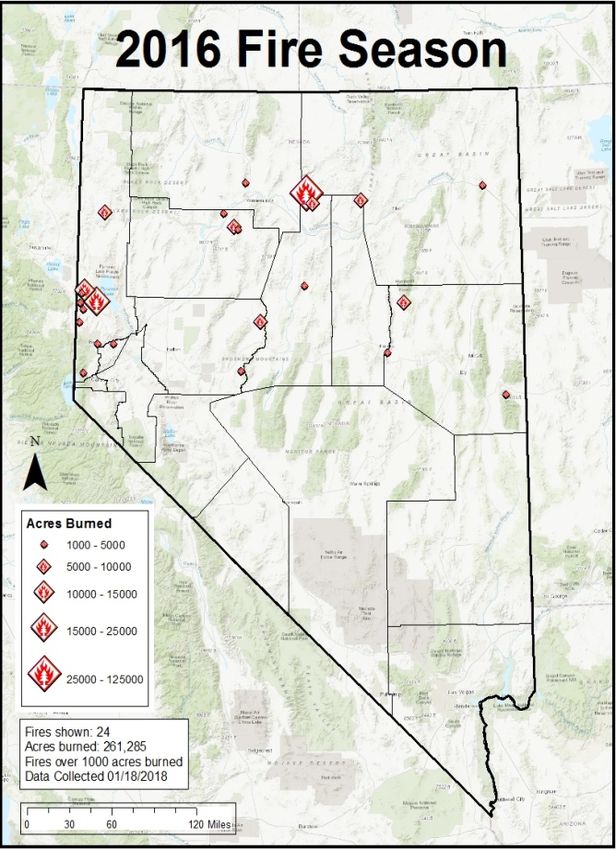
This page intentionally blank.

                                 1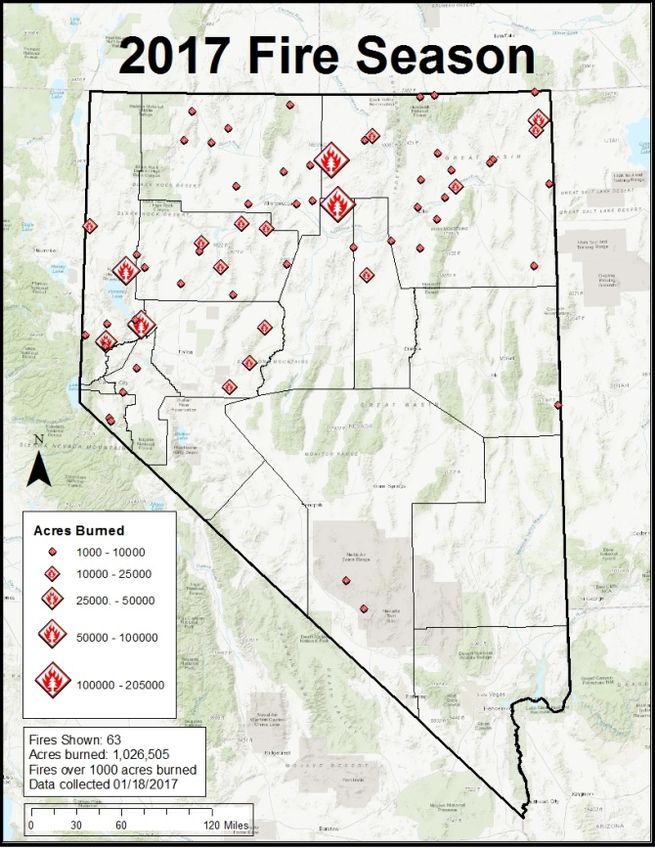
Table of Contents

Introduction…………………………………………………………………………………….…1

Fire Descriptions and Maps

       Reno…….………………………………………………………………………………....7

       Fernley…………….………………………………………………………………..……..9

       Pyramid Lake……….……………………………………………………………………11

       Washoe Valley…………………………………………………………………………...13

       Minden/Gardnerville/Topaz..…………………………………………………………….15

       Churchill County…………………………………………………………………………17

       Lovelock…………………………………………………………………………………19

       Winnemucca……………………………………………………………………………..21

       Battle Mountain………………………………………………………………………….23

       Elko………………………………………………………………………………………25

Conclusions………………………………………………………………………………………27

References………………………………………………………………………………………..29

Resources………………...………………………………………………………………………30

                                                           2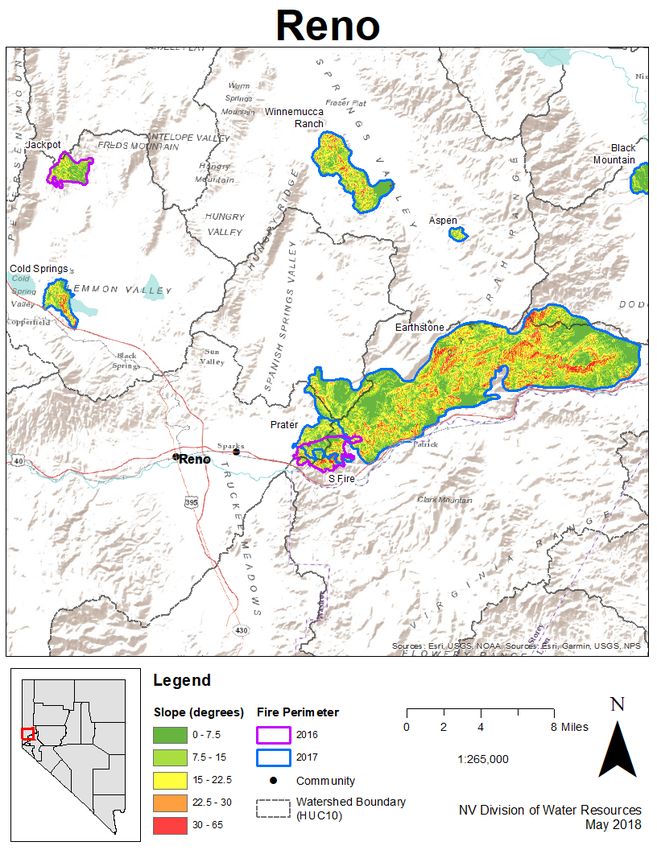
Introduction

    In the western United States, where the terrain is often defined by steep slopes along large

and numerous mountain ranges, wildfires threaten and damage communities every year. Not only

is fire itself a natural disaster, but the changes in the landscape caused by the fire increase the

risk of flooding during a post-fire precipitation event. Recent post-fire floods that resulted in loss

of life and property include floods that occurred after the Schultz Fire in Arizona (2010) and

Thomas Fire in California (2018). Understanding why these post-fire floods occur and gaining

awareness of at-risk areas in Nevada will help residents be prepared before disaster strikes. This

document describes why post-fire flooding occurs, and maps burn perimeters for fires that

occurred in Nevada during the 2016 and 2017 fire seasons.

   In 2016, 24 fires in Nevada each burned more than 1,000 acres during fire season, which runs

from May through October (Figure 1a). Over 265,000 acres burned throughout the state. Much

of the western United States was still in a multi-year drought in 2016. Conditions across much of

western Nevada were classified as severe (Figure 2).

   During the winter of 2016/2017, multiple large winter storm events improved drought

conditions in Nevada. Record precipitation led to runoff that filled reservoirs, caused widespread

flooding, and sustained elevated water levels in major waterways for extended periods of time.

Wet conditions led to a large grass fuel load in northern and central Nevada. When dry, these

grasses become easily ignitable fine fuels. Compared to 2016, 2017 was characterized by an

increase in the number of fires greater than 1000 acres from 24 to 63 (Figure 1b). Acres burned

totaled approximately 1.3 million.

                                                                                                      1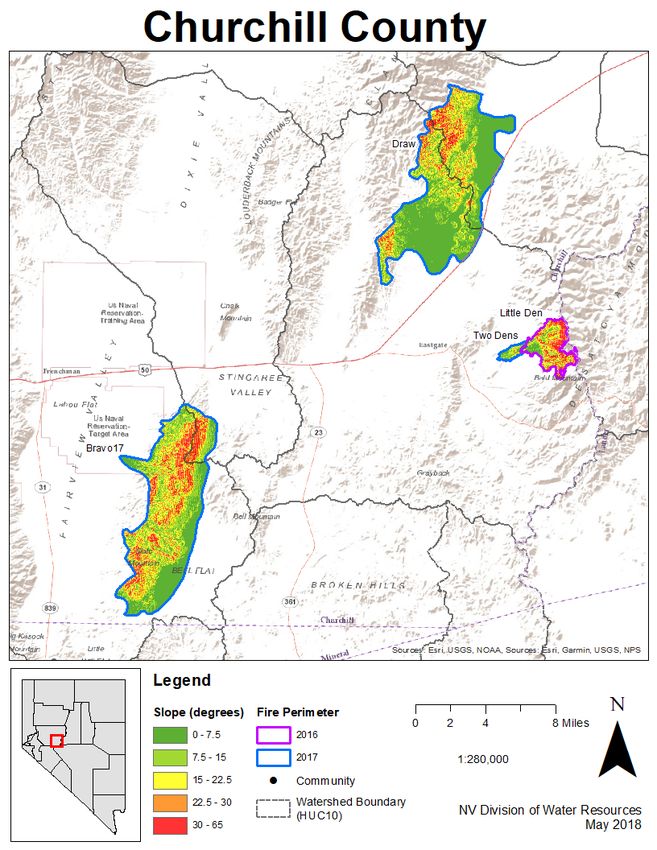
(a)                                                                            (b)

Figure 1. a) Distribution of 2016 fire season wildfires greater than 1000 acres in Nevada. b) Distribution 2017 fire season wildfires greater than
1000 acres in Nevada.

                                                                                                                                                     2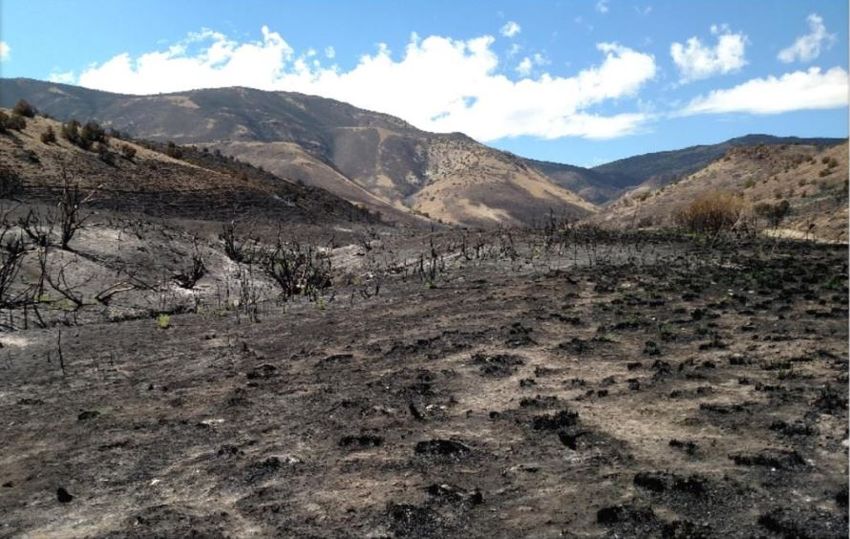
Figure 2. Drought status across Nevada in 2016 according to the US Drought Monitor.

   While wildfire is a major concern across Nevada, post-fire hazards also pose a risk to

communities due to the changed conditions of the burned areas. On a typical landscape, rainfall

is captured and retained by the soil. Vegetation slows runoff and holds soil in place. Fire

removes vegetative cover, roots, and litter. Additionally, a water-repellent layer of soil may form

below the surface during high-intensity burns, reducing water infiltration and retention (NWS,

n.d.; Figure 3). These changes lead to increased runoff and erosion.

                                                                                                  3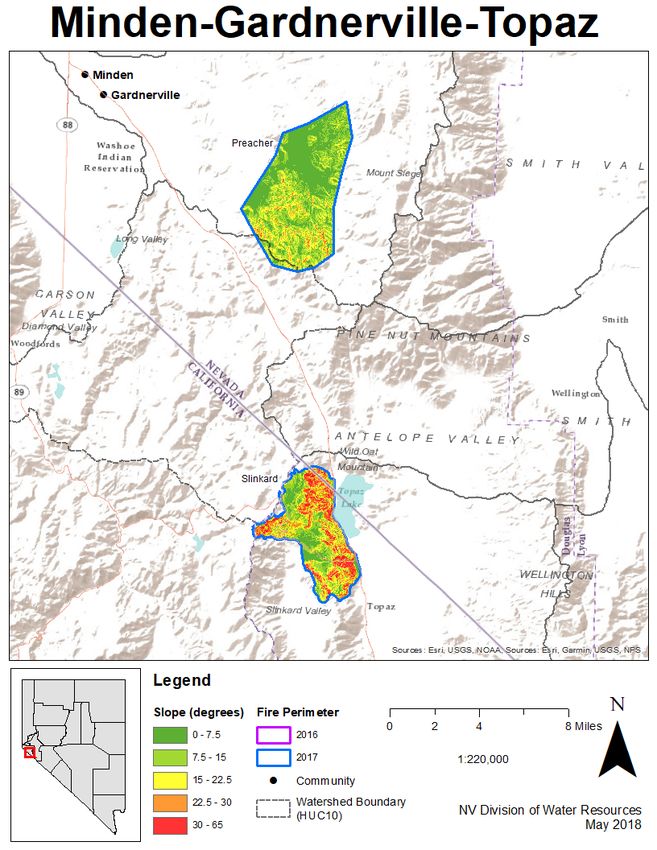
Figure 3. Fire affects soil/water relationships. Water repellent layers may form under high intensity
burns, leading to increased runoff. Saturated conditions near the soil surface can cause mud and debris
flows. Credit: National Weather Service

    Due to the increase in runoff, developed areas down-slope of a burn scar are at an increased

risk for flash flooding (Figure 4). After a fire, areas not historically prone to flooding may

become at-risk areas for several years. It is important to note that flooding is not confined to the

mapped FEMA flood zone boundaries used for flood insurance purposes, especially because

fires change landscape characteristics that define flow and infiltration patterns. Flooding after the

Schultz Fire in Arizona affected subdivisions 10 miles away from the burn scar, in areas that had

not previously experienced flooding (Klassen, 2011). Burned, barren mountainous areas are

especially prone to flash-flooding since water flows quickly down steep slopes and water levels

rise quickly in channels with limited adjacent floodplains. Water and debris moving quickly off

                                                                                                          4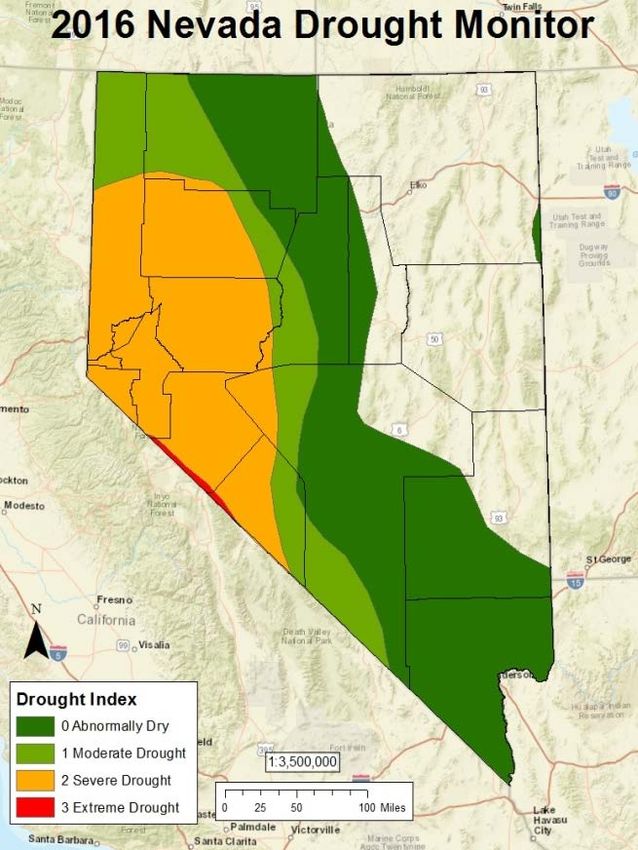
of the landscape creates concern for not only flash flooding, but also debris flows or mud flows.

These flows consist of a mix of moving water and loose debris and sediment. Typically, debris

flows occur on hillsides with slopes of 15 degrees (27%) or greater (Loverich et al., 2017). Flash

flooding can occur when at least half an inch of rain occurs in less than an hour (NWS, n.d.),

depending on factors including slope and burn severity.

Figure 4. Post-fire, flood risk below a burned area may increase during rain events due to the limited
absorption abilities of the soil. Steep landscape slope and high rainfall intensity also increase the risk.
Credit: FEMA

    Flooding potential is greatest during the first two years after the fire has occurred (USGS,

2018a; NWS, n.d.). Recovery of the landscape depends on the intensity of the fire, ground cover,

                                                                                                              5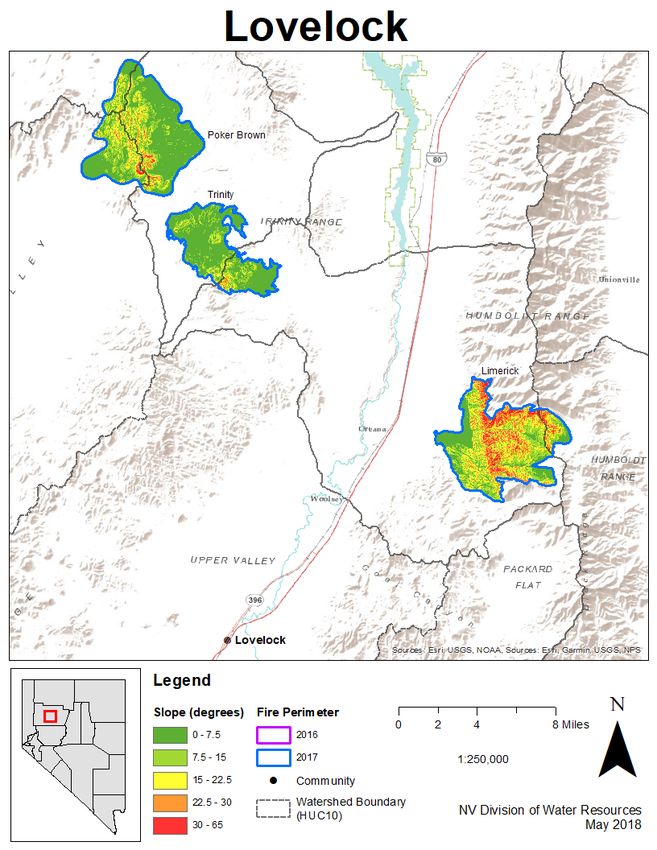
land use, and weather following the fire event (Pierson et al., 2015). In general, the longer a fire

burns, the more intense the burn scar and the longer it takes for the land to recover.

       This report focuses on large wildfires that occurred during the 2016 and 2017 fire seasons

near communities and/or major highways. Fire perimeters were downloaded based on

availability on geomac.gov. Within each burn scar greater than 300 acres, slope was calculated

using a 30 m digital elevation model. HUC 10 watershed boundaries were also included in the

maps to help indicated the direction of runoff from precipitation events.

       Examining the location, extent, and topography of burn areas with relation to Nevada’s

communities and infrastructure can help us anticipate where damage may occur during a

precipitation event over a recently burned area. The maps on the following pages can be used to

help make informed decisions concerning flood safety and preparedness before storm events in

upcoming years. Note that the variables included in this document were limited, and that

additional factors such as burn severity, change in vegetative cover, or soil characteristics should

be considered when assessing the level of flood risk. In the Great Basin, rainfall intensity and

bare ground are key factors for predicting runoff and erosion responses (Pierson et al., 2015).

                                                                                                       6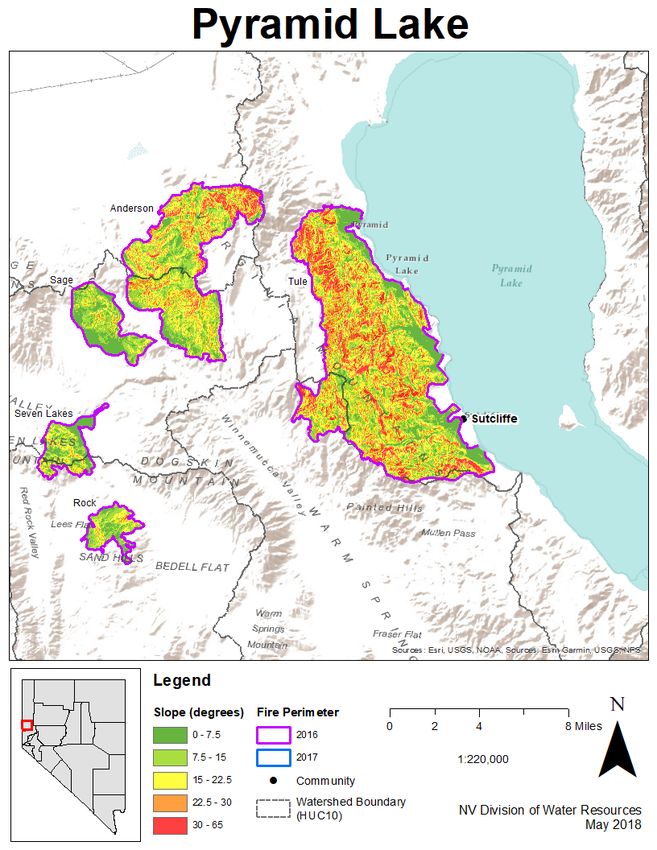
Greater Reno Area

       The Reno/Sparks area has seen a number of large fires within the last two years. 2016

had only one fire over 1,500 acres, the S Fire, and much of the same area burned again in 2017 in

the Prater Fire. Both fires burned right above the east side of Sparks, putting the community

below at risk of flooding. Earthstone was a much larger fire that burned between Sparks and

Fernley in 2017 alongside I-80. Runoff will flow down the hillside toward the interstate and

Truckee River.

       In 2017, along Highway 395 north of Reno, the Cold Springs Fire burned the hills that

separate the communities of Red Rock and Cold Springs. Runoff and debris will move toward

Whites Lake, Silver Lake, and the highway. Located north of Sparks, the Winnemucca Ranch

was a larger fire in a less densely populated area. Its western extent bordered Highway 445,

which connects travelers from Sparks to Pyramid Lake.

             Fire Name          Date Started       Date Contained        Acres Burned

                 S Fire           7/06/2016           7/07/2016              2,540

                 Jackpot           8/6/2016            8/8/2016               1700

             Earthstone           7/03/2017           7/09/2017              41,545

         Winnemucca Ranch         7/04/2017           7/09/2017              4,799

            Cold Springs          7/14/2017           7/15/2017              1,523

                 Prater           8/06/2017           8/07/2017              2,816

                 Aspen            7/08/2017           7/14/2017               315

       Table 1. Dates and sizes of 2016 and 2017 wildfires in the Reno/Sparks area.

                                                                                                7
8
Fernley Area

       Three large fires burned near Fernley in 2017. West of the town, the Earthstone Fire

burned from Sparks nearly 18 miles toward Fernley. Its southeastern extent closely paralleled the

path of the Truckee River, which is also parallel to I-80, the major connection between the two

cities. Runoff, sediment, and debris from this fire will flow directly toward the lower Truckee

River, upstream of the community of Wadsworth.

       Northeast of Fernley and Wadsworth, the Truckee and Hollywood Fires together burned

over 100,000 acres. The smaller Black Mountain fire also burned along the lower Truckee River.

Storm runoff from these burn scars would flow toward the Truckee River to the west, and I-80 to

the southeast. Water and debris may accumulate in the flood-prone flats below the burned area.

Runoff, debris flows, or mud flows may encroach onto the highway.

Table 2. Dates and sizes of 2016 and 2017 wildfires in the Fernley area.

             Fire Name          Date Started       Date Contained       Acres Burned

             Earthstone           7/03/2017           7/09/2017             41,545

             Hollywood            6/19/2017           6/21/2017             5,298

               Truckee            7/03/2017           7/09/2017             98,960

          Black Mountain          7/26/2017           7/27/2017              961

                                                                                                  9
10
Pyramid Lake Area

       The area west of Pyramid Lake had a cluster of lightning-started fires, known as the

Virginia Mountains Complex, in 2016. The Sage and Anderson fires burned watersheds that

drain away from the lake. Closest to the lake, the Tule Fire burned 36,000 acres parallel to NV-

445 along Pyramid Lake. The community of Sutcliffe is located below the burned area, creating

flash flood and debris flow concerns for residents. In fact, the US Geological Survey installed

gages in the Hardscrabble Creek drainage to allow for early detection of flash flooding (USGS,

2018b). During the January 2017 floods, multiple parts of NV-446 washed out, closing the road

between Sutcliffe and Nixon for over a month.

Table 3. Dates and sizes of 2016 and 2017 wildfires in the Pyramid Lake area.

             Fire Name          Date Started       Date Contained       Acres Burned

                Sage              7/28/2016           7/31/2016             4,239

              Anderson            7/29/2016            8/5/2016             16,283

                Tule              7/28/2016            8/5/2016             36,142

            Seven Lakes           7/28/2016           7/31/2016             3,063

                Rock              7/28/2016           7/31/2016             2,293

                                                                                                  11
12
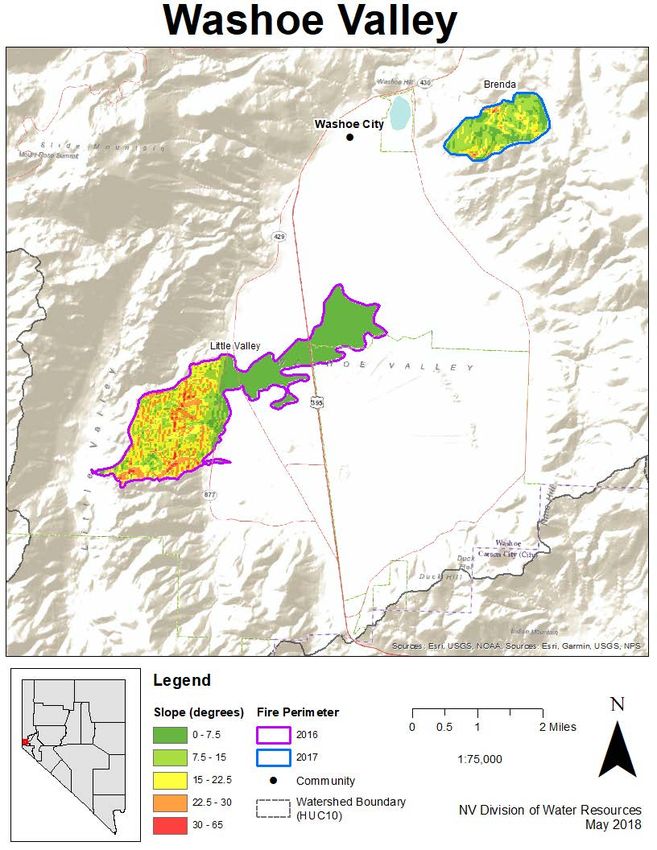
Washoe Valley Area

       The Little Valley Fire grew from a prescribed fire, destroying 23 homes and 17

outbuildings (Corona, 2016). The fire was put out with the help of a storm which was intense

enough for the National Weather Service to issue a flash flood warning. Crews are in the process

of replanting trees and grasses within the burn scar to help accelerate landscape recovery

(Margiott, 2018). Runoff from the slopes will drain toward Washoe Lake.

Table 4. Dates and sizes of 2016 and 2017 wildfires in the Washoe Valley area.

             Fire Name          Date Started       Date Contained       Acres Burned

            Little Valley        10/14/2016          10/19/2016             2,293

               Brenda             7/14/2017           7/14/2017              632

                                                                                               13
14
Minden/Gardnerville/Topaz

       Two fires burned in Douglas County in 2017. The Preacher Fire burn scar is relatively

low-slope but increased runoff may still affect rural properties. Most of the acreage burned in the

Slinkard Fire was located in California, but the burn area covers steep land that drains into

Nevada and has potential to impact Highway 395. In fact, on May 21, 2018, a brief event of

heavy rainfall over the Slinkard fire scar triggered mud flows near the Topaz Lodge at Lake

Topaz, blocking the highway.

Table 5. Dates and sizes of 2016 and 2017 wildfires in Douglas County area.

         Fire Name          Date Started       Date Contained       Acres Burned

          Preacher            7/24/2017           7/30/2017              5,333

          Slinkard            8/29/2017           9/09/2017              8,925

                                                                                                 15
16
Churchill County

       Fires in 2016 and 2017 affected remote areas of Churchill County near Highway 50. The

Draw Fire burned closest to Highway 50, but gentle slopes near the road will minimize the risk

of mud or debris flows crossing the highway. Increased runoff and flooding are still possible at

and downslope of the burn scars.

Table 6. Dates and sizes of 2016 and 2017 wildfires in Churchill County.
             Fire Name         Date Started      Date Contained       Acres Burned

             Little Den            7/20/2016          7/24/2017             3,512

                Draw               7/07/2017          7/15/2017             27,506

              Bravo 17             7/12/2017          7/27/2017             23,387

             Two Dens              8/22/2017          8/25/2017              574

                                                                                                   17
18
Lovelock Area

        Three 2017 fires burned north of Lovelock. None of the burn scars are immediately

adjacent to I-80 or the Humboldt River (including Rye Patch Reservoir), but increased amounts

of runoff may reach the Humboldt River, especially from the steeper slopes of the Limerick burn

scar.

Table 7. Dates and sizes of 2016 and 2017 wildfires near Lovelock.
             Fire Name         Date Started      Date Contained      Acres Burned

            Poker Brown          6/19/2017          6/21/2017            15,540

               Trinity           6/20/2017          6/22/2017             8,895

              Limerick            7/3/2017          7/11/2017            14,592

                                                                                             19
20
Winnemucca Area

       The Winnemucca area had several large fires in 2016 and 2017. The Rock Hill and

Monroe fires burned adjacent to each other in an undeveloped area. In 2017, the Grass Valley

and MM 155 Fires occurred south of town in areas with minimal development. MM 155

overlapped with the edges of the 2016 fires. Runoff from several of these burn scars will flow

toward I-80 and the adjacent Humboldt River, but the steep portions of the burn scars are

approximately 10 or more miles away in sparsely populated areas. The Barrett Springs Fire

occurred in a relatively flat area west of Winnemucca, where increases in runoff could impact the

river downstream of the city.

Table 8. Dates and sizes of 2016 and 2017 wildfires in the Winnemucca area.

             Fire Name          Date Started      Date Contained       Acres Burned

              Monroe             8/16/2016           8/19/2016             11,220

             Rock Hill           8/20/2016           8/24/2016              1,738

           Barrett Springs       7/08/2017           7/10/2017              3,319

              MM 155             7/14/2017           7/23/2017             22,360

            Grass Valley         7/17/2017           7/22/2017             11,590

                Dune             8/08/2017           8/09/2017              9,873

                                                                                                 21
Dates and sizes of 2016 and 2017 wildfires in the Battle Mountain area.
22Battle Mountain Area
The Battle Mountain area has had very large fire events in each of the last two years. In
2016, the Hot Pot Fire burned over 120,000 acres, and then in 2017 the Roosters Comb Fire
burned over 200,000 acres. The Roosters Comb Fire overlapped with the smaller perimeter of the
2016 Izzenhood Fire. The distance of these fires from the town reduces the risk of property
damage or injury due to flash flooding or mudslides.
Table 9. Dates and sizes of 2016 and 2017 wildfires in the Battle Mountain area.
Fire Name Date Started Date Contained Acres Burned
Hot Pot 7/02/2016 7/08/2016 122,390
Izzenhood 8/18/2016 8/21/2016 6,543
Midas 6/21/2017 6/22/2017 327
Roosters Comb 7/09/2017 7/25/2017 204,879
2324
Elko Area

       The 2017 Oil Well Fire east of Elko burned 7,500 acres, destroying 14 homes and

multiple vehicles (Harris, 2017). This fire crossed I-80 and its eastern extent burned alongside

the Humboldt River. The burn scar is relatively flat. Similarly, the three fires that burned further

east occurred on low-slope terrain. Increased runoff from the burn scars may impact flows in the

Humboldt River through Elko.

Table 10. Dates and sizes of 2016 and 2017 wildfires in the Elko area.

             Fire Name           Date Started       Date Contained        Acres Burned

             River Ranch           7/8/2017            7/09/2017              1,380

             Tabor Flats           7/8/2017            7/15/2017              25,100

               Oil Well            7/17/2017           7/20/2017              7,500

             Pole Creek            7/30/2017           8/02/2017              6,540

                                                                                                   25
26
Conclusions

       Despite being an arid state, Nevada is prone to flooding. Flooding is caused by several

different factors including fire. A few trends can be noted from the burn scar slope maps in this

document:

   •   Reno, Fernley, Pyramid Lake, and Topaz-area burn scars cover steep slopes adjacent to

       both major highways and waterways/waterbodies. I-80 parallels portions of the Truckee

       and Humboldt Rivers. Highway 395 at Topaz is adjacent to Topaz Lake. Floods, debris

       flows, or mudslides could cause major safety and accessibility issues on roadways.

       Additionally, water quality could temporarily decline due to the influx of sediment and

       debris (USGS, 2018c).

   •   Fires in the Battle Mountain and Elko areas encompassed large areas with low slopes.

       The flatter areas present a smaller flash-flooding risk. However, the lack of ground cover

       and hydrophobic soils still contribute to increased runoff.

   •   Runoff from several burn scars will drain into the Truckee or Humboldt Rivers within

       several miles upstream of major communities. As a result, flows through these

       downstream towns may quickly increase in response to precipitation events over those

       burn scars.

       The impacts of natural disasters, including wildfires and floods, can be difficult to

predict. The data provided in this document offer only a basic analysis of areas at risk of post-fire

flooding. Other environmental factors must be included in a more rigorous analysis of flood or

debris flow hazard. For some large fires, USGS conducts more rigorous hazard assessments,
                                                                                                  27
which can be found at https://landslides.usgs.gov/hazards/postfire_debrisflow/. Regardless of the
information available on a burn scar, readers should be aware that flood risk increases with steep
slopes, decreased vegetative cover, and increased rain intensity.
Post-fire flash flooding is a serious risk to all communities that have been affected by
fires. The National Weather Service (n.d.) advises that if you can look upslope and see a burned
area, you are at risk. As communities continue to grow, development will expand the wildfire-
urban interface. With the resulting increased exposure to natural hazards, it is important to
continue examining maps and historic data so that we are able to better gage the risk of flooding
and prepare properly in order to protect human life and property as much as possible. Steps to
prepare for possible post-fire flooding include the following:
• Gather emergency supplies.
• Purchase flood insurance. The Standard Flood Insurance Policy includes coverage
for mudflows. Mudflows are defined as a river of liquid and flowing mud on the
surfaces of normally dry land areas, as when earth is carried by a current of water.
• Plan evacuation routes; stay informed before and during any potential events; and
be ready to evacuate if heavy rain occurs.
o Know how to access National Weather Service outlooks, watches, and
warnings.
• Keep important papers in a safe, waterproof place and conduct a home inventory.
Additional resources to use before, during, or after wildfire are listed at the end of this document.
28References
Corona, Marcella. Prescribed burn blamed fror Liittle Valley Fire. October 26, 2016.
http://www.rgj.com/story/news/2016/10/26/little-valley-fire-sparked-prescribed-burn/92799826/
(accessed January 11, 2018).
Harris, Jeremy. KUTV. July 17, 2017. http://kutv.com/news/local/14-homes-lost-to-oil-well-fire-
near-elko-i-80-opened (accessed January 11, 2018).
Klassen, Keith. The Schultz Fire & Subsequent Flooding. 2011.
http://www.firerescuemagazine.com/articles/print/volume-6/issue-1/features-0/the-schultz-fire-
subsequent-flooding.html (accessed April 2, 2018).
Loverich, Joseph B., Ann M. Youberg, Michael J., Kellogg, and Jon E. Fuller. Post-Wildfire
Debris-Flow & Flooding Assessment: Coconino County, Arizona. 2017. 63 pages.
Margiott, Ben. NDF crews start planting trees & grasses on Little Valley Fire burn scar .
January 5, 2018. http://mynews4.com/news/local/ndf-crews-start-planting-trees-grasses-on-little-
valley-fire-burn-scar (accessed January 10, 218).
National Weather Service (NWS). Flash Flood Threat Within Fire Burn Scar. n.d.
https://www.weather.gov/riw/burn_scar_flooding (accessed October 20, 2017).
Pierson, Frederick B., C. Jason Williams, and Peter R. Robichaud. "Assessing Impacts of Fire
and Post-fire Mitigation on Runoff and Erosion from Rangelands." Great Basin Factsheet Series,
2015: 1-6.
U.S. Geological Survey (USGS). Post-Fire Flooding and Debris Flow. 2018a.
https://ca.water.usgs.gov/wildfires/wildfires-debris-flow.html (accessed April 3, 2018).
U.S. Geological Survey (USGS). USGS 10351950 HARDSCRABBLE CK BLW TH RANCH
AT SUTCLIFFE, NV. 2018b. https://waterdata.usgs.gov/nv/nwis/uv?site_no=10351950
(accessed May 1, 2018).
U.S. Geological Survey (USGS). Water Quality after a Wildfire. 2018c.
https://ca.water.usgs.gov/wildfires/wildfires-water-quality.html (accessed April 2, 2018).
29RESOUCRES
Expectations After Fire
FEMA Flood After Fire Risk Fact Sheet: http://www.floods.org/ace-
images/FloodAfterFire_FactSheet.pdf
https://www.env.nm.gov/documents/What_to_Expect_Following_Storm_Events.pdf
National Weather Service Burn Scar Information
https://www.weather.gov/riw/burn_scar_flooding
Colorado Post-Wildfire Mudslide Brochure: http://coloradogeologicalsurvey.org/geologic-
hazards/fires/
New Mexico After Wildfire Flood Information: http://afterwildfirenm.org/flood-information
Additional Flooding Information
Flooding in Nevada: http://nevadafloods.org/
General Flooding Information: http://www.floodtools.com
National Flood Insurance Program: https://www.floodsmart.gov/
FEMA Mapping: https://msc.fema.gov
For more information contact:
Nicole Goehring
Floodplain Mapping Coordinator, Nevada Division of Water Resources
ngoehring@water.nv.gov
Parks, and Carol Miller. "Weather, fuelsm and topography impede wildalnd fire spread in western US
landscapes ." Forest Ecology and Management , 2016: 59-69.
Mapping,and Planning Partners.
30You can also read