South Island Monthly Fire Danger Outlook (2020/21 Season) - Rural Fire Research
←
→
Page content transcription
If your browser does not render page correctly, please read the page content below
South Island Monthly Fire Danger Outlook (2020/21 Season)
ISSUE: March 2021
Current fire danger situation                                                 Locations to watch
Many locations are at or near the peak of fire season activity (typically     In general, fire danger and fire climate severity typically peak in
Feb/March). In general, February monthly fire dangers and fire climate        February/March and decline over March/April. This decline is expected
severity were High to Extreme for eastern locations (parts of Nelson/         to occur as we progress into autumn. However, the risk of further fire
Tasman, Marlborough, Canterbury and Otago) (Figures 4, 5 & 9). In             outbreaks remains high for some locations.
contrast, much of the West Coast and Southland regions remain Low to
Moderate.                                                                     Based on the forecast for warm and drier conditions to continue in
                                                                              March for northern and eastern locations, plus the current soil moisture
                                                                              status and elevated FWI codes and indices, areas to keep an eye one
Fuel and soil moisture status                                                 for High to Extreme fire dangers are: Marlborough, Canterbury and
This is reflected in the current FWI System codes and indices (FFMC,          Otago (Map 1). However, this may change with any major rain events
DMC, DC, and BUI) in Figures 5 and 7. These codes indicate the ease           that will improve soil and fuel moistures and consequently reduce the
of ignition, the amount of fuel available for combustion, and how deep-       potential for wildfire outbreaks.
seated and prolonged mop-up could be. Marlborough, Canterbury, Mid-
South Canterbury and Otago stations are generally recording BUI and
DC values above or on trend with the historical average for this time of
the year. In contrast, Nelson/Tasman is recording values generally well
below or on trend for this time of the year. Other locations (Southland
and West Coast) have values either above or below the historical
average for this time of the year, which likely depends on climatic zones.
Graphs tracking daily trends for individual station are available on the
Scion website: www.ruralfireresearch.co.nz/tools/trends

Nearly all of the east coast is currently in soil moisture deficits (Figure
2), which is about normal for this time of the year. Dry-to-very dry soils
are located across the north and eastern South Island (Marlborough,
Nelson/Tasman, parts of mid & north Canterbury and Central Otago.
In contrast Fiordland and Westland are currently wetter than normal
(Figure 3).

Forecast climate and weather
Non-traditional La Niña conditions remain in the tropical Pacific and
international models indicate it has reached its peak strength and has
been weakening the past few weeks. Despite this weakening pattern,
this La Niña event is still expected to influence our climate over the next
three months.

Over the next three months (March – May 2021), weather patterns are
expected to become more variable as the effects of the 2020/21 La Niña
event eases and we progress into autumn. Low-pressure systems are
forecast to become more common during autumn.

March marks the start of meteorological autumn for New Zealand, and
the likelihood of extreme heat has passed. In general, the weather
generally remains settled but leans towards cooler days for March and
into autumn. March is forecast to be another month of two halves. The
first half is forecast to experience more south-westerly winds and run a
little cooler than last month, with occasional cool snaps also expected.
An increase in cyclone activity may impact New Zealand in the first
half of the month. This could result in heavy rainfall and flooding for
impacted regions (more likely for the North Island). The second half
of the month will feel more summer like with a return of high pressure,
westerly winds and settled weather. Overall, the month will lean towards      Map 1. Locations identified as specific areas of interest that have or
warmer than average, with eastern and northern locations leaning drier
                                                                              may develop an elevated risk of High to Extreme fire danger over
than average.
                                                                              the next three months.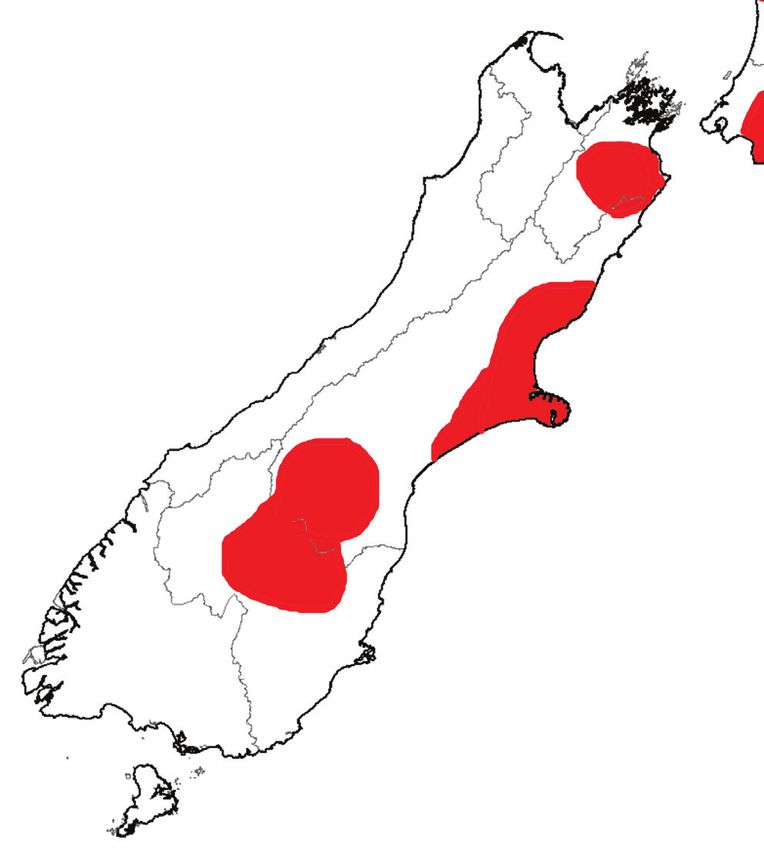
Background
The purpose of these monthly outlooks is to provide a heads up on current and potential fire danger as we transition from spring to summer
and, later, into autumn. This is not a detailed fire seasonal outlook for specific localities, nor does it summarise fire potential (which depends
on fuel conditions (i.e. grass curing), risks of ignitions, recent fire history and fire management resources available in an area, as well as
weather and climate).
It aims to forewarn fire agencies of current and potential fire danger conditions that can be used as a prompt for local and regional
discussions on fire potential. Continue your pre-planning, by discussing where conditions are at, where they are heading, and what this might
mean for fire risk in your patch and for your neighbours.
EXPECTED CLIMATE OUTLOOK: potentially good indicators for what to expect this coming fire season
(Figure 11).
The ENSO outlook for March remains at non-traditional La Niña
conditions. This season’s La Niña has passed its peak and has been
weakening over the last few weeks. International models are forecasting This fire season (2020/21) has not followed traditional La Niña weather
La Niña to continue over the next three months (56% during March - patterns and has resulted in northern locations being unusually drier than
May). The probability drops further during June to August (33%) with a normal. Each historical La Niña event has resulted in slightly different
return to ENSO-neutral conditions favoured (56%). Neutral and La Niña weather patterns for New Zealand. Our weather is very dependent on
conditions are equally favoured (40-45% chance) for spring (September where the high-pressure systems sit (which determines the air flow over
– November). New Zealand). The South Island is currently tracking like the 1998/99 and
2010/11 seasons that were moderate La Niña events.
Regardless of a weakening La Niña, it is still expected to impact New
Zealand’s weather patterns into autumn. A negative Southern Annular
Mode (SAM) is forecast, resulting in cooler, unsettled weather and
westerly winds for the first half of March. During April and May, convective This month: March 2021
activity may become more frequent in the eastern Pacific and South With the start of autumn, while temperatures tend to run a little cooler
America, which will contribute to more low-pressure systems around New than summer, the weather is usually the most settled with long sunny
Zealand, resulting in cooler weather. days. As autumn progresses (during March to May), expect frosts to
occur from time to time in cooler locations. Some southern locations
have already experienced a few frosts in February.
Tropical Cyclone outlook
La Niña may have peaked, but we are now in the peak of tropical March is forecast to be another month of two halves. The first half
cyclone season. Tropical cyclone activity is expected to increase will feel cool, with weather fronts bringing rain and thunderstorms
this month, which may bring much needed moisture closer to New over the country. Winds are likely to shift south-westerly and drag
Zealand. temperatures down. A tropical cyclone (Niran) has formed in the
Coral Sea near the Queensland coast, and has the potential to drift
The tropical cyclone season for the Southern Hemisphere runs from near New Zealand and bring with it much needed moisture. There
November to April, with the odd one occurring outside this period. On is uncertainty in how this will track, and whether the expected high
average, about 10 tropical cyclones form in the South Pacific between pressure (that may or may not eventuate) will protect New Zealand
November and April. To date, five Tropical cyclones have developed from Niran. The second half of the month will feel more summer like
in the south west Pacific (Yasa, Zazu, Ana, Bina & Lucas). with high pressure returning and settled weather. Winds will shift back
to westerlies and bring with it about normal air temperatures.
The risk for New Zealand to be affected by an ex-tropical cyclone
this season remains elevated. The risk is considered above normal,
with equal probabilities of an ex-tropical cyclone passing either to the
east or west of the North Island. Significant rainfall, damaging winds, Further ahead:
and coastal damage by waves are possible in the lead up to and During the next three months (March – May 2021), weather patterns
during these events. These cyclone events can reduce the fire risk are expected to become more variable as the effects of the 2020/21
in affected areas, with effects often being spread over a large area, La Niña event eases and we progress into autumn. Temperatures
especially if a decaying storm system interacts with other existing are likely to be near normal for the east of the South Island, and near
weather systems. normal to above normal in remaining regions. The occasional cool
snap is expected, especially in the first half of March. The west of the
South Island is likely to experience near or below normal rainfall, with
near normal rainfall for remaining locations. Low-pressure systems
Fire season analogues are forecast to become more common. Cyclone activity may impact
To help understand what the fire season could look like during the next New Zealand in the first half of the month, that could result in heavy
three months, fire seasons coinciding with moderate strength La Niña rainfall and flooding for impacted regions (more likely for the North
conditions occurred in 2010/11, 2007/08, 1999/00, and 1998/99. Weak Island). Soil moisture levels and river flows are expected to be near
La Niña seasons included 2000/01 and 2011/12. These past events normal for the east coast, and near normal or below normal for
(historical analogues) reminiscent of moderate or weak La Niña are remaining locations.
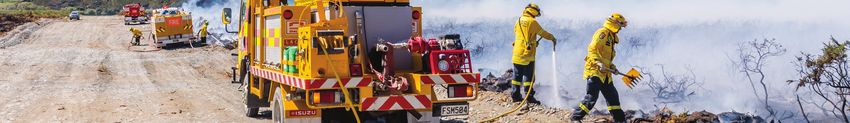
Figure 1. Outlook for March to May 2021: air temperature (left), rainfall (middle), available soil moisture (right). Source: NIWA.
page: 2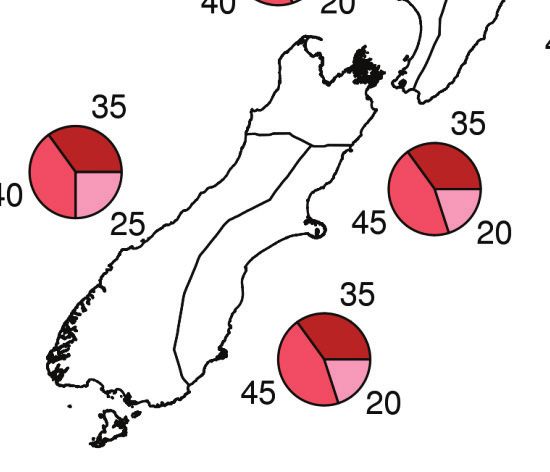
Regional breakdown (Figure 1):                                           wind).
Temperatures are most likely to be:                                      For areas experiencing high curing values, wildfires burning under
•  near normal (45% chance) for Tasman, Nelson, Marlborough,             these high grass curing conditions can spread very quickly, produce
   Buller, coastal Canterbury and eastern Otago;                         large to very tall flame heights (2 m+), be very intense and much
•  near normal (40%) or above normal (35%) for West Coast, Alps          more difficult to suppress. Some areas would also have experienced
   and foothills, inland Otago, and Southland.                           abundant grass growth over the last month, increasing the fuel
                                                                         loading.
Rainfall totals are most likely to be:                                   For some parts of the country still undergoing bouts of rainfall, it’s not
• near normal (45% chance) for Tasman, Nelson, Marlborough,              uncommon to see green landscapes with low curing values. These
   Buller, coastal Canterbury and east Otago;                            areas can help reduce or halt a fire’s spread (depending on the curing
• near normal (40%) or below normal (35%) for the West Coast,            amount). However, be careful with grasslands that have a dense
   Alps and foothills, inland Otago and Southland.                       continuous top cover of dry grass, fires will still race along the tops.

Soil moisture levels are most likely to be:
•    near normal (40% chance) or below normal (35%) for Tasman,
     Nelson, Marlborough and Buller;
•    near normal (40%) or below normal (40%) soil moistures, while
     river flows are below normal (45%) for West Coast, Alps and
     foothills, inland Otago and Southland;
•    near normal (40%) for coastal Canterbury and east Otago.

Last month: February 2021
Looking back, February was dominated by high pressure and settled
weather, with a mid-month low brining wind and rain to places.
Overall, many regions experienced a drier than normal February,
especially Canterbury, Otago, and the West Coast. Much of the South
Island experienced a sunnier than normal month (except Fiordland).
Inland Marlborough, Nelson, Central Otago, Fiordland, and Westland,
south of Franz Joseph, observed a warmer than normal month.
Temperatures for the remaining locations were about normal. Coastal
sea surface temperatures were typically below average to near
average during February.

Soil moisture (Figure 2 & 3)
Dry soils are present along the east coast of the South Island, this
includes Nelson, Marlborough, coastal Hurunui, Banks Peninsula,           Figure 2. Soil moisture deficits as of 03/03/2021.
Selwyn, Mackenzie, Waitaki, Queenstown Lakes and Central Otago            Source: NIWA.
districts (Figure 2). In contrast, soil moisture levels are at field
capacity or nearing water surplus along the West Coast.                   Note: Soil moisture deficit means the amount of water needed to bring the
                                                                          soil moisture content back to field capacity, which is the maximum amount
Soil moisture levels are about normal for this time of the year across    of water the soil can hold.
much of the South Island (green/yellow) (Figure 3). The exceptions
being slightly drier than normal soils present in the Hurunui, Banks
Peninsula, Ashburton and Clutha districts. In contrast, wetter than
normal soils are present in Fiordland and Stewart Island.
NIWA’s Drought Index (NZDI) indicates dry to very dry soils occurring
across north-eastern regions (Nelson, Marlborough, North Canterbury
and a pocket in Banks Peninsula). There are currently no South Island
locations in meteorological drought.

Grass growth & curing:
As we progress through the autumn months, grasslands will start
to green up again. However, dead grass remaining from this or
previous seasons can contribute substantially to the amount of
dead fuel in a grassland and is therefore important to include in your
curing estimation. This dead grass is referred to as thatch. Thatch
is still capable of carrying a fire through green grass that would not
otherwise burn. This influence is particularly important when the
current season has curing values around 30%-50%. In the absence
of thatch, green grass would not necessarily be able to sustain fire
spread. Typical fire behaviour in these grasslands will produce very
small flame heights, be smokey, patchy in its progression and will be
low intensity.
Depending on where you are in the country, grass curing could be         Figure 3. Soil moisture anomaly as of 03/03/2021.
patchy over a series of paddocks/area, especially during the 40-         Source: NIWA.
80% curing period. Or if you experienced summer droughts, curing
will become more continuous in the dry phase of 70 – 100% curing.        Note: Soil moisture anomaly means the difference between the historical
Above 80% curing, fuel moisture content begins to be significantly       normal soil moisture deficit (or surplus) for a given time of year and actual
influenced by the environmental factors (humidity, temperature and       soil moisture deficits.

                                                                                                                                              page: 3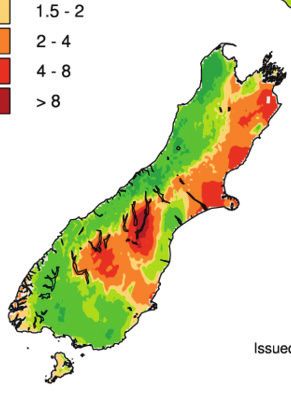
The finer details:                                                            What does typical La Niña mean for NZ?
 The degree of grassland curing represents the proportion of dead              New Zealand’s climate is influenced by two key natural cycles: the
 material in a grassland fuel complex, expressed as a percentage.              El Niño-Southern Oscillation (ENSO) and the Interdecadal Pacific
 It is an important input for models to predict rate of fire spread and        Oscillation (IPO). Both these operate over the Pacific Ocean and
 determine fire danger levels in grasslands.                                   beyond, and cause fluctuations in the prevailing trade winds and in
                                                                               the strength of the subtropical high-pressure belt.
 Grassland curing will affect fire behaviour in several ways: it increases
 the amount of dead material present and affects fuel moisture content.        El Niño and La Niña are opposite phases of the global ENSO climate
 The result is an increased chance of fire ignition, fire intensity and        cycle. The two phases disrupt the typical wind and rainfall patterns
 rates of spread. The moisture content of fine grass fuels (as well as         for New Zealand. Neutral conditions encourage far more variability in
 pine litter and other fine fuels) also dramatically affects the ignition      weather patterns for New Zealand, whereas El Niño or La Niña tend
 potential and ability of a wildfire to spread. High amounts of moisture       to have more predictable patterns.
 increase the heat and thermal conductivity of fuel, so that more heat
 is required for the fuel to reach its ignition temperature. As grasses        It’s important to note that ENSO events have an important influence
 cure, and become drier, less heat is required to ignite and sustain a         on New Zealand’s climate, but account for less than 25% of seasonal
 fire.                                                                         rainfall and temperatures. La Niña is only an important climate driver
                                                                               for New Zealand over long durations (2-6 months) when a moderate
 In partially cured grasslands, enough dead fuel needs to be present           or strong event is in force. If a weak La Niña occurs, it means our
 to ignite and sustain fire spread. Surrounding green grass with higher        ‘local’ climate players (the Southern Ocean southerlies and Tasman
 fuel moisture contents will require substantial heat input to burn off        Sea lows) will continue to take turns ruling our weather.
 excess moisture and ignite. If there is not enough heat to ignite the
 greener sections of the grass, fire spread will either be very patchy         This is a good reminder that local climate patterns (blocking Highs
 or not spread at all. Burning under these conditions will produce very        over or near New Zealand, Lows over the Tasman Sea or to the north
 small flame heights, be low intensity and easily suppressible.                of the country, and the Southern Ocean storms) generally ‘trump’
                                                                               climate patterns such as El Niño and La Niña
 In some areas, the presence of dead matted material from the
 previous season’s growth (thatch) can contribute to the ease of a fire
 starting and spreading. The material is often hidden underneath lush
 green grass that appears to have low curing (30 - 50%). However,              Typical La Niña effects on New Zealand
 thatch can increase a fires ability to carry and sustain a fire. These        La Niña can encourage warmer than average sea temperatures, and
 fires will typically produce small flame heights and spread in a patchy       fuel cyclones. The north can experience frequent lows and subtropical
 manner. It is often necessary to part the current season’s grass to           storms, occasionally stretching down as far as Canterbury. New
 examine how much thatch is underneath. Even if a paddock has been             Zealand is typically warmer than average during a La Niña, although
 harvested or grazed, there is often a couple centimetres of dead              there are regional and seasonal exceptions. During La Niña, more
 grass remaining.                                                              high-pressure systems than normal lie over the east of the country
                                                                               (South Island and Chatham Islands). This generally leads to more
                                                                               north-easterly and easterly winds (as opposed to westerlies).
 Fine Fuel Status:
 The moisture content of fine fuels under forest canopies or
 scrublands, and grass pastures (as they brown off) dramatically               Typical La Niña effects on the South
 affects the ignition potential and ability of a wildfire to spread. High      For the South Island, under La Niña we tend to observe less wind
 amounts of moisture increase the heat and thermal conductivity of             and reduced rainfall in the south and south west in spring. Coastal
 fuel, so that more heat is required in order for the fuel to reach its        Marlborough and Canterbury can be cloudier and cooler, with a
 ignition temperature. As grasses cure, and become drier, less heat is         chance of more rain than in non-La Niña years.
 required to ignite and sustain a fire.
                                                                               During a La Niña summer, anticyclones are more frequent over
                                                                               southern New Zealand, bringing dry weather and the West Coast,
 If a heat source is present in fine fuels with a FFMC of 86 or more, or       Southland and western parts of Otago tend to dry out. However, areas
 grass curing over 80%, ignition will be easy, and a fire can still spread.    such as Central Otago and South Canterbury can experience drought
 Under warm and windy conditions, incredible rates of spread and               in both El Niño and La Niña.
 flame lengths, even with shorter grass can be observed. Light, flashy
 fuels are one of the common denominators of tragedy fires.

     Low

Moderate

    High
Very high
 Extreme

                                                                          March 2008                                      March 2012
                     February 2021

Figure 4. Monthly average Severity Rating for: the previous month (left), and expected average monthly values during the 2007/08
moderate strength La Niña (left) & 2011/12 (right) weak strength La Niña year
 page: 4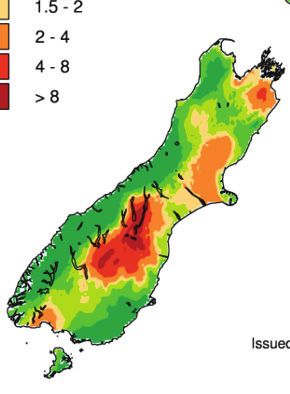
FWI values
     Low
Moderate
     High
Very high
 Extreme

                     February 2021                                March 2008                                    March 2012

BUI values
    Low
Moderate
    High
Very high
 Extreme

                    February 2021                                 March 2008                                    March 2012

ISI values
     Low
Moderate
    High
Very high
 Extreme

                    February 2021                                 March 2008                                    March 2012

 Figure 5. Previous Monthly Average for the:   Figure 6. Expected average Monthly values of: Fire Weather Index (top), Buildup Index
 Fire Weather Index (top), Buildup Index       (middle) and Initial Spread Index (below); and during the 2007/08 moderate strength La
 (middle) and Initial Spread Index (below).    Niña (left) & 2011/12 (right) weak strength La Niña year.

                                                                                                                            page: 5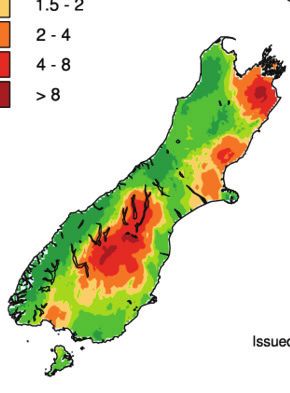
DC values
     Low
Moderate
    High
Very high
 Extreme

                   November  2019
                   February 2021                                  March 2008                                   March 2012

DMC values
     Low
Moderate
    High
Very high
 Extreme

                   February 2021                                  March 2008                                  March 2012

FFMC values
     Low
Moderate
    High
Very high
 Extreme

                   February 2021                                  March 2008                                   March 2012

Figure 7. Previous monthly average for the:   Figure 8. Average monthly values of: Drought Code (top), Duff Moisture Code (middle) and
Drought Code (top), Duff Moisture Code        Fine Fuel Moisture Code (below); and during the 2007/08 moderate strength La Niña (left)
(middle) and the Fine Fuel Moisture Code      & 2011/12 (right) weak strength La Niña year.
(below).
     page: 6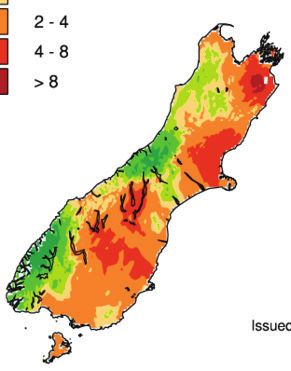
Forest Fire Danger
     Low
Moderate
     High
Very high
 Extreme

                     February 2021                               March 2008                                   March 2012

Grass Fire Danger
    Low
Moderate
    High
Very high
 Extreme

                     February 2021                               March 2008                                   March 2012

Scrub Fire Danger
     Low
Moderate
    High
Very high
 Extreme

                     February 2021                               March 2008                                   March 2012

Figure 9. Previous Monthly Average for the:   Figure 10. Expected average monthly values of: Forest Fire Danger (top), Grassland Fire
Forest Fire Danger (top), Grassland Fire      Danger (middle) and Scrub Fire Danger (below), during the 2007/08 moderate strength La
Danger (middle) and Scrub Fire Danger         Niña (left) & 2011/12 (right) weak strength La Niña year.
(below)
                                                                                                                          page: 7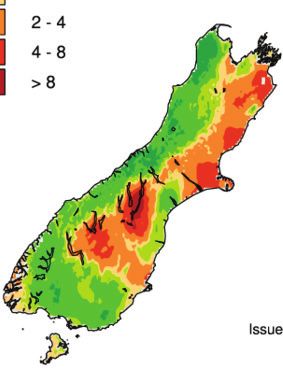
September                October              November               December                 January               February                  March                   April                   May

page: 8
   2011 - 2012
  2007 - 2008
   2010- 2011
                                                                                                                                                                                                             Low

                                                                                                                                                                                                        Moderate

                                                                                                                                                                                                            High

  2020 - 2021
                                                                                                                                                                                                        Very high
                                                                                                                                                                                                         Extreme

          Figure 11. New Zealand Fire Season Severity (monthly)
          The years of 2007/08, 2010/11, 1999/00, and 1998/99 and are ideal comparisons for what the South Island might experience over the next few months. These years were moderate strength La Niña years,
          2011/12 was a weak La Niña event. DSR values of less than one equates to low fire behaviour potential, 1-3 moderate fire potential, 3-7 high to very high fire potential, and above 7 extreme fire behaviour
          potential.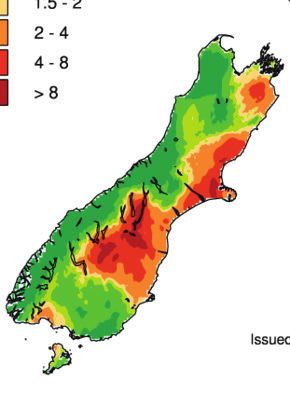
Note:
 Tracking trends
 Comparisons of fire dangers for individual indicator stations for different regions are not shown in this outlook due to the low fire danger and
 severity across the country. As fire dangers increase, more detailed regional outlooks will recommence highlighting where Buildup Index
 (BUI), Drought Code (DC) and Cumulative Daily Severity Rating (CDSR) values sit in comparison with previous fire seasons.

 For fire managers who are interested in tracking fire season trends for all your weather stations, the graphs are available on the Scion Rural
 Fire Research website under tools.

Background info on FWI codes and indicies:
Fine Fuel Moisture Code (FFMC)           Duff Moisture Code (DMC) A rating of                    Drought Code (DC) A rating of the
An indicator of the relevant ease of     the average moisture content of                         average moisture content of deep,
ignition and flammability of fine fuels. loosely compacted organic soil layers                   compact, organic soil layers, and a
                                         (duff/humus) of moderate depth, and                     useful indicator of seasonal drought
 0 - 74      Difficult                   medium-sized woody material                             effects on forest fuels and amount of
                                                                                                 smouldering in deep duff layers and
 75 - 84        Moderately easy                  0 - 10        Little mopup needs                large logs.
 85 - 88        Easy                             11 - 20       Moderate                           0 - 100        Little mopup needs
 89 - 91        Very easy                        21 - 30       Difficult                          101 - 175      Moderate
 92 +           Extreme easy                     31 - 40       Difficult & extended               176 - 250      Difficult
                                                 41 +          Difficult & extensive              251 - 300      Difficult & extended
                                                                                                  301 +          Difficult & extensive

Buildup Index (BUI)                            Initial Spread Index (ISI) Combines the             Fire Weather Index (FWI)
Combines the DMC and DC,                       effect of wind speed and the FFMC,                  Combines the ISI and BUI to indicate
and represents the total amount                providing a numerical rating of                     the potential head fire intensity of a
of fuel available for combustion.              potential fire spread rate.                         spreading fire (on level terrain).
 0 - 15         Easy control                     0-3            Slow rate of spread
                                                                                                     0-5           Low fire intensity
 16 - 30        Not difficult                    4-7            Moderate fast
                                                                                                    6 - 12         Moderate
                                                 8 - 12         Fast
 31 - 45        Difficult                                                                           13 - 20        High
                                                 13 - 15        Very fast
 46 - 59        Very difficult                                                                      21 - 29        Very High
                                                 16 +           Extremely fast
 60 +           Extremely difficult                                                                  30 +          Extreme

Daily Severity Rating (DSR) A numerical rating of the daily fire weather severity at a particular station, based on the FWI.
It indicates the increasing amount of work and difficulty of controlling a fire as fire intensity increases. The DSR can be
averaged over any period to provide monthly or seasonal severity ratings.

Monthly Severity Rating (MSR) is the average of the DSR values over the month. DSR and MSR captures the effects of
both wind and fuel dryness on potential fire intensity, and therefore control difficulty and the amount of work required
to suppress a fire. It allows for comparison of the severity of fire weather from one year to another.
 0-1       Low fire behaviour potential
 1-3       Moderate fire potential
 3-7       High to very high fire potential
 7+        Extreme fire behaviour potential

  Acknowledgements:
  Fire Danger interpretation was from information gathered from the Average Monthly Maps for: Severity Rating, FWI, BUI, ISI,
  DC, DMC, FFMC, Grassland FDC, Scrub FDC & Forest FDC. These maps were obtained from the Fire and Emergency New
  Zealand’s Fire Weather System powered by Eco Connect.

  Information on the Expected Climate Outlook was gathered from:
  •    MetService, Rural Monthly outlooks:
          www.metservice.com/rural/monthly-outlook
  •    NIWA, Seasonal Climate outlook:
          www.niwa.co.nz/climate/sco
  •    Australian Bureau of Meteorology Climate outlooks
       http://www.bom.gov.au/climate/ahead/?ref=ftr
  • WeatherWatch.co.nz
        https://www.weatherwatch.co.nz/
  Front Cover Image: 2020 Research Burns (V Clifford, Scion).

                                                                                                                                          page: 9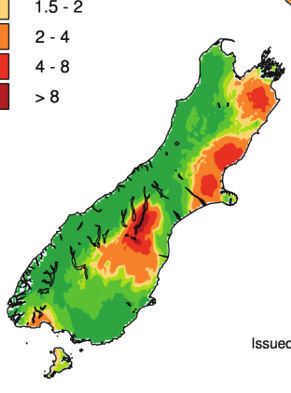
You can also read