Investor & Analyst meeting March 24, 2021 - Leifheit Group
←
→
Page content transcription
If your browser does not render page correctly, please read the page content below
Investor & Analyst meeting March 24, 2021

Disclaimer

This presentation contains forward-looking statements which are based on the management’s current estimates with regard to future
developments. Such statements are subject to risks and uncertainties which are beyond Leifheit’s ability to control or estimate precisely, such
as statements on the future market environment and economic conditions, the behavior of other market participants and government
measures.

If one of these uncertain or unforeseeable factors occurs or the assumptions on which these statements are based prove inaccurate, actual
results could differ materially from the results cited explicitly or contained implicitly in these statements. Leifheit neither intends to, nor does it
accept any specific obligation to update forward-looking statements to reflect events or developments after the date of this presentation.

Leifheit AG shall not assume any warranty for the information provided in this presentation being up-to-date, accurate, complete or of good
quality or for the suitability of the information for specific purposes.

Any liability of Leifheit AG for loss caused by the use or non-use of the information provided or by wrong or incomplete information is
excluded.

Analyst meeting                                                                                                                      March 2021      2
Executive Summary FY 2020

                            Group turnover up 16%
                            to € 272 m in 2020

                            Group turnover up 22.6%
                            in Q4 2020

                            Germany turnover up 15% in 2020
                            and up 41% in Q4 2020

                            2020 EBIT up 90% to € 18.8 m

                            Dividend proposal: 1.05 €,
                            up 91% vs previous year
Analyst meeting                                          March 2021   3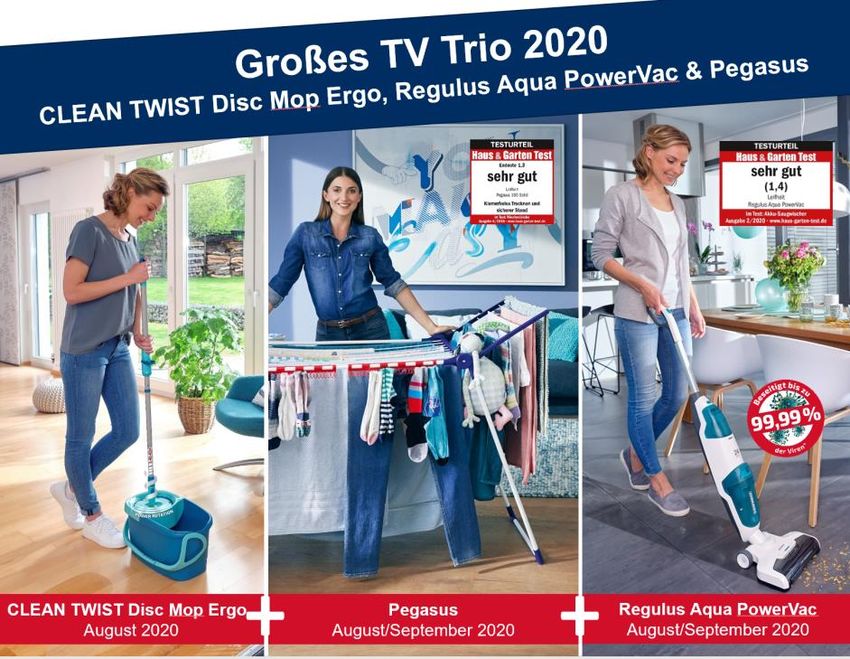
Good start to Q1 2021 but effects of COVID-19
pandemic continue to be noticeable
Very good start to the 2021 financial year on the sales side
         -    Successful start of new TV campaigns for Leifheit products in Germany
              and other European markets as well as for Soehnle brand
         -    Increased consumer demand helps expand distribution network

Nevertheless, effects of COVID-19 pandemic still clearly noticeable
         -    Important sales channels in key markets closed since December
         -    Significant rise in steel and plastic prices
         -    Tense situation in the sea fright sector
         -    Pandemic-related cost increases at Czech plant

Forecast 2021: further turnover and EBIT increase despite COVID-19
         -    Turnover increase of at least 5%
         -    Household up 6%, Wellbeing up 7%, Private Label slightly above level of 2020
         -    EBIT between € 20 m and € 24 m
         -    Free cash flow between € 10 m and € 14 m

Analyst meeting                                                                              March 2021   4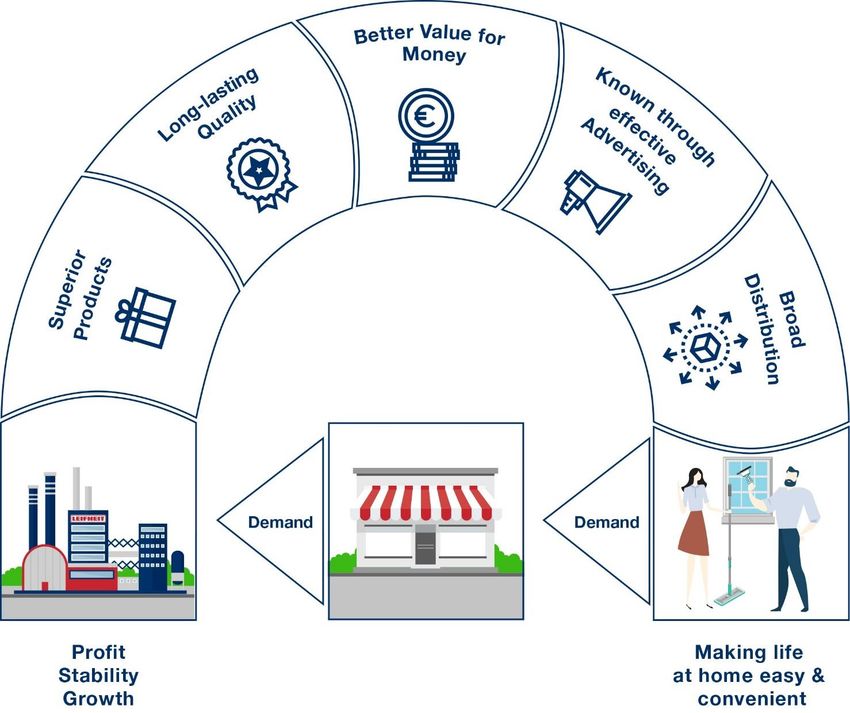
Leifheit makes top quality household products,
designed in Germany
      Profi Floor Wiper   CLEAN TWIST       Pegasus 150   Linomatic 500 Deluxe
           4.7 stars        4.6 stars         4.6 stars         4.5 stars

Analyst meeting                                               March 2021    5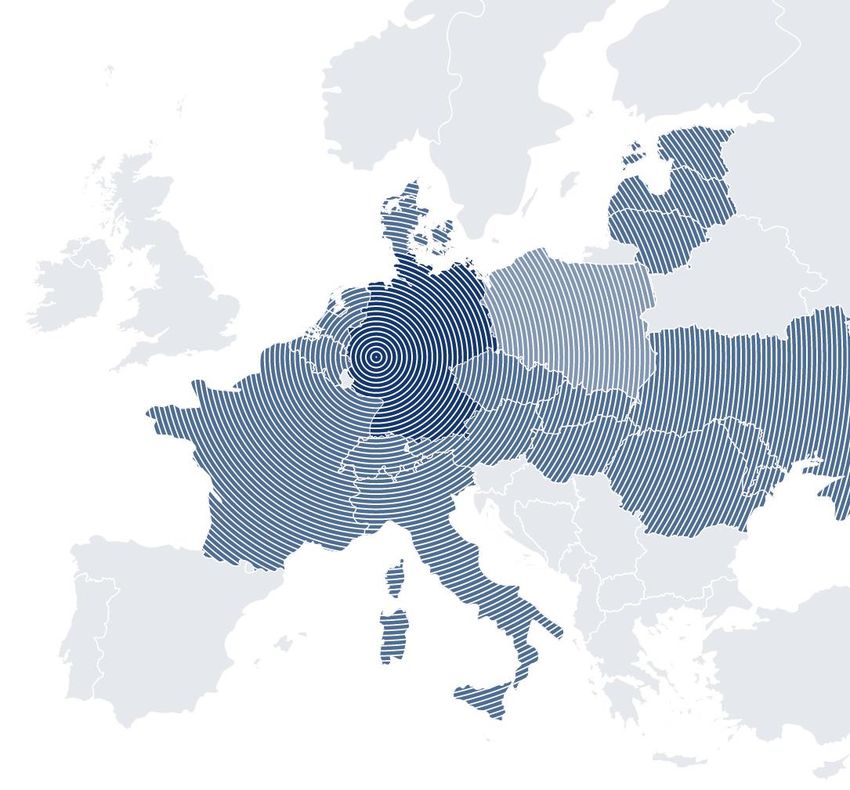
Leifheit is financially solid and
pays good dividends to shareholders
  Commitment to shareholders                                                                                              Strong products and brands
  in €
  1.50
  1,50
                             Dividend payments 1984 - 2020*
  1,00
  1.00

  0,50
  0.50

  0,00
  0.00

                                   Bonus/special dividend            Dividend              *2020 Proposal

  Strong financial structure                                                                                              Strong long-term stock performance
  in € m                                                                                                                  in %
             Assets                                                                                                       600
                                                                         Liabilities
  250                  230
            215                                                250                                                        500
                                   Cash and financial assets
                                                                                     230
                        39                                              215
  200                                                                                                                     400
            50                                                 200                   62            Other provisions and
                                   Inventories                          52                         liabilities
                        60                                                                                                300
  150
            46
                                                               150                                 Pension reserves
                                   Receivables and other
                                                                        67           68                                   200
  100       52          63         current assets

                                                               100                                 Equity

            10          11         Other non-current assets                                                               100
   50
            57          57                                     50       96           100                                    0
                                   Non-current assets
    0                                                                                                                        2011   2012   2013   2014   2015   2016   2017   2018   2019   2020   2021
         31/12/2019 31/12/2020                                  0
                                                                     31/12/2019   31/12/2020

Analyst meeting
However, our 2018 and 2019 results were
disappointing… can we change that?
Gross profit                                                                          EBIT
in € m                                                                                in € m

                  109.9                102.1                  101.0                            18.8                 13.1                  9.9
                                                                                      20                                                                 12,00%
                  -2%                      -7%                -1%                              -15%                 -31%                 -24%
120                                                                           47,0%
                    46.4%                                                             18
                                                                                                                                                         10,00%
                                                                                      16
100                                                                           46,0%

                                                                                      14              8.0%
                                                                                                                                                         8,00%
 80                                                                           45,0%
                                                                                      12

                                                                                      10                                   5.6%                          6,00%
 60                                                                           44,0%
                                                  43.6%
                                                                      43.1%            8                                                          4.2%
                                                                                                                                                         4,00%
 40                                                                           43,0%    6

                                                                                       4
 20                                                                           42,0%                                                                      2,00%
                                                                                       2

  0                                                                           41,0%    0                                                                 0,00%
                  2017                     2018               2019                             2017                 2018                 2019
                            Gross profit            Gross margin                                             EBIT          EBIT margin
Analyst meeting                                                                                                                      March 2021          7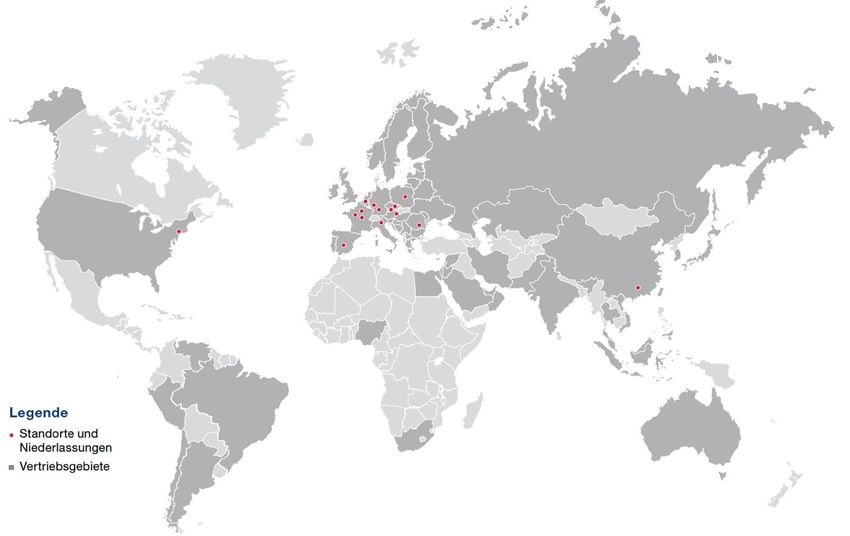
Successful turnaround in 2020 -
EBIT up 90% vs. 2019
Gross profit                                                                   EBIT
in € m                                                                         in € m

              109.9        102.1           101.0           122.3                        18.8          13.1          9.9           18.8
                  -2%       -7%            -1%             +21%                         -15%          -31%          -24%          +90%
                                                                       47,0%
                                                                                 20                                                             12,00%
              46.4%
120                                                                              18
                                                                       46,0%                                                                    10,00%
                                                                                 16
100                                                                                            8.0%
                                                                   45,0%         14
                                                                       45,0%                                                             6,9% 8,00%
 80                                                                              12

                                   43.6%                               44,0%     10                          5.6%                               6,00%
 60
                                                                                  8
                                                   43.1%               43,0%                                               4.2%
 40                                                                                                                                             4,00%
                                                                                  6

                                                                       42,0%      4
 20                                                                                                                                             2,00%
                                                                                  2
  0                                                                    41,0%
                                                                                  0                                                             0,00%
                  2017     2018            2019            2020
                                                                                        2017          2018          2019          2020
                         Gross profit         Gross margin 2                                           EBIT         EBIT margin   2
Analyst meeting                                                                                                                    March 2021           8
New strategy transforms Leifheit
      into a growing business
      Group turnover development by quarters
      in %

                                                                                    •   After years of flat revenue now
                                                                                        double-digit growth in 2020
                                                                                    •   Very strong 2nd half ‘20 with more
                                                                                        than 20% sales growth in Q3 and Q4
40
                                                                                    •   Q4 growth affected by temporary
                                                                +28.4%    +22.6%        closure of key distribution channels
30                                                                                      during the high-revenue Christmas
                                                                                        period
20

                                            +6.8%     +7.9%
10
                         +0.4%

 0
                                   -0.7%
              -3.5%
-10

-20
             Q2 2019    Q3 2019   Q4 2019   Q1 2020   Q2 2020   Q3 2020   Q4 2020
      Analyst meeting                                                                                     March 2021      9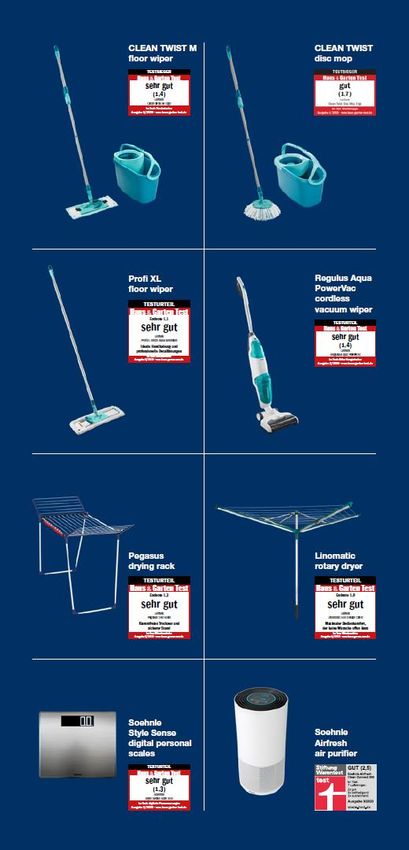
EBIT margin up by 270 basis points
from 4.2% in 2019 to 6.9% in 2020
                                          2019    2020                           ∆
 Group turnover                      €m   234.0   271.6                 16.0 %
 Gross margin                        %     43.1    45.0                 1.9 pps
 Foreign currency result             €m     0.3    -0.9                > -100 %
 EBIT                                €m     9.9    18.8                 90.2 %
 EBIT margin                         %      4.2     6.9                 2.7 pps
 Earnings before taxes (EBT)         €m     8.5    17.7                > 100 %
 Net result for the period           €m     5.8    12.5                > 100 %
 EPS                                  €    0.61    1.32                > 100 %

Analyst meeting                                           March 2021        10
Growth and pandemic-related higher
Working Capital affected liquidity
in € m 2019 2020 ∆
Cash flow from operating activities 15.9 4.0 -11.9
Cash flow from investment activities -5.8 -9.5 -3.7
Cash flow from financing activities -10.7 -6.0 4.7
Cash and cash equivalents at the end of reporting period 50.3 38.8 -11.5
Free cash flow1 10.1 -5.5 -15.6
Financial liabilities - - -
• Strong rise in working capital due to increase of trade receivables and inventories.
• Trade receivables rose by € 13.0 m roughly in line with turnover growth in Q4 and due to customer-related receivables structure.
• Increase in inventories by € 13.9 m to ensure supply chain resilience in face of COVID-19 and planned turnover growth in Q1 2021.
• Trade payables and other liabilities also increased by m€ 6.4.
• At € 9.6 m investments above previous year (€ 6.0 m), esp. to improve efficiency and expand production capacities at Czech plant
1 Cash flow from operating activities and from investment activities, adjusted for incoming and outgoing payments in financial assets and, if existing, from acquisition and divestiture of business divisions.
Analyst meeting March 2021 11Negative cash flow behind turnover growth (trade receivables) and increased
inventories (prepare future growth and secure supplies during pandemic)
Group liquidity
31.12.2019 vs. 31.12.2020 in € m
• Increase in trade receivables
as a result of turnover growth
8.5
(FY 2019: decrease € 6.3 m)
12.5
• No noteworthy effects
50.3 6.4 from aging of receivables in
13.0 38.8 connection with COVID-19
1.7
13.9 • Increase in inventories due to
9.5 0.8 consumer advertising planned
62,8
58,3 for the next months and to
50,3 49,1
44,4 44,4 secure supply chain during the
39,6
ongoing pandemic
Cash and cash Net result for Depreciation Trade Inventories Liabilities Others 1 Investments Lease liabilities Cash and cash
equivalents the period and receivables equivalents
31.12.2019 amortization 31.12.2020
1 Others contains sales and income taxes in the amount of +€ 4.1 m.
Analyst meeting March 2021 12Our purpose? Happy consumers!
Better Value for
Money
Analyst meeting March 2021 13We call our strategy “Scaling up success”
Focus
KPIs
Growth Profitability Level of Completion
1
• Invest in pre-tested and scalable high ROI
2019 2020 2020+
consumer advertising
Create consumer
on profitable best sellers Concept Realisation Impact
Revenue
demand
• Launch new products only if margin > average and growth
if supported by pre-tested advertising
2
Increase national 2019 2020 2020+
• Leverage stronger brand to attract additional
and international Concept Realisation Impact
retailers and e-tailers
distribution
• Ensure good sell-out in new retail partners with
co-advertising
Gross
margin
3
• Focus on own “made in Europe” profitable 2019 2020 2020+
products
Improve gross Concept Realisation Impact
• Negotiate win-win with retailers, growing their
margins
total but not their % profit.
• Take pricing and charge for logistics complexities
4 EBIT
2019 2020 2020+ margin
Reduce all cost • Reduce SKUs dramatically
except consumer • Strict R&D discipline Concept Realisation Impact
advertising • Create fun, friendly, fast & fearless culture
• Growing revenues leverages current structure
Analyst meeting March 2021 141 Create consumer demand and make brands stronger
Peer group comparison Marketing spend and EBIT
2020 in % of turnover
EBIT margin
25,0
P&G1
20,0
15,0
Unilever1
Beiersdorf1
10,0
5,0
Leifheit 2020
Leifheit 2019
0,0 Marketing spend
0 5 10 15 20 25 30 35 40
1 Source: Annual reports 2020
Analyst meeting March 2021 151 We tested massive advertising spend in
several countries with strong results
Turnover development selected TV markets
Group turnover 2020 in € m
+35% +20% +52% +18% +33%
Netherlands Belgium Switzerland Poland Romania
Analyst meeting March 2021 161 Encouraged by strong results in TV advertising test countries
we took the approach to our #1 market Germany H2
Turnover development Germany
Group turnover % change 2020 vs 2019
Q4 2020
+41%
FY 2020
+14,6%
Analyst meeting March 2021 171 New strategy led to positive turnaround in Germany
away from the recent downward trend
Group turnover development in Germany
by quarters in %
• Clear upward trend after
years of flat sales
40,7 • Consumer advertising led
to very strong 2nd half ‘20
36,0 32,8 with double-digit sales growth
in Q3 and Q4
26,0
16,0
4,9
6,0
0,8
-4,0 -0,4
-1,0 -2,0 -0.4
-3,5 -2,3
-5,0
-8,9
-14,0
Q1 2018 Q2 2018 Q3 2018 Q4 2018 Q1 2019 Q2 2019 Q3 2019 Q4 2019 Q1 2020 Q2 2020 Q3 2020 Q3 2020
Analyst meeting March 2021 181 Encouraged by strong advertising results on
brand Leifheit, we scaled up this approach to
brand Soehnle in Q3
• Campaign focused on Soehnle Page Profi 300 digital kitchen scales, recently awarded a
“very good” test result.
• Soehnle Page is the most-popular range of kitchen scales in Germany.
• Target group-relevant and high-reach top print titles from September to December 2020:
8 million copies, 2.74 million target group contacts.
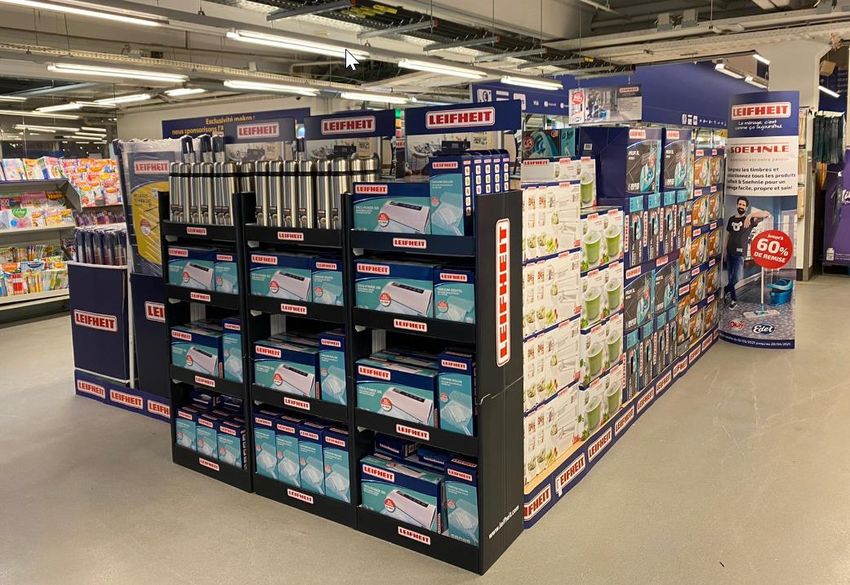
Analyst meeting March 2021 192 We are successfully expanding our
distribution network in 2020
Permanent listings in
1,200
additional supermarkets
in the DACH region
Analyst meeting March 2021 204 While spending more on consumer advertising,
we drive down all other cost
% of Group turnover FY 2018 FY 2019 FY 2020 Change
Consumer marketing 0.7% 1.7% 5.5% +3.8 pp ✓
Other marketing 5.4% 4.6% 3.6% -1.0 pp
✓
R&D 2.3% 2.4% 2.1% -0.3 pp ✓
Logistics1 11.0% 11.5% 10.5% -1.0 pp
✓
Administration 6.1% 6.4% 5.4% -0.9 pp
✓
Cost of turnover 56.4% 56.8% 55.0% -1.9 pp ✓
OPEX2 adj. by Consumer marketing 94.2% 94.7% 87,7% -7.0 pp
✓
OPEX2 94.9% 96.4% 93,2% -3.3 pp
✓
1 Not including inbound cost 2 Without other operating income/expenses
Analyst meeting March 2021 21Forecast 2021
Turnover and earnings growth
Forecast
2021
Group turnover at least +5%
Turnover Household at least +6%
Turnover Wellbeing at least +7%
Turnover Private Label Slight increase
Group EBIT 20 – 24 €m
Free Cashflow 10 – 14 €m
Analyst meeting March 2021 22Your questions please.
Annex
Annex
Leifheit Group structure
Household Wellbeing Private Label
Kitchen
Laundry Care Cleaning Kitchen goods Personal scales Kitchen scales Standing Dryers
goods
Wellbeing
9.8% Rest of
World
5.0% Germany
Kitchen Goods Laundry Care 39.5%
16.7% 37.6%
Turnover by Eastern
Turnover
product Europe
by region
category 12.5%
2020
2020
Central
Cleaning Europe
35.9% 43.0%
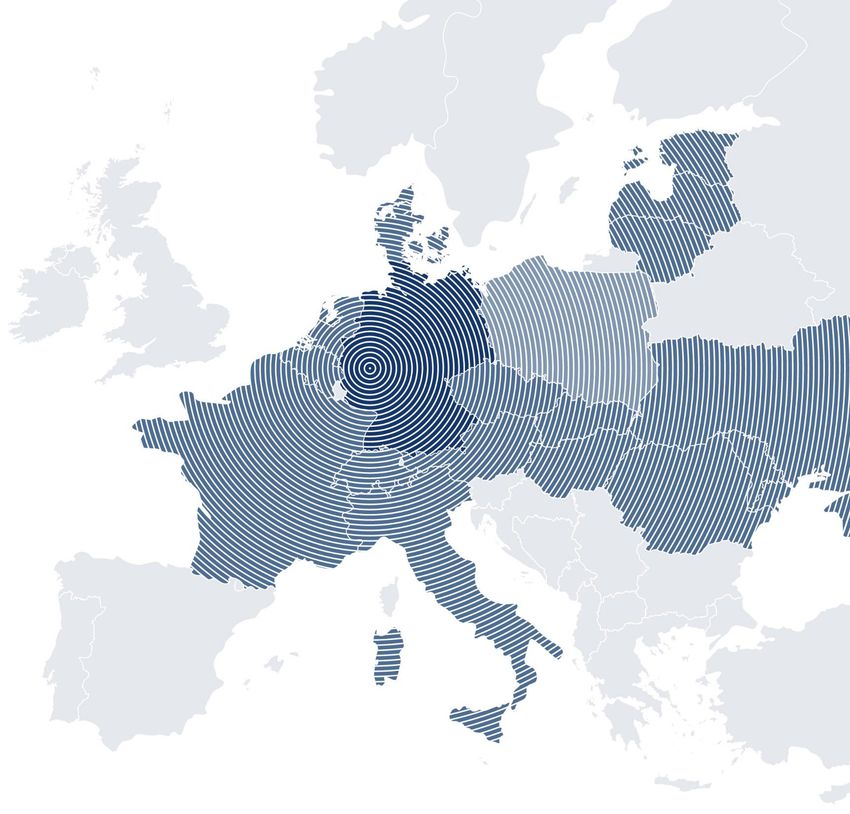
Analyst meeting March 2021 26Annex
Our European production footprint ensured reliable supply to
customers in spite of COVID-19 challenges in the supply chain
Paris/F (Leifheit/Birambeau) Nassau/D (Leifheit/Soehnle)
• About 70 employees • About 280 employees
• Marketing, sales • Marketing, sales, development, quality
and administration assurance, central administration
• Manufacturing of rotary dryers, vacuum jugs,
roll holders and floor wipers
Blatná/CZ (Leifheit)
• About 450 employees
• Manufacturing of tower dryers,
wall dryers and floor wipers
• Logistic center
Eastern Europe
Operating in more Zuzenhausen/D (Leifheit)
• About 120 employees
than 80 countries • Logistics center
with 14 own branches
Head office and
branches La Loupe/F (Herby)
• About 80 employees
Sales region
• Manufacturing of wall and tower dryers
Analyst meeting March 2021 27Annex
Fortunately, hypers & discounters stayed open
during Covid-19 retail shut-downs
Blue Chip client base Distribution channels
Turnover in % (previous year’s figures)
Electro Others
3 (3) 6 (5)
Cash & Carry
3 (3) Hypermarket
Importers/ 27 (29)
Exporters
Top 10 8 (8)
Customers
Turnover 2020:
account for 50%
Discounter € 271.6 m
of Leifheit’s
turnover 9 (8)
Retail-/Whole sale, E-Commerce
Department stores 19 (16)
11 (11)
DIY
14 (17)
Analyst meeting March 2021 28Annex
Strong growth in Household and Wellbeing
segments following large-scale advertising
Group turnover by segment Group turnover by segment
2019 vs 2020 in € m 2020
11.7%
271.6 78.5% Household
300 Private Label
234.0 9.8% Wellbeing
250 32.0 Wellbeing Private Label
26.5
32.2
200 Household
19.8
150 • Turnover in Household segment up by 17.0%, strong growth in
product categories Cleaning and Laundry due to successful TV
213.1 campaigns and consumers’ increased need for hygiene.
100
182.0
• Wellbeing segment increased by 33.7%, mostly due to growth of
Soehnle Medical and Airfresh ranges. Strong sales of kitchen
50 scales following print advertising campaign.
• Private Label decreased by 0.5% compared to 2019 due to severe
0 COVID-19 restrictions in France. However, acquisition of new
2019 2020
customers slowed the decrease.
Analyst meeting March 2021 29Annex
Turnaround in Germany through successful
TV advertising campaigns
Group turnover by region Group turnover by region
2019 vs 2020 in € m 2020
140
5.0%
12.5% Germany
39.5%
116.9
120 Central Europe
107.2
93.5 101.3
100 Eastern Europe
Rest of the world
80 43.0%
60
• Turnaround in Germany: 14.6% growth following large-scale TV
advertising campaign in H2.
33.9 • Central Europe with strong growth of 15.5%. The Netherlands and
40
30.7 Switzerland remain most important markets for Leifheit in the region.
13.6 • Eastern Europe with double digit turnover increase of 10.3% due to
20
8.5 increased consumer marketing investments. Particularly strong
growth in Romania and Poland.
0
Germany
2019 2020 Central
2019 Europe
2020 Eastern
2019 Europe
2020 Rest of the
2019 World
2020
Germany Central Europe Eastern Europe Rest of the world
Analyst meeting March 2021 30Annex
Number of employees at a stable level
Employee development Employees by region
31 Dec 31 Dec 2020
7.3%
Private Label
Germany
1.200 12.9%
1,106 1,098 Wellbeing 36.7%
Czech Republic
148 137 Household
1.000
France
52 47
Other countries
800
43.1%
600
906 914
400
200
0
2019 2020
Analyst meeting March 2021 31Annex
Long-term financial overview
2016 2017 2018 2019 2020
Group turnover €m 237.1 236.8 234.2 234.0 271.6
Profitability
▪ Gross margin % 47.5 46.4 43.6 43.1 45.0
▪ Cash flow
from operating activities €m 21.8 7.2 10.2 15.9 4.0
▪ Free cash flow €m 14.3 1.5 3.7 10.1 -5.5
▪ EBIT €m 22.1 18.8 13.1 9.9 18.8
▪ EBIT adjusted1 €m 21.8 20.3 12.8 9.6 19.7
▪ EBIT margin % 9.3 8.0 5.6 4.2 6.9
▪ EBT €m 20.6 17.7 11.9 8.5 17.7
▪ Net result for the period €m 14.5 12.8 8.4 5.8 12.5
▪ ROCE2 % -1 16.3 12.7 10.5 8.2 14.1
1 Adjusted by foreign currency results
2 Definition of ROCE changed in 2019, ROCE 2018 adjusted for comparability reasons
Analyst meeting March 2021 32Annex
Long-term financial overview
2016 2017 2018 2019 2020
Per share1
Net result for the period2 € 1.53 1.35 0.88 0.61 1.32
Free cash flow € 1.51 0.16 0.39 1.06 -0.57
Dividend2 € 1.05 1.05 1.05 0.55 1.05
Special dividend € 0.40 -- -- -- --
Investments €m 7.8 7.8 6.6 6.0 9.6
Depreciation €m 6.2 6.4 6.9 8.2 8.5
31/12/16 31/12/17 31/12/18 31/12/19 31/12/20
Employees No. 1,093 1,137 1,119 1,106 1,089
Balance sheet total3 €m 239.4 224.9 221.8 214.6 230.0
Equity €m 104.6 98.5 101.8 96.2 100.4
Equity ratio % 43.7 43.8 45.9 44.8 43.7
Liquidity €m 69.5 57.2 50.9 50.3 38.8
1 Scrip issue in June 2017, 2013 – 2016 adjusted
2 2020: Proposal to the AGM
3 Not including repurchased treasury shares
Analyst meeting March 2021 33Annex
Experienced Management
Henner Rinsche Igor Iraeta Munduate Marco Keul
CEO + CFO COO Vice President Finance
Previous experience Previous experience Previous experience
• President Europe at • Many years of experience • Responsible for Finance, Controlling,
SodaStream as CTO at Igus GmbH and Stoba IT/Business processes and internal
• Various leading positions at Präzisionstechnik Sales services since 1 April 2020
Procter & Gamble, PepsiCo, • Various technical management • 2012 – 2020 Head of Controlling at
Danone and Henkel positions at Robert Bosch GmbH Leifheit AG
Core competencies Core competencies Core competencies
• General management and • Digitalization, IoT, Industry 4.0, • IT, Finance & Controlling
consumer goods marketing implementation of lean production
systems, agile “Scrum” methods
Analyst meeting March 2021 34Annex
Committed to shareholder returns
Long-term dividend development Dividend yield 1,2
Dividend per share / in € 2020: 2.4% 2016: 5.1%
2019: 2.3% 2015: 5.6%
2018: 5.9% 2014: 3.9%
2017: 3.8% 2013: 5.3%
1,50
Dividend for 2020: 1.05 €2
1,00
0,50
0,00
1984
1985
1986
1987
1988
1989
1990
1991
1992
1993
1994
1995
1996
1997
1998
1999
2000
2001
2002
2003
2004
2005
2006
2007
2008
2009
2010
2011
2012
2013
2014
2015
2016
2017
2018
2019
2020
Bonus/special dividend Dividend
1 Based on the particular closing price at year-end
2 Dividend 2020: proposal to the AGM
Analyst meeting March 2021 35Annex
Leifheit awards (selection)
Floor wiper
Profi micro duo
Rotary dryers
Laundry dryers
Linomatic
Pegasus
Cordless vaccum wiper
Regulus Aqua PowerVac
CLEAN TWIST
Disc Mop Ergo
Window vaccum Window vaccum
CLEAN TWIST cleaner Nemo cleaners
M Ergo
Salad spinner Cordless vaccum
Isolating jug Isolating mugs
Comport Line Regulus PowerVac 2in1 Steam Mop CleanTenso
Columbus Flip 600 + 350 ml
Analyst meeting March 2021 36Annex
Soehnle awards (selection)
Kitchen Scales Personal Scales Air Humidifier
Page Profi + Page Profi 300 Style Sense Compact 300 + Safe 300 Airfresh Hygro 500
Air Purifier
Body analysis scales Blood pressure monitors AirFresh Clean 300
Shape Sense Connect 100 + 200 Systo Monitor 200 + 300 and Clean Connect 500
Analyst meeting March 2021 37Annex
Leifheit – more than 60 years of passion for housework
2010
1984 • Sale of the business unit ‘bathroom’
• IPO of Leifheit AG including the brands Spirella, Kleine
Wolke and Meusch
1988
2008
• License agreement for
• Takeover of 60% of
Dr Oetker Bakeware
Herby/F
• Acquisition of Spirella and
Kleine Wolke (bathroom furnishings and - 2006
accessories) • Takeover of the remaining shares of
1959 2001 Birambeau/F
• Foundation • Takeover of
Soehnle Group
1960 1970 1980 1990 2000 2010 2020
1972 1995 2010
• Takeover of Leifheit by ITT • Start of the new production • Takeover of the remaining shares of
(U.S.) plant in Blatná/CZ Herby/F
2012
1970
• Termination of the license
• Annual production of carpet 1998 agreement with Dr Oetker
sweepers reaches 2 m units, • Takeover of 34.6% of Bakeware
Leifheit becomes European the shares of
market leader Birambeau/F 2017
• Capital increase from
company funds
2019
• New Strategy “Scaling up
Success
Analyst meeting March 2021 38Annex
European competitors by category
Cleaning Laundry care
Spontex Brabantia
Vileda Artweger
Rival
Tonkita Swiffer Juwel
Wenko Gimi Stewi
Vileda Metaltex Rörets
Kärcher Blome
Kitchen goods Wellbeing
Tescoma WMF Gefu Bosch Laica
Tanita
Zyliss Rösle
Oxo Lurch ADE Homedics
Fackelmann
Sanitas Beurer
Brabantia Westmark Withings
Emsa Tefal Terraillon
Analyst meeting March 2021 39Annex
Significant free float and international investors
Shareholder structure
February 2021
• Joachim Loh, Haiger (GER),
10.31%
10.31%
• MKV Verwaltungs GmbH, Grünwald (GER),
10.03%
10.03%
• Leifheit AG Nassau (GER), treasury shares, 4.87%
4.87%
• Alantra EQMC Asset Management, SGIIC, SA, Madrid (ES),
47.73% 10.44%
• Teslin Capital Management BV/Gerlin NV, Maarsbergen (NL),
10.44% 5.05%
5.05%
• MainFirst SICAV, Senningerberg (LUX),
5.02%
3.03% 5.02%
• Blackmoor Ownership Holdings Master Limited, London (UK),
3.52% 3.52%
• The Capital Group Companies, Inc., Los Angeles (USA), 3,03%
Non free float shareholders1 25.21% • Voting rights under notification threshold: 47.73%
3.03%
Free float1,2 74.79%
1 Definition of German stock exchange for indices
2 Including shareholdings of the management board
Analyst meeting March 2021 40Annex
Financial calendar and contact
Dates 2021 Contact
11 May 2021 Corporate Communications / Investor Relations
Quarterly statement for the period
ending 31 March 2021
Phone: +49 2604 977-218
2 Jun 2021
Annual General Meeting Email: ir@leifheit.com
11 Aug 2021
Financial report for the first half-year
www.leifheit-group.com
endeing 30 June 2021
11 Nov 2021
Quarterly statement for the period
ending 30 September 2021
Analyst meeting March 2021 41Annex
Leifheit is frequently top company in home appliances
and household goods categories
Most Valuable Germany‘s Most Sought-after Highest Level Germany‘s Best
Company Products & Services of Trust Customer Hotline
Sep 2020 Jan 2020 Oct 2020 Aug 2020
Deutschland Test / Focus Money IMWF Institut / FAZ-Institut Deutschland Test / Focus Money IMWF Institut / FAZ-Institut
1 2 1 1
1st place 2nd place 1st place 5th place 1st place
Home appliances Household items Household items Home appliances
100.0 points 99.5 points 100.0 / 86.2 points 100.0 points
Study examines what companies Study looks at customer Study analyses social listening
Study analyses social listening
do for their employees and statements for 17,000 brands from data for over 20,000 companies
data in 438 million online
society. Among other things, the 280 industries regarding reliability, in the categories customer
sources for over 20,000
sustainability reports of the quality, trust and recommendations service and satisfaction, hotline,
companies. Relevant criteria
largest German companies were in 438 million online sources and price and service. 438 million
include quality, customer
evaluated according to the GRI thus makes a comprehensive online outlets serve as a
satisfaction and value for money.
standard. assessment of customers’ trust in source.
companies.
Analyst meeting March 2021 42Aktiengesellschaft Postfach 11 65 D-56377 Nassau
You can also read