LANXESS - Credit Suisse Chemical & Agriculture, Packaging & Cement Conference - Earnings back on high previous year level

Page created by Stanley Jimenez
 
CONTINUE READING
LANXESS - Credit Suisse Chemical & Agriculture, Packaging & Cement Conference - Earnings back on high previous year level
LANXESS – Credit Suisse Chemical & Agriculture,
Packaging & Cement Conference
Earnings back on high previous year level

Investor Relations, June 2nd, 2021
LANXESS - Credit Suisse Chemical & Agriculture, Packaging & Cement Conference - Earnings back on high previous year level
Safe harbor statement

The information included in this presentation is being provided for informational purposes only and does not constitute
an offer to sell, or a solicitation of an offer to purchase, securities of LANXESS AG. No public market exists for the
securities of LANXESS AG in the United States.

This presentation contains certain forward-looking statements, including assumptions, opinions, expectations and views
of the company or cited from third party sources. Various known and unknown risks, uncertainties and other factors
could cause the actual results, financial position, development or performance of LANXESS AG to differ materially from
the estimations expressed or implied herein. LANXESS AG does not guarantee that the assumptions underlying such
forward-looking statements are free from errors, nor does it accept any responsibility for the future accuracy of the
opinions expressed in this presentation or the actual occurrence of the forecast developments. No representation
or warranty (expressed or implied) is made as to, and no reliance should be placed on, any information, estimates,
targets and opinions contained herein, and no liability whatsoever is accepted as to any errors, omissions or
misstatements contained herein, and accordingly, no representative of LANXESS AG or any of its affiliated companies
or any of such person's officers, directors or employees accepts any liability whatsoever arising directly or indirectly
from the use of this document.

2
LANXESS - Credit Suisse Chemical & Agriculture, Packaging & Cement Conference - Earnings back on high previous year level
Agenda

    1   Executive summary Q1 2021

    2   Financial and business details Q1 2021

    3   Back-up

3
LANXESS - Credit Suisse Chemical & Agriculture, Packaging & Cement Conference - Earnings back on high previous year level
Q1 2021: Execution on strategy, solid earnings level

                        Q1 Highlights
    Strategic:
    ▪ Acquisition of Emerald Kalama Chemical signed
    ▪ Two bolt-on acquisitions closed in Consumer
      Protection segment
    ▪ Entry into battery chemistry business announced:
      electrolyte production for Tinci at BU SGO
    Financial:
    ▪ Volumes above previous year after unexpectedly
      strong March
    ▪ EBITDA pre on previous year level at €242 m,
      stable margin at 14.3%
    ▪ Several effects burden Q1’21: winter shutdowns (USA),
      energy & freight costs, raw material price increases, FX

4
LANXESS - Credit Suisse Chemical & Agriculture, Packaging & Cement Conference - Earnings back on high previous year level
ESG theme as a chance - LANXESS goes climate
neutral by 2040

       Our goal: Climate neutrality                                                     Three-pronged approach                                                       Ahead of EU regulation2

                                                                                 ▪ Reduction of N2O emissions and                                                                                        German
                                                                                                                                                                                                         industry
                                                                                   change to renewable energies                                                           Global
                                                                                                                                                                                                        trajectory
              -50%       -55%     -61%     -63%      -75%     -100%                                                                                                     trajectory

    6,500                                                                        ▪ CO2e balance as criteria for organic
                                                                                   growth and acquisitions                                                                                                   EU Industry
                                                                                                                                                              100%                                            based on
                                                                                                                                                                                                             Green Deal
                                                                                 ▪ Focus R&D activities on climate
             3,210
                         2,950
                                  2,533     2,400
                                                                                   neutral processes and technologies
                                                     1,600                                                                                                                                                      LANXESS

                                                              Neutral1

    2004     2018        2019     2020      2025     2030      2040                                                                                            0%

                                                                                                                                                                      1990    2004      2018     2030        2040    2050
    Emissions based on Scope 1 + Scope 2, numbers rounded,                                                                                                            Emissions based on Scope 1 + Scope 2
    in thousand tons CO2e

                                                             LANXESS is on track to achieve targets set for 2025

              1   Climate neutral: Less than 300,000 tons of CO2 equivalents per year. These will be reduced through compensation measures.
5             2   This is based on current legislation. There is a plan for a more ambitious 2045 Net-Zero Emission Goal to be approved by cabinet shortly.
LANXESS - Credit Suisse Chemical & Agriculture, Packaging & Cement Conference - Earnings back on high previous year level
LANXESS enhances its disclosures according to
SASB and TCFD reporting standards

    Mapping of KPIs to SASB1 standard                                     Reporting according to TCFD2 standard

    ▪ SASB with uniform reporting procedures for                          ▪ TCFD with recommendations for more effective
      sustainability KPIs to facilitate categorization and                  climate-related disclosures, in particular to report
      analysis                                                              information on climate-related opportunities and risks
    ▪ Growing importance globally after initial focus in US               ▪ Disclosure around four thematic areas: Governance,
                                                                            strategy, risk management and metrics and targets
    ▪ LANXESS publishes a SASB Index in accordance with
      Chemical Standard for environmental, social and                     ▪ LANXESS acknowledges the need for improved and
      governance issues                                                     increased reporting of climate-related financial
                                                                            information

                         LANXESS takes a proactive role in contributing to a better, sustainable future

         1 SASB   = Sustainability Accounting Standards Board
6        2 TCFD   = Task Force on Climate-related Financial Disclosures
LANXESS - Credit Suisse Chemical & Agriculture, Packaging & Cement Conference - Earnings back on high previous year level
Current outlook: Recovering demand in most end
markets, increasing raw material prices and FX burden

        Advanced Intermediates
        ▪ Increasing demand in all end markets, but energy prices burden
        ▪ Boom in construction in all regions, strong order book

        Specialty Additives
        ▪ Strong demand for automotive supports all BUs; aviation still weak
        ▪ Positive trends in key industries: Construction strong, oil & gas improving

        Consumer Protection
    §
        ▪ Disinfection, purification and biocides with good business momentum despite high comparable base
        ▪ Agro market rebounding

        Engineering Materials
        ▪ Strong auto recovery in all regions, Force Majeure of supplier burdens

7
LANXESS - Credit Suisse Chemical & Agriculture, Packaging & Cement Conference - Earnings back on high previous year level
LANXESS guidance raised –
recovery gains traction

                   Current view on economy
                   ▪ Ongoing recovery in most end markets:
                       ▪ Strong rebound in automotive, agro and construction
                       ▪ Aviation still weak, oil & gas gradually improving
                   ▪ Further soaring raw material prices trigger typical time lag for pass-
                     through

                   LANXESS outlook

                   ▪ Q2: EBITDA pre range of €240-280 m expected, despite burden of
                      ▪ Unplanned shutdowns at BU HPM (~€5-10 m)
                      ▪ Weak US Dollar
                   ▪ FY 2021 EBITDA pre expected €950-1,000 m

8
LANXESS - Credit Suisse Chemical & Agriculture, Packaging & Cement Conference - Earnings back on high previous year level
Agenda

    1    Executive summary Q1 2021

    2    Financial and business details Q1 2021

    3   Back-up

9
LANXESS - Credit Suisse Chemical & Agriculture, Packaging & Cement Conference - Earnings back on high previous year level
LANXESS Group: Results back on solid previous year
level

                                                                        [€ m]*         Q1/2020   Q1/2021     Δ     FY 2019    FY 2020      Δ

     Strong volume                                                      Sales           1,704      1,693    -1%      1,704      1,693    -1%
                                                                        EBITDA pre       245       242      -1%      245        1242     -1%
     growth, but FX
                                                                        Margin          14.4%     14.3%             14.4%      14.3%
     burdens                                                            CAPEX             74        70      -5%       74         70      -5%

                                                                         ▪ Stable sales driven by volumes but impacted by adverse FX effect
     Price Volume                 FX         Portfolio                     and lower price level compared to previous year
     -2%         +5% -4% +0%                                             ▪ Raw material prices still slightly below previous year but massive
                                                                           sequential upswing in Q1 2021
                                                                         ▪ EBITDA pre and margin on previous year level. Positive volume
                         Total -1%
                                                                           growth offset by time-lag in raw material price pass-through and
Q1 Sales vs. PY
                                                                           negative FX

       * All figures excluding BU LEA, which is reported as discontinued operation
10
Advanced Intermediates: Strong volume growth

                                                                       [€ m]*                        Q1/2020             Q1/2021                 Δ            FY 2019   FY 2020   Δ
                                                                       Sales                             483                 489               1%              483       489      1%
     Rising volumes,                                                   EBITDA pre                         82                  77              -6%               82        77      -6%
     prices lag behind                                                 Margin                          17.0%               15.7%                              17.0%     15.7%
                                                                       CAPEX                              23                  21              -9%               23        21      -9%

                                                                        ▪ Sales increase driven by significantly higher volumes in both BUs
     Price Volume                 FX         Portfolio                    mitigated by lower prices and negative FX effect
     -4%         +8% -3%                           0%                   ▪ Stable price level at BU IPG. BU AII with lower prices, significant
                                                                          increase in raw material prices not yet passed-through
                                                                        ▪ EBITDA pre and margin impacted by price pass-through delay,
                         Total +1%
                                                                          higher energy costs and negative FX
Q1 Sales vs. PY

       * New reporting structure as of Q1 2021: “Antioxidants and Accelerators” (AXX) business shift from BU AII to BU RCH (segment “Specialty Additives”);
11       2020 figures restated
Specialty Additives: Results impacted by weather-
                related shutdowns and negative FX development

                                                                       [€ m]*                       Q1/2020              Q1/2021                Δ           FY 2019      FY 2020    Δ
                                                                       Sales                             574                 517             -10%                  574    517      -10%
                                                                       EBITDA pre                         91                  74             -19%                  91      74      -19%
     Shutdowns burden
                                                                       Margin                          15.9%               14.3%                              15.9%      14.3%
                                                                       CAPEX                              20                  16             -20%                  20      16      -20%

                                                                        ▪ Sales decline due to lower volumes and negative FX effects,
     Price Volume                 FX         Portfolio                    compared to still strong previous year level
      0%           -4% -5%                         0%                   ▪ Weather-related shutdowns in the US and still weak demand from
                                                                          aviation led to lower volumes in BU PLA and LAB, while BU RCH
                                                                          benefits from auto recovery
                         Total -10%
                                                                        ▪ EBITDA pre and margin impacted by weather-related shutdowns,
Q1 Sales vs. PY
                                                                          higher freight costs and adverse FX effect; shift of AXX dilutes margin

       * New reporting structure as of Q1 2021: Business Line “Antioxidants and Accelerators” (AXX) shift from BU AII to BU RCH (segment “Specialty Additives”);
12     2020 figures restated
Consumer Protection: Outperforming high
      §
            comparable base

                                     [€ m]        Q1/2020    Q1/2021    Δ     FY 2019    FY 2020     Δ
                                     Sales           279       290     4%       279        290      4%
     Ongoing growth                  EBITDA pre      67        69      3%        67      § 69       3%
     and strong margins              Margin         24.0%     23.8%            24.0%      23.8%
                                     CAPEX           10        13      30%       10        13      30%

                                     ▪ Considerable sales increase driven by strong volumes, partly offset
     Price Volume   FX   Portfolio     by negative pricing and FX
     -3% +10% -3%           0%       ▪ Ongoing strong demand for disinfectants and biocides, volume uptick
                                       inflated by IFRS 15
                                     ▪ Improved EBITDA pre due to higher volumes despite weather-related
                  Total +4%
                                       shutdown in US (BU MPP); lower prices and FX weigh on result
Q1 Sales vs. PY
                                     ▪ Acquisitions in BU MPP contribute nicely

13
Engineering Materials: Automotive recovery
            drives strong earnings

                                     [€ m]         Q1/2020    Q1/2021     Δ     FY 2019    FY 2020      Δ
                                     Sales           347        377      9%       347        377       9%
     Strong margin                   EBITDA pre       49        59       20%       49         59      20%
     improvement                     Margin         14.1%      15.6%             14.1%      15.6%
                                     CAPEX            8         10       25%       8          10      25%

                                     ▪ Rise in sales due to strong demand from auto industry, partly offset by
     Price Volume   FX   Portfolio     negative FX
      0% +13% -4%           0%       ▪ Prices recovered to previous year level after massive decline during
                                       2020
                                     ▪ EBITDA pre and margin increase driven by improved volumes,
                  Total +9%
                                       offsetting higher energy and freight costs as well as FX
Q1 Sales vs. PY

14
P&L Q1: Profitability on previous year level,
unexpectedly strong March

                                                                                        ▪ Increase in selling expenses
[€ m]*                                 Q1/2020            Q1/2021            yoy in %
                                                                                          reflects higher freight costs,
Sales                                    1,704 (100%)       1,693 (100%)         -1%      partly mitigated by lower travel
                                                                                          expenses
Cost of sales                           -1,269 (-74%)      -1,266 (-75%)         0%
                                                                                        ▪ Stable earnings, margins and
Selling                                   -202 (-12%)        -208 (-12%)         -3%      EPS due to recovering
G&A                                        -74   (-4%)        -73   (-4%)        1%       demand despite weather-
R&D                                        -26   (-2%)        -27   (-2%)        -4%      related shutdowns, higher
                                                                                          energy prices and negative FX
EBIT                                      104     (6%)        98     (6%)        -6%
                                                                                          development
Net Income                                 64     (4%)        64     (4%)         0%
EPS pre                                   1.17               1.17                 0%
EBITDA                                    219    (13%)       215    (13%)        -2%
   thereof except.                        -26     (-2%)      -27     (-2%)       -4%
EBITDA pre except.                        245 (14.4%)        242 (14.3%)         -1%

        * From continuing operations
15
Q1 2021: Results supported by Consumer
Protection and Engineering Materials

     Sales [€ m]                                          Advanced              Specialty         EBITDA pre [€ m]
                                                        Intermediates           Additives
                         -1%                                                                                     -1%
                                                                              RCH       LAB
        1,704*                           1,693*         IPG                                               245             242
                                                                        AII
         483                 +1%            489                                                           82      -6%
AI                                                                                                AI                      77
                                                                              PLA

         574               -10%             517                                                           91     -19%     74
SA                                                                                                SA
                                                          Consumer            Engineering
                                                          Protection           Materials
CP       279                +4%             290                                                   CP              +3%     69
                                                                              URE                         67
                                                        LPT
EM       347                 +9%            377                                                   EM
                                                                       SGO
                                                                                                          49     +20%     59
                                                                                            HPM
       Q1 2020                         Q1 2021                                                    Recon   -44             -37
                                                         MPP
                                                                                                       Q1 2020          Q1 2021
         * Total group sales including reconciliation
16
Q1 2021: Asia leading the recovery, America and EMEA
compare with solid previous year base

     Q1 2021 sales by region [%]                                                     Regional development of sales [€ m]
                                                                                     1,704                 1,693            Operational
                                                                                                                           development*
                                               Asia/                                  359
 Americas                                                         Asia/Pacific                  +7%        386
                                               Pacific
                                                                                                                               +14%

                26                            23
                                                                    Americas          492       -8%        452                   0%

                                                   19                   EMEA          536        0%        535                  +1%
                                                                   (excl. Germany)

                     32
                                                        Germany
 EMEA
 (excl. Germany)                                                    Germany           317       +1%        320                  +1%

                                                                                     Q1 '20               Q1 '21

          * Currency and portfolio adjusted
17
Operating cash flow distorted by timing of various tax
payments among others

                                                                        ▪ Operating cashflow distorted due to
     [€ m]                                    Q1/2020   Q1/2021   Δ         ▪ Timing of income taxes paid
                                                                              (~€35 m) in 2021
     Operating cash flow*                        113        33    -80       ▪ Received VAT re-imbursement
                                                                              (~€20 m) in 2020
     Investing cash flow*                         -75      530    605

      thereof capex                               -74       -70   4     ▪ Change in investing cash flow driven
                                                                          by cash-in from money market funds
      thereof net proceeds from
                                                  -59      604    663
      money market funds

         * Applies to continuing operations
18
Rock solid balance sheet

     [€ m]                                                      31.12.2020               31.03.2021   ▪ Equity reflects positive net income,
                                                                                                        effects in pension provision and FX
     Total assets                                                          8,880             9,118
                                                                                                      ▪ Ongoing strong liquidity – increase in
     Equity                                                                2,999             3,330      net financial debt due to short-term
                                                                                                        investment in capital market
     Equity ratio                                                            34%               37%      instruments, shown as other short term
                                    1                                                                   assets
     Net financial debt                                                    1,012             1,223
                                                                                                      ▪ Lower pension provisions reflect
     Cash, cash equiv., short                                                                           interest increase
                                                                           1,794             1,588
     term money market inv.
                                                                                                      ▪ Seasonal increase in working capital
     Pension provisions                                                    1,205             1,016

     Net working capital                                                   1,134             1,307

     DSI (in days)2                                                                 64          60

     DSO (in days)3                                                                 45          47
          1 Including cash, cash equivalents, short-term money market investments
          2 Days sales of inventory calculated from quarterly sales
19
          3 Days of sales outstanding calculated from quarterly sales
Agenda

     1   Executive summary Q1 2021

     2   Financial and business details Q1 2021

     3   Back-up

20
Housekeeping items 2021

                Capex 2021     ~€450-500 m
       Operational D&A 2021    ~€450 m
         Reconciliation 2021   ~€150-160 m including remnant costs and re-occurring expenses
         Underlying tax rate   ~28%
          Exceptionals 2021    €70-100 m based on current initiatives
              FX sensitivity   One cent change of USD/EUR resulting in ~€7 m EBITDA pre
                               impact before hedging
             Remnant costs     2021: Additional remnant costs of ~€5 m (50% of organic
                               leather business due to expected closing mid 2021)
                               2022: Additional remnant costs of ~€5 m (impact of organic
                               leather business fully effective)

21
Key Figures*: Back on previous year level

     Q1        Q2             Q3            Q4

                  €1,693 m                                                 €33m                     €1,588 m
                  Sales                                                    Operating Cash           Cash & cash equivalents, short
      -1%                                                                  Flow                     term money market investments

          €                                                      %
                  €242 m                                                   14.3%                    €1,223 m
                  EBITDA pre                                               EBITDA pre               Net financial debt
      -1%                                                                  Margin

                  €1.17                                                    €70 m
                  EPS pre                                                  CAPEX
      +0%

          * Continuing operations (excluding BU LEA, which is reported as discontinued operation)
22
Exceptional items (on EBIT) on previous year level,
reflecting mainly costs for M&A projects

     [€ m]                             Q1/2020             Q1/2021
                                           Thereof             Thereof
                                 Excep.              Excep.                           Comments
                                            D&A                 D&A

         Strategic Realignment
                                  18             0     2             0   incl. adjustment of production network
         & Restructuring
         M&A, Digitalization                                             incl. Emerald Kalama acquisition and
         (incl. Chemondis) and     3             0    18             0      bolt-on acquistions in Consumer
         Others                                                                        Protection

         Strategic IT projects     5             0     7             0          incl. SAP Hana Project

         Total                    26             0    27             0

23
Maturity profile actively managed and well balanced

     Long-term financing secured                                              Liquidity and maturity profile as per March 2021

     ▪ Diversified financing sources                                         [€ m]

       − Bonds & private placements                                           1500

       − Undrawn sustainable revolving
                                                                                            Bond                 Bond            Hybrid                           Bond       Bond                      Hybrid
                                                                              1000          2021                 2022            1st call*                        2025        2026                      2076*

         credit facility                                                       500
                                                                                           0.250%               2.625%            4.50%                          1.125%      1.00%       Private
                                                                                                                                                                                       placement
                                                                                                                                                                                                       4.50%

                                                                                                                                                                                      3.95% (2027)
     ▪ Average interest rate of financial                                         0
                                                                                         Cash & cash             Private
       liabilities ~2%                                                        -500
                                                                                         equivalents,          placement
                                                                                          Near cash           3.50% (2022)

     ▪ Next bond maturity in October                                         -1000
                                                                                           assets

                                                                                                                                               Sustainable
                                                                                                                                             revolving credit
     ▪ All group financing executed                                          -1500
                                                                                                                                                 facility
                                                                                                                                                 €1.0 bn
       without financial covenants                                           -2000

                                                                             -2500
                                                                                            2021                 2022            2023            2024            2025        2026         2027         2028+

                                                                                                                                                  Cash & cash equivalents,           Credit facility
                                                                                                         Financial liabilities
                                                                                                                                                  Near cash assets

24        * Hybrid bond with contractual maturity date in 2076 has a first optional call date in 2023.
On the growth track: Three highly complementary
acquisitions strengthen LANXESS specialty character

                                            Leading Consumer Protection player and strategic
                                            expansion into growth markets Food & Animal Nutrition
                        Sales: ~425m $      Second largest acquisition: 100% complementary fit,
                             USA            attractive synergy potential and straight forward integration

                                            Building a leading microbial solution player
                       Sales: ~€33 m €      Highly complementary in product portfolio and regional
                           France           set-up

                                            Niche Play: Specialty fungicides for the packaging
                                            industry
                       Sales: Mid single-   Further sustainable growth based on trend for replacement
                       digit € m, France    of plastic with antimicrobial paper packaging

25
EU market for battery chemicals to grow
to over EUR 10 billion by 2025
     Massive growth in demand                               Chemistry accounts for 2/3
     for battery cells in the EU                            of battery cell costs

                                                                        Warranty
                                                             Administration
                                                                  R&D
                                     >250 GWh                                            Cathode
                                                             Energy
                                                             Labor

                                                                                           Anode
                                                             D&A
                                                                                       Electrolyte
        40 GWh                                                         Other       Separator
                                                                      materials

           2020                           2025

26       Sources: Avicenne Energy, 2019; own calculations
LANXESS starts electrolyte production for Li-Ion
batteries in cooperation with market leader TINCI
     Partnership with TINCI                  TINCI with leading position in fragmented electrolyte market*

      ▪ TINCI (Chinese Guangzhou Tinci                    15%            TINCI
        Materials): a leading manufacturer                               Zhangjiagang Guotai-Huarong
        for battery materials and the              40%          14%      Capchem
        largest electrolyte producer                                     Jinniu
                                                              14%        Mitsubishi
        worldwide                                                        Others
                                                      8% 9%
      ▪ Saltigo starts electrolyte
        production for TINCI in its high-      Raw materials*         LiPF6              Electrolyte   Cell manufacturers
        tech plant in Leverkusen
        (Germany) early 2022
                                                                                             >

                                             Local raw material supply is key for cell manufacturers and OEMs
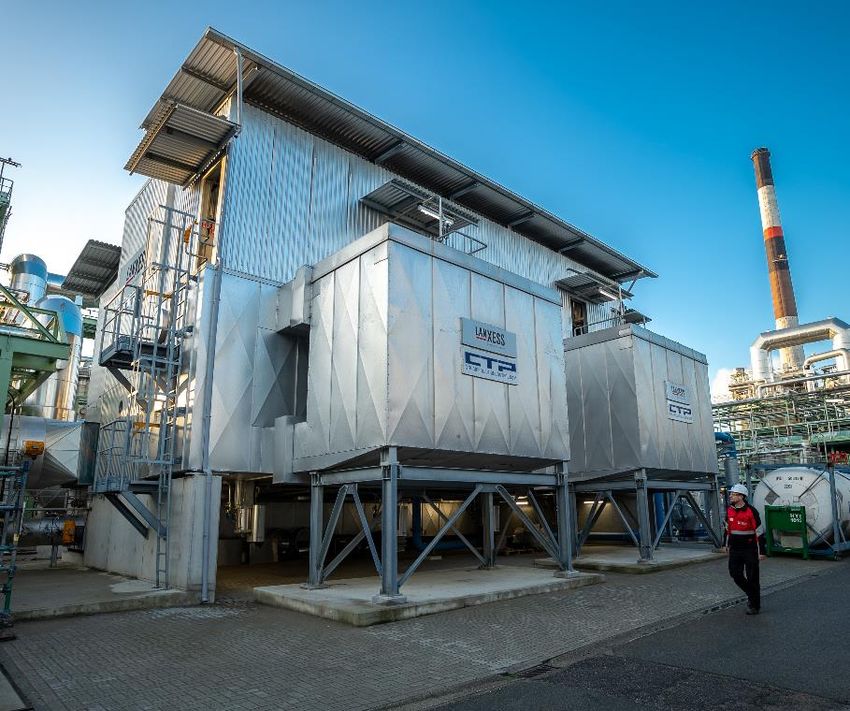
27
On track to climate neutrality in 2040:
Nitrous oxide reduction in Antwerp
                                    Milestone in our climate strategy

                                    ▪ Nitrous oxide is generated during
                                      caprolactam production
                                    ▪ Investment of approx. EUR 10 million

                                   1 ▪ Plant significantly reduces emissions:   ✓
                                       150 kt CO2e / year less

                                       ▪ Second plant planned for 2023
                                   2
                                       ▪ Impact: 300 kt CO2e / year less

28
Upcoming virtual events 2021 -
Proactive capital market communication
                              2   Credit Suisse Chemicals & Agriculture Conference
                                                                                                      14 Berenberg Food Ingredients &
                              7   J.P. Morgan European Materials Conference                              Chemicals Conference
                              8   Exane BNP Paribas European CEO Conference                        21-22 Berenberg and Goldman Sachs
                          16-17   Deutsche Bank dbAccess Berlin Conference                               Tenth German Corporate
                                                                                                         Conference
                             23   Deutsche Bank Issuer & Investor Bond Forum 2021
                                                                                                   21-23 Baader Investment Conference
                             28   Morgan Stanley Cannon Ball Run Field Trip
                             29   CEO Sustainability Meeting

          May                           Jun                        Jul                       Aug                       Sep

     12 Q1 2021 Results                                                          11 Q2 2021 Results
     19 Annual Stockholders' Meeting                                             31 Commerzbank Corporate Conference
     20 Berenberg Conference USA
     20 Citi´s European Chemicals Conference
     26 UBS Best of Europe Conference
     27 Societe Generale Nice Conference 2021

29
Contact details Investor Relations

           Oliver Stratmann                        André Simon
           Head of Treasury & Investor Relations
                                                   Head of Investor Relations
           Tel.: +49 221 8885 9611
                                                   Tel.: +49 221 8885 3494
           Fax.: +49 221 8885 5400
                                                   Mobile: +49 175 302 3494
           Mobile: +49 175 304 9611
                                                   Email: Andre.Simon@lanxess.com
           Email: Oliver.Stratmann@lanxess.com

           Mirjam Reetz                            Eva Frerker
           Retail Investors                        Institutional Investors / Analysts

           Tel.: +49 221 8885 1272                 Tel.: +49 221 8885 5249
           Mobile: +49 151 7461 3158               Mobile: +49 151 7461 2969
           Email: Mirjam.Reetz@lanxess.com         Email: Eva.Frerker@lanxess.com

           Lisa Häckel                             Jens Ussler
           Investor Relations Assistent            Institutional Investors / Analysts

           Tel.: +49 221 8885 9834                 Tel.: +49 221 8885 7344
           Mobile: +49 151 7461 4637               Mobile: +49 151 7461 2913
           Email: Lisa.Haeckel@lanxess.com         Email: Jens.Ussler@lanxess.com

                                                                                        Visit the IR
                                                                                           website

30
Abbreviations

                                                §
           Advanced Intermediates                     Consumer Protection

                                                LPT    Liquid Purification Technologies
     AII    Advanced Industrial Intermediates
                                                MPP    Material Protection Products
     IPG    Inorganic Pigments
                                                SGO    Saltigo

           Specialty Additives                        Engineering Materials

     LAB    Lubricant Additives Business
                                                HPM    High Performance Materials
     PLA    Polymer Additives
                                                URE    Urethane Systems
     RCH    Rhein Chemie

31
You can also read