Half Year Report 2019 - Steel & Tube
←
→
Page content transcription
If your browser does not render page correctly, please read the page content below
Half Year Report 2019
Steel & Tube is…
                     One of New Zealand’s leading
                  providers of steel solutions, and a
                  proud New Zealand company, with
                    over 65 years of trading history

                     We offer New Zealand’s most
                     comprehensive range of steel
                    products, services and solutions

                      Our stable of best-in-class
                      businesses are some of this
                    country’s leading steel suppliers

STEEL & TUBE HALF YEAR REPORT 2019
On behalf of the Board and management of
                              Steel & Tube Holdings Limited, we are pleased
58,000 PRODUCT LINES          to present the FY19 Interim Report for the six
                              months to 31 December 2018.
A nationwide footprint with
40 SITES from Whangarei
to Invercargill

SOLUTIONS DRIVEN
organisation with more        Susan Paterson         Mark Malpass
                              Chair                  Chief Executive Officer
than 65 years of industry
experience

Working with more than         Contents
15,000 ACTIVE
                               02 Half Year Key Events
CUSTOMERS
every year                     03 Half Year Financial Snapshot
                               04 Half Year Financial Summary
~$500 MILLION                  05 Chair and CEO Review
in annualised sales
                               08 Measuring Our Performance
~1,000 PEOPLE                  10 Interim Financial Statements
in the Steel & Tube team       15 Notes to the Interim Financial Statements
                               23 Independent Review Report
HALF YEAR KEY EVENTS
     Continued to implement                  Court decision received
     ‘Project Strive’ business               on steel mesh case which is
     transformation initiatives              currently being appealed by
     with benefits now being                 both Steel & Tube and the
     seen                                    Commerce Commission

     Completed $80.9m                        Strengthened the
     capital raising resulting               Leadership team with
     in significant reduction                appointment of new
     in debt, with further                   GM People & Culture,
     reductions post the capital             GM Strategy and
     raise                                   Chief Digital Officer

     AX ERP system now                       Group-wide update to
     settled in and providing                ISO 9001:2015 quality
     key insights into the                   certification and initiation of
     business and supporting                 independent third-party steel
     customer service                        mill audits

     Refinanced banking                      Continuing improvement in
     facilities                              health and safety (TRIFR*
                                             down 40% on 1H18)
     Responded to non-binding
     indicative offer from                   Ongoing exit from
     Fletcher Building to                    S&T Plastics
     acquire the company
                                           * TRIFR: Total Recordable Injury Frequency Rate is a
                                             key metric for Steel & Tube and is the number of
                                             fatalities, lost time injuries, substitute work, and
                                             other injuries requiring treatment by a medical
                                             professional per million hours worked.

02    STEEL & TUBE HALF YEAR REPORT 2019
HALF YEAR FINANCIAL SNAPSHOT
REVENUE            EARNINGS BEFORE

    258.2m
                   INTEREST AND TAX (EBIT)
$
                   $   9.8m
NORMALISED EBIT    NET PROFIT AFTER TAX

    9.7m
                   (NPAT)
$
                   $   5.6m
NET DEBT           NET OPERATING CASHFLOW
$   16.0m          $   11.1m
INTERIM DIVIDEND

3.5cps

                                             03 03
HALF YEAR FINANCIAL SUMMARY
FY18 FY19
$millions 1H18 2H18 1H19
Revenue 267.9 227.9 258.2
Normalised Revenue¹ 249.3 224.2 258.2
EBIT¹ 7.5 (43.7) 9.8
Normalised EBIT² 13.4 4.5 9.7
NPAT 3.8 (35.9) 5.6
Assets 363.9 345.5 329.9
Net Debt 95.6 104.4 16.0
Net Operating Cashflow 17.7 (16.4) 11.1
• 1H19 EBIT in line with previous earnings guidance of ~40% of full year earnings target
• Significant improvement over the preceding six-month period (2H18) primarily driven
by sales and volume improvement as well as reduced operating expenditure
• Reflects building momentum with benefits from Project Strive business transformation
initiatives being realised
• Profit up 47% on comparative first half year (1H18) to $5.6m and a significant
improvement on 2H18 which included non-trading costs and impairments
• Net debt reduced significantly to $16.0m due to capital raise, improved operating
cashflows and prudent capital expenditure
• Solid improvement in operating cashflows to $11.1m enabling a return to dividend
payments with the Board declaring an interim dividend of 3.5 cents per share
• Company has reaffirmed FY19 EBIT guidance of $25m
1 S&T announced it was exiting S&T Plastics in May 2018. S&T Plastics contributed revenue: 1H18 $18.6m,
2H18 $3.7m. EBIT 1H18 $1.2m, 2H18 $(12.4m).
2 EBIT is Earnings Before Interest and Tax. Normalised EBIT excludes non-trading adjustments including
write downs, impairments, business rationalisation and restructuring costs and a gain on sale of property,
as well as contributions from S&T Plastics which the company has exited. Details are reported in Steel &
Tube’s 1H19 results presentation and in the Non GAAP Reconciliation in the Notes to the Interim Financial
Statements.
04 STEEL & TUBE HALF YEAR REPORT 2019CHAIR AND CEO REVIEW
SUSAN PATERSON, CHAIR MARK MALPASS, CHIEF EXECUTIVE OFFICER
Steel & Tube has reported a We are pleased to report on the positive
progress we have been making as we
result in line with expectations, continue with the business turn-around
with a substantial improvement commenced in mid-2018.
over the preceding six-month Customer needs, improved product
availability and delivery performance have
period (2H18) following the been a big focus and we have improved
capital restructure and as sales, volumes and market share.
benefits from business A combination of competitive pressures and
product mix has impacted gross margins.
transformation initiatives are We are now seeing a turnaround in our
realised. The company has business performance.
reaffirmed its FY19 guidance of Multiple initiatives have been implemented
as part of our Strive business transformation
approximately $25m in earnings programme, and these have yielded
before interest and tax (EBIT). approximately $5m EBIT improvement
in 1H19.
A focus on cost management has seen a
pleasing reduction in a number of areas
and, excluding S&T Plastics, has led to a
3% decrease in operating expenses as a
function of sales compared to 2H18. The
05CHAIR AND CEO REVIEW (CONTINUED)
cost savings achieved have enabled the SIGNIFICANT HALF YEAR UPLIFT IN
business to absorb inflationary and wage FINANCIAL RESULTS
and salary cost increases and execute For the six months to 31 December 2018,
transformation initiatives whilst supporting Steel & Tube reported revenue of $258.2m,
increased sales activities, without increasing EBIT of $9.8m and a net profit after tax
overall operating expenditure. (NPAT) of $5.6m.
We now have a strong financial platform to Excluding S&T Plastics which the Company
progress with our strategy, with a significant announced it was exiting in 2H18, and
reduction in debt and refinanced banking non-trading adjustments, Normalised EBIT
facilities. We have a strong leadership team, of $9.7m was up 116% on 2H18 Normalised
with several new appointments made in EBIT of $4.5m, reflecting the positive turn
recent months, and we continue to put in around in ongoing business performance.
place best-practice quality initiatives such as As expected, Normalised EBIT was $3.7m
the independent audit of our steel suppliers lower compared to 1H18 ($13.4m) as the
and a group-wide update to ISO 9001: 2015 business continues its recovery from
quality certification. trading issues caused by the new ERP
Health & safety remains a core focus for all system implementation which went live in
our businesses and, while there is always October 2017.
room to improve, our injury rates continue The execution of business transformation
to reduce as we target a goal of zero-harm. initiatives is having a positive impact. Sales
and volumes have continued the upwards
While it has been a difficult period, we trajectory seen in the last twelve months,
now have a strong foundation with the on the back of a strong focus on customer
right strategy, people and systems in needs, improved product availability and
place to drive the business forward and delivery performance.
deliver earnings growth. We have a clear
focus on growth and shareholder value The market remains very competitive,
and it is pleasing to see the business is keeping pressure on gross margins which
now benefitting from the significant work have also been dampened by a shift in sales
undertaken in 1H19 to transform and mix in some businesses.
turnaround the organisation.
06 STEEL & TUBE HALF YEAR REPORT 2019The half year period also included The economic outlook for the various key
further work to leverage value from the market segments in which we operate
investment into the ERP IT platform, the remains positive and product pricing
capital restructure, further organisational remains firm. The Strive turnaround
restructuring and strengthening of the programme is gaining momentum,
Leadership Team. morale is strong, sales are up, we are
Net debt was $16.0m as at 31 December becoming more efficient and are better at
2018, due to the repayment of $78.9m of utilising shareholder funds. There remains
debt following the capital raising concluded work to be done but we are confident we
in September 2018, repayments from are on the right track.
improved operating cashflows, working We thank shareholders for their continued
capital improvements and prudent capital support.
expenditure. Steel & Tube’s debt facilities
were successfully refinanced in December
2018, ensuring the company has sufficient
liquidity to drive the business forward.
Operating cashflow improved to $11.1m. The
Directors remain confident in the company’s
Susan Paterson
turn-around strategy and, in line with
Chair
Steel & Tube’s capital policy and improving
performance, have declared a fully imputed
interim dividend of 3.5 cents per share.
Mark Malpass
CEO
07MEASURING OUR PERFORMANCE
Continuing improvement TRIFR down 40% on 1HFY18
in health and safety
Turn around in volumes Sales +15% and volumes
and sales with upward +20% vs 2HFY18¹
trend continuing Sales +3% and volumes
+11% vs 1HFY18¹
Reduction in operating Down 3% vs 2HFY18²
expenses as a percentage Down 1% vs 1HFY18²
of sales
Reduction in labour Benefits from FY18
expenses as a percentage restructuring and ERP system
of sales
Continuing optimisation of 48 properties down to 40
Steel & Tube’s national
network, retaining presence
whilst improving efficiency
Financial benefits from Approx. $5m EBIT
Strive initiatives improvement in 1HFY19
1 Excludes S&T Plastics
2 Operating expenses excluding Depreciation, Amortisation and Normalisation adjustments
as outlined in the Results Presentation.
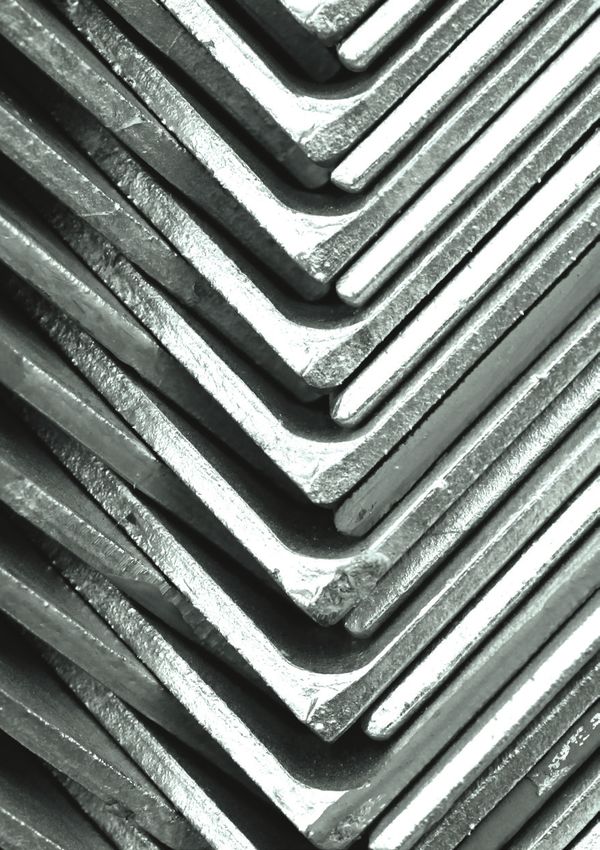
08 STEEL & TUBE HALF YEAR REPORT 20192018 MONTHLY SALES PERFORMANCE TREND LINE
The positive sales
%
+20 trajectory seen in
last 12 months is
+15%
continuing as the
Volume (Tonnes)
$m (Monthly)
company benefits
from the focus on
customer experience,
improving stock
availability and
delivery performance
Jan Feb Mar Apr May Jun Jul Aug Sep Oct Nov Dec
Sales Trend Volume Trend
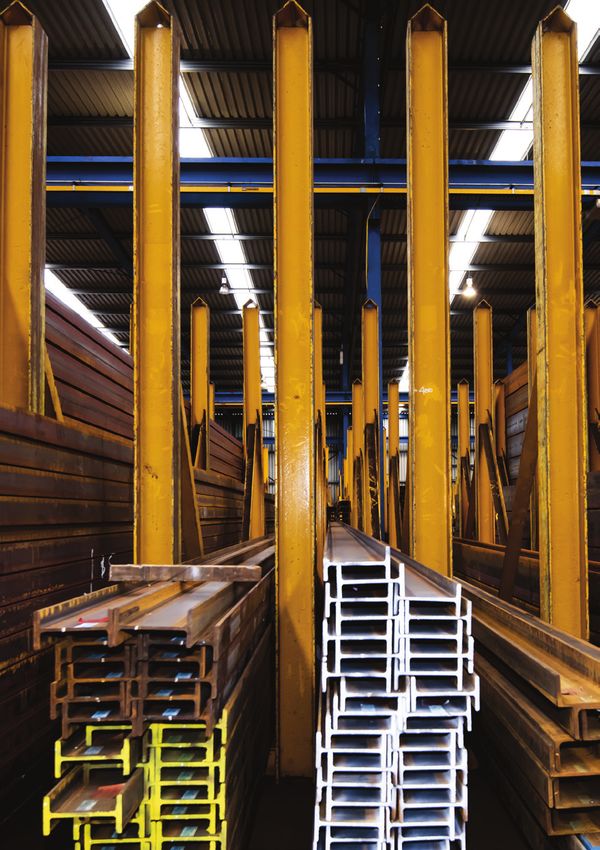
2018 OPEX/SALES PERFORMANCE TREND LINE
Focus on cost
management as well
as improving sales
has seen a pleasing
improvement in
operating costs as a
percentage of sales
Jan Feb Mar Apr May Jun Jul Aug Sep Oct Nov Dec
Opex/Sales (trend) Labour/Sales (trend) Non-labour/Sales (trend)
(All figures presented are Normalised and exclude S&T Plastics)
09 09INTERIM
FINANCIAL STATEMENTS
10 STEEL & TUBE HALF YEAR REPORT 2019
2018Statement Of Profit Or Loss And Other Comprehensive Income
INTERIM FINANCIAL STATEMENTS
FOR THE PERIOD ENDED 31 DECEMBER 2018
Unaudited Unaudited
December December
2018 2017
$000 $000
Sales revenue 258,234 267,852
Other operating income 799 76
Cost of sales (200,719) (206,563)
Operating expenses (48,889) (54,321)
Operating earnings before other gains and financing costs 9,425 7,044
Other gains 394 413
Earnings before interest and tax 9,819 7,457
Interest income 72 6
Interest expense (2,036) (2,190)
Profit before tax 7,855 5,273
Tax expense (2,254) (1,507)
Profit for the period attributable to owners of the Company 5,601 3,766
Items that may subsequently be reclassified to profit or loss
Other comprehensive (loss) / income - hedging reserve (753) 1,175
Items that may not subsequently be reclassified to profit or loss
Other comprehensive income - deferred tax on revaluation reserve - 1,878
Total comprehensive income 4,848 6,819
Basic earnings per share (cents) 4.0 4.2
Diluted earnings per share (cents) 4.0 4.2
The accompanying notes form part of these financial statements.
11 11Statement Of Changes In Equity
FOR THE PERIOD ENDED 31 DECEMBER 2018
Share-
Reval- based
Share Retained Hedging uation Treasury payments Total
capital earnings reserve Reserve shares Reserve equity
Notes $000 $000 $000 $000 $000 $000 $000
Balance at 1 July 2018 77,845 90,018 943 6,509 (2,896) 193 172,612
Impact of adoption of new 10 - (617) - - - - (617)
accounting standard (net of tax)
Restated total equity at the 77,845 89,401 943 6,509 (2,896) 193 171,995
beginning of the financial year
Comprehensive income
Profit after tax - 5,601 - - - - 5,601
Other comprehensive income
Hedging reserve (net of tax) - - (753) - - - (753)
Total comprehensive income - 5,601 (753) - - - 4,848
Transactions with owners
Issue of share capital 3 78,866 - - - - - 78,866
(net of issue costs)
Options vested during the period - - - - - 70 70
Unaudited balance at 156,711 95,002 190 6,509 (2,896) 263 255,779
31 December 2018
Balance at 1 July 2017 77,804 105,552 (1,193) 32,805 (3,431) 593 212,130
Comprehensive income
Profit after tax - 3,766 - - - - 3,766
Other comprehensive income
Hedging reserve (net of tax) - - 1,175 - - - 1,175
Deferred tax on asset sale - - - 1,878 - - 1,878
Total comprehensive income - 3,766 1,175 1,878 - - 6,819
Transfer on sale of property - 21,689 - (21,689) - - -
Transactions with owners
Dividends paid - (6,331) - - - - (6,331)
Proceeds from partly paid shares 41 - - - - - 41
Options vested during the period - - - - - 235 235
Unaudited balance at 77,845 124,676 (18) 12,994 (3,431) 828 212,894
31 December 2017
The accompanying notes form part of these financial statements.
12 STEEL & TUBE HALF YEAR REPORT 2019Balance Sheet
INTERIM FINANCIAL STATEMENTS
AS AT 31 DECEMBER 2018
Unaudited Audited
December 2018 June 2018
Notes $000 $000
Current assets
Cash and cash equivalents 7,994 5,584
Trade and other receivables 84,070 99,181
Inventories 123,806 116,047
Income tax refund - 5,165
Derivative financial instruments 408 1,271
Assets held for sale 5 874 1,639
217,152 228,887
Non-current assets
Property, plant and equipment 52,671 52,739
Intangibles 6 55,729 57,423
Deferred tax 4,328 6,488
112,728 116,650
Total assets 329,880 345,537
Current liabilities
Trade and other payables 42,820 49,867
Provisions 3,401 9,215
Derivative financial instruments 199 17
46,420 59,099
Non-current liabilities
Trade and other payables 2,051 2,108
Borrowings 4 24,000 109,935
Provisions 1,630 1,783
27,681 113,826
Equity
Share capital 3 156,711 77,845
Retained earnings 95,002 90,018
Other reserves 4,066 4,749
255,779 172,612
Total equity and liabilities 329,880 345,537
These financial statements and the accompanying notes were authorised by the Board
on 15 February 2019.
For the Board
Susan Paterson Anne Urlwin
Chair Director
The accompanying notes form part of these financial statements.
13 13Statement Of Cash Flows
FOR THE PERIOD ENDED 31 DECEMBER 2018
Unaudited Unaudited
December 2018 December 2017
$000 $000
Cash flows from operating activities
Customer receipts 274,579 272,794
Interest receipts 72 6
Payments to suppliers and employees (266,728) (249,741)
Income tax refunds / (payments) 5,603 (3,120)
Interest payments (2,436) (2,190)
Net cash inflow from operating activities 11,090 17,749
Cash flows from investing activities
Property, plant and equipment disposals 1,275 31,460
Property, plant and equipment and intangible asset purchases (2,886) (11,608)
Net cash (outflow) / inflow from investing activities (1,611) 19,852
Cash flows from financing activities
Issue of share capital (net of issue costs) 78,866 -
Proceeds from partly paid shares - 41
Borrowings (85,935) (36,681)
Dividends paid - (6,331)
Net cash outflow from financing activities (7,069) (42,971)
Net increase / (decrease) in cash and cash equivalents 2,410 (5,370)
Cash and cash equivalents at beginning of the period 5,584 6,517
Cash and cash equivalents at end of the period 7,994 1,147
Represented by:
Cash and cash equivalents 7,994 1,147
The accompanying notes form part of these financial statements.
14 STEEL & TUBE HALF YEAR REPORT 2019Notes To The Interim Financial Statements
FOR THE PERIOD ENDED 31 DECEMBER 2018
1. BASIS OF PREPARATION AND ACCOUNTING POLICIES
Steel & Tube Holdings Limited (the Company or Steel & Tube) is registered under the Companies Act 1993
and is a FMC Reporting Entity under the Financial Markets Conduct Act 2013. The Company is a limited
liability company incorporated and domiciled in New Zealand. The Group comprises Steel & Tube Holdings
Limited and its subsidiaries.
The Group’s principal activities relate to the distribution and processing of steel products, fastenings and
metal floor decking.
The registered office of the Company is Level 7, 25 Victoria Street, Petone, Lower Hutt 5012, New Zealand.
These financial statements have been reviewed, not audited, and were approved for issue on
15 February 2019.
These financial statements are presented in New Zealand dollars and rounded to the nearest thousand.
Basis of preparation
The Group is a for-profit entity. Its unaudited interim financial statements have been prepared in
accordance with, and comply with, New Zealand Generally Accepted Accounting Practice (NZ GAAP).
They comply with NZ IAS 34: Interim Financial Reporting and IAS 34: Interim Financial Reporting and the
NZX Main Board Listing Rules.
These financial statements do not include all the information required for an annual financial report and
consequently should be read in conjunction with the audited financial statements of the Group for the year
ended 30 June 2018.
These financial statements have been prepared using the same accounting policies and methods of
computation as the financial statements for the year ended 30 June 2018, with the exception of the
adoption of NZ IFRS 15 Revenue from Contracts with Customers (NZ IFRS 15) and NZ IFRS 9 Financial
Instruments (NZ IFRS 9).
The changes to the Group’s accounting policies resulting from the adoption of NZ IFRS 15 and NZ IFRS 9 are
outlined in note 10.
Prior Period Comparatives
The prior period balances have been reclassified to align with the presentation at 30 June 2018, as outlined
in the audited financial statements for the year ended 30 June 2018.
152. OPERATING SEGMENTS
The Group has reclassified the S&T Plastics business from the Infrastructure segment to Other/Elimination
column as the business and/or its assets are held for sale and are no longer contributing to the Group’s
trading EBIT. The comparative period has been adjusted to be consistent with the current presentation.
The segment information provided to the CODM (the Group’s Chief Operating Decision Maker) for the
period ended 31 December 2018 is as follows:
Other/ Reconciled
Distribution Infrastructure Elimination to Group
December 2018 $000 $000 $000 $000
Timing of revenue recognition
At a point in time 149,838 57,686 1,047 208,571
Over time - 49,663 - 49,663
Total revenue from external customers 149,838 107,349 1,047 258,234
Depreciation and amortisation (844) (1,192) (1,635) (3,671)
Segment EBIT 1,957 7,109 753 9,819
Interest (net) (1,964)
Reconciled to Group Profit Before Tax 7,855
Total assets 166,148 104,850 58,882 329,880
Total liabilities 20,376 19,167 34,558 74,101
Other/ Reconciled
Distribution Infrastructure Elimination to Group
December 2017 $000 $000 $000 $000
Revenue from external customers 155,852 93,432 18,568 267,852
Depreciation and amortisation (991) (1,386) (2,067) (4,444)
Segment EBIT* (527) 7,805 179 7,457
Interest (net) (2,184)
Reconciled to Group Profit Before Tax 5,273
Total assets 179,499 102,925 81,492 363,916
Total liabilities 14,401 26,189 110,432 151,022
* The results for the half year ended 31 December 2017 include a total of $7.7m non-trading adjustments
for impairment of inventory, rationalisation and restructuring costs and a gain on sale of property.
16 STEEL & TUBE HALF YEAR REPORT 20193. ISSUE OF SHARE CAPITAL
The Group concluded a placement and pro rata rights offer capital raise in August 2018, issuing an
additional 75,364,514 shares, with net proceeds of $78.9m being received. The capital raise comprised
an upfront placement of $20.8m to eligible institutional investors and a pro-rata rights offer to eligible
shareholders for $60.1m. Both the upfront placement and pro-rata rights offer were fully subscribed.
Incremental directly attributable issue costs of $2.0m were incurred and have been netted off against the
proceeds of the capital raising.
4. BORROWINGS
The Group successfully refinanced its banking facilities in December 2018 on terms and conditions
commercially acceptable to the Group. The Group now has syndicated committed bank borrowing
facilities of $70m, comprising a $25m Working Capital facility with a maturity date of 30 November 2019 (31
December 2018: $nil drawn), and a $45m Revolving Facility with a maturity date of 30 November 2021
(31 December 2018: $24m drawn). The Working Capital facility is expected to be renewed on an annual
basis. The previous bank borrowing facilities were repaid and cancelled during December 2018.
5. ASSETS HELD FOR SALE
As at 31 December 2018, the S&T Plastics business and/or its assets continue to be marketed for sale. The
property, plant and equipment related to S&T Plastics has a residual fair value less costs to sell of $0.9m
as at 31 December 2018 and is presented as held for sale. For the period ended 31 December 2017, S&T
Plastics contributed Sales revenue of $18.6m, less Cost of sales of $14.9m and Operating expenses of $2.5m,
resulting in EBIT contribution of $1.2m.
6. IMPAIRMENT TESTING AND INTANGIBLES
Included in Intangibles is $37.1m of Goodwill. NZ IAS 36 Impairment of Assets requires the Group to
regularly assess for any indicators of impairment and test the recoverable amount of goodwill against its
carrying value at least annually. As at 31 December 2018 the Group identified an indicator of impairment
and, as part of preparing these interim financial statements, undertook an internal valuation to assess the
carrying value of the Group’s assets including Goodwill. Based on the calculations completed, there is no
impairment at a Group level as at 31 December 2018.
As at 31 December 2018 the recoverable amount of the Group’s cash generating units (CGU’s) exceeded
their carrying values and there is no impairment of Goodwill. The forecast cash flows used to assess for
impairment were based on the latest Group forecast.
7. RELATED PARTIES
The Company has related party relationships with its subsidiaries and with key management personnel.
There have been no material changes in the nature or amount of related party transactions for the Group
since 30 June 2018.
8. LITIGATION
In December 2016 the Commerce Commission (the Commission) announced that it had completed its
investigation in relation to several steel companies, and that it intended to prosecute multiple companies
under the Fair Trading Act, including Steel & Tube. The Commission’s prosecution of Steel & Tube related
to the inadvertent use of a testing laboratories logo on test certificates, and application of testing
methodologies.
17In October 2018 the Auckland District Court imposed a fine of $1.885m. Both Steel & Tube and the
Commission have appealed the decision. A date for the appeal has been set for March 2019.
A provision for fines, penalties, costs and expected recoveries in relation to this prosecution has been
provided for in the Group’s financial statements at 31 December 2018.
9. SUBSEQUENT EVENTS
On 15 February 2019 the Board declared a fully-imputed dividend of 3.5 cents per share ($5.8m) and a
supplementary dividend to non-resident shareholders of 0.62 cents per share. The dividends will be paid to
shareholders on 29 March 2019.
10. CHANGES IN ACCOUNTING POLICIES AND DISCLOSURES
NZ IFRS 9 Financial Instruments – impact of adoption
Changes in accounting policies
The group has adopted NZ IFRS 9 from 1 July 2018 which has resulted in changes in accounting policies and
adjustments to the amounts recognised in the financial statements.
The Group has applied NZ IFRS 9 retrospectively, but has elected not to restate comparative information.
Classification
NZ IFRS 9 impacts the classifications of the following financial assets:
• Cash and cash equivalents
• Trade receivables
• Other receivables
Until 30 June 2018, the Group classified its financial assets as loans and receivables under NZ IAS 39.
From 1 July 2018, the Group classifies its financial assets as being measured at amortised cost.
There is no change in the measurement of the financial assets as a result of the reclassification.
The Group continues to apply NZ IAS 39 in respect to cash flow hedge accounting for forward exchange
contracts.
Impairment
From 1 July 2018, the Group assesses on a forward looking basis the expected credit losses associated with
its financial assets carried at amortised cost. The impairment methodology applied depends on whether
there has been a significant increase in credit risk.
The expected credit loss (ECL) allowances for financial assets are based on assumptions about the risk of
default and expected credit loss rates. The Group uses its judgement in making these assumptions and
selecting the inputs to the impairment calculation, which is based on the Group’s historical experience, the
aging profile of the financial assets, existing market conditions as well as external economic forecasts at
each reporting date. Details of key considerations and judgements are detailed below.
18 STEEL & TUBE HALF YEAR REPORT 2019Trade receivables
The Group has analysed its Trade receivables balances using three different characteristics and calculated
the ECL allowance by considering the impact of each:
Consideration/Judgements
Baseline/Aging The Group’s “baseline” expectation for credit loss is informed by past experience and
the aging profile of the balances, applying an increasing expected credit loss estimate
as the balance ages.
Sector The Group has considered the credit risk related to the market sector that its
customers operate in and has made an adjustment to the ECL allowance based on
assessment of the respective financial strength of each industry sector.
Region The Group has considered the credit risk of its trade receivables portfolio based
on the respective financial strength of each geographic region, and has made an
adjustment to the baseline ECL allowance to reflect this.
The ECL allowance for Trade receivables as at 1 July 2018 was determined as follows:
Within 1 1-2 Beyond 2
Current Month Months Months Total
$000 $000 $000 $000 $000
Gross carrying amount 68,584 8,028 3,028 8,309 87,949
Baseline/Aging 343 161 226 3,235 3,965
Region (10) (5) (7) (96) (118)
Sector (1) - (1) (8) (10)
Expected credit loss allowance 332 156 218 3,131 3,837
The expected credit loss allowance for Trade receivables at 30 June 2018, as reported in the 30 June 2018
financial statements, reconciles to the opening loss allowance on 1 July 2018 as follows:
Loss allowance for Trade receivables $000
At 30 June 2018 – calculated under NZ IAS 39 2,980
Amounts restated through opening retained earnings (before tax) 857
Opening loss allowance as at 1 July 2018 – calculated under NZ IFRS 9 3,837
Over the period the baseline/aging characteristic of the Trade receivables balance has improved, resulting
in a reduction in the expected credit loss allowance of $0.8m for the half year ended 31 December
2018. This amount was recognised during the period within the Statement of Profit and Loss and Other
Comprehensive Income.
19NZ IFRS 15 Revenue from Contracts with Customers – impact of adoption
The Group has adopted NZ IFRS 15 from 1 July 2018 which has resulted in changes in accounting policies
relating to the recognition of revenue. The Group applied the modified retrospective approach for the
transition to NZ IFRS 15.
To assess the impact of NZ IFRS 15 on the Group, the Group has segregated the Group’s revenue streams
into three portfolios of contracts - Cash or credit supply sales, supply and installation sales and supply only
sales. For each contract portfolio, the five-step method outlined in NZ IFRS 15 was applied to assess the
impact on revenue recognition.
The Group concluded that the implementation of NZ IFRS 15 has no material impact on revenue
recognition.
The table below provides further information on the application of NZ IFRS 15 across the Group.
Contract Key
Portfolio Description judgements Outcome Timing of Recognition
Cash or Credit Any sales from No major There is one Point in time
Supply Sales individual orders judgement performance Revenue is recognised at point of sale
without a formal required obligation, being when the product is delivered.
written contract the supply of the
product
Supply and Any contracts Determining There are two Over time
Installation that contain whether or performance Revenue relating to the supply
Sales supply and not the supply obligations, performance obligation follows the
installation and installation being supply of same recognition process as for the
performance components the product and ‘Supply Only Sales’ contract portfolio.
obligations are “distinct” installation of the Installation of the product enhances
within the product. an asset controlled by the customer as
context of the Installation of the installation is completed.
contract the product is Revenue relating to the installation
considered a distinct performance obligation is recognised
performance when the installation is completed, or
obligation as supply on a stage of completion basis based
only contracts are on the input of labour costs.
also available
Supply Only Any contracts/ Determining There is one Over time
Sales sales agreements whether each performance The products supplied are required
that include act of supply obligation, being to be modified to a significant extent
supply of steel should be the act of the supply. and do not create an asset with an
product clauses treated as Irrespective of how alternative use to the Group. The
a separate many supply events Group has a right to consideration
performance occur, the products from the customer in an amount
obligation supplied are all that corresponds directly with the
within the highly interrelated value to the customer of the Group’s
contract in that they all are performance completed to date.
required for the Revenue relating to Supply Only
same construction Sales is recognised in the amount to
project which the Group has a right to invoice
under the terms of the construction
contract.
20 STEEL & TUBE HALF YEAR REPORT 2019NZ IFRS 16 Leases
NZ IFRS 16 Leases (NZ IFRS 16) requires lessees to account for all leases under a single on-balance sheet
model in a similar way to finance leases under NZ IAS 17. NZ IFRS 16 will require lessees to recognise a lease
liability reflecting future lease payments and a “right-of-use asset” for virtually all lease contracts within the
balance sheet. The Statement of Profit or Loss and Other Comprehensive Income will also be impacted by
the recognition of an interest expense and a depreciation expense and the removal of the current lease
expense.
The Group will apply NZ IFRS 16 from 1 July 2019. The Group intends to adopt the simplified transition
approach and will not restate comparative amounts for the period prior to first adoption.
The Group has significant lease obligations so adoption of NZ IFRS 16 will have a material impact on the
Balance Sheet and will impact the following line items in the Balance Sheet and Statement of Profit or Loss
and Other Comprehensive Income:
Balance Sheet:
• Recognition of a right to use asset;
• Recognition of a lease liability; and
• Adjustment in opening retained earnings.
Statement of Profit or Loss and Other Comprehensive Income:
• Decrease in operating leases expense;
• Increase in depreciation and amortisation expense; and
• Increase in finance costs (interest expense).
The amount of the asset and liability that the Group will recognise upon adoption of NZ IFRS 16 will be
determined by the lease commitments that exceed 12 months’ duration at the time of adoption.
The Group is currently undertaking an assessment to determine the impact of the new standard on the
Group’s financial statements.
The above has no impact on the cash flows of the Group and the change is for financial reporting purposes
only.
21NON-GAAP FINANCIAL INFORMATION
The Group uses several non-GAAP measures when discussing financial performance. Management
believes that these measures provide useful information on the underlying performance of the Group.
They may be used internally to evaluate performance, analyse trends and allocate resources. Non-GAAP
financial measures should not be viewed in isolation nor considered as a substitute for measures reported
in accordance with NZ IFRS.
The Group’s unaudited reconciliation of non-GAAP measures to GAAP measures for the half year
ended 31 December 2018 is detailed below.
Unaudited Unaudited
December 2018 December 2017
Reconciliation of GAAP to Non GAAP Measures $000 $000
GAAP: Earnings before interest and Tax (EBIT) 9,819 7,457
Add back Normalisation adjustments:
Excluding S&T Plastics EBIT (no longer contributing
to trading EBIT and held for sale)* (144) (1,214)
Gain on Property Sale - (413)
Impairment of inventory (excluding S&T Plastics)* - 4,983
Rationalisation and restructuring costs - 2,605
Normalised EBIT – Non GAAP 9,675 13,418
* S&T Plastics EBIT for the period ended 31 December 2017 included impairment of inventory of $0.5m.
Definitions:
• EBIT: This means earnings before the deduction of interest and tax and is calculated as profit for the
period before net interest costs and tax.
• Normalised EBIT: This means EBIT after Normalisation adjustments.
• Normalisation adjustments: These are transactions that are unusual by size or nature in a particular
accounting period. Excluding these transactions can assist users in forming a view of the underlying
performance of the Group. Unusual transactions can be as a result of specific events or circumstances
or major acquisitions, disposals or divestments that are not expected to occur frequently.
22 STEEL & TUBE HALF YEAR REPORT 2019Independent review report
To the shareholders of Steel & Tube Holdings Limited
Report on the interim financial statements
We have reviewed the accompanying interim financial statements of Steel & Tube Holdings Limited
(“the Company”) and its controlled entities (“the Group”) on pages 11 to 21 which comprise the balance
sheet as at 31 December 2018, and the statement of profit or loss and other comprehensive income, the
statement of changes in equity and the statement of cash flows for the six month period ended on that
date and selected explanatory notes.
Directors’ responsibility for the interim financial statements
The Directors are responsible on behalf of the Company for the preparation and fair presentation of
these interim financial statements in accordance with International Accounting Standard 34 Interim
Financial Reporting (IAS 34) and New Zealand Equivalent to International Accounting Standard 34
Interim Financial Reporting (NZ IAS 34) and for such internal control as the Directors determine is
necessary to enable the preparation of interim financial statements that are free from material
misstatement, whether due to fraud or error.
Our responsibility
Our responsibility is to express a conclusion on the accompanying interim financial statements based
on our review. We conducted our review in accordance with the New Zealand Standard on Review
Engagements 2410 Review of Financial Statements Performed by the Independent Auditor of the
Entity (NZ SRE 2410). NZ SRE 2410 requires us to conclude whether anything has come to our
attention that causes us to believe that the interim financial statements, taken as a whole, are not
prepared in all material respects, in accordance with IAS 34 and NZ IAS 34. As the auditors of the
Company, NZ SRE 2410 requires that we comply with the ethical requirements relevant to the audit of
the annual financial statements.
A review of interim financial statements in accordance with NZ SRE 2410 is a limited assurance
engagement. The auditor performs procedures, primarily consisting of making enquiries, primarily of
persons responsible for financial and accounting matters, and applying analytical and other review
procedures.
The procedures performed in a review are substantially less than those performed in an audit
conducted in accordance with International Standards on Auditing (New Zealand) and International
Standards on Auditing. Accordingly, we do not express an audit opinion on these interim financial
statements.
We are independent of the Group. Our firm carries out other services for the Group in the areas of tax
advisory and compliance and treasury policy review services. The provision of these other services has
not impaired our independence.
Conclusion
Based on our review, nothing has come to our attention that causes us to believe that these interim
financial statements of the Group do not present fairly, in all material respects, the financial position
of the Group as at 31 December 2018, and of its financial performance and cash flows for the six month
period then ended, in accordance with IAS 34 and NZ IAS 34.
PricewaterhouseCoopers, 10 Waterloo Quay, PO Box 243, Wellington 6140, New Zealand
T: +64 4 462 7000, F: +64 4 462 7001, pwc.co.nz
23Who we report to
This report is made solely to the Company’s Shareholders, as a body. Our review work has been
undertaken so that we might state to the Company’s Shareholders those matters which we are required
to state to them in our review report and for no other purpose. To the fullest extent permitted by law,
we do not accept or assume responsibility to anyone other than the Shareholders, as a body, for our
review procedures, for this report, or for the conclusion we have formed.
For and on behalf of:
Chartered Accountants Wellington
15 February 2019
The accompanying notes form part of these financial statements.
24 STEEL & TUBE HALF YEAR REPORT 2019REGISTERED OFFICE SHARE REGISTRY
Level 7, 25 Victoria Street, Petone, Computershare Investor Services Limited
Lower Hutt 5012, New Zealand Private Bag 92119, Auckland 1142, New Zealand
PO Box 30543, Lower Hutt 5040, New Zealand Ph: +64 9 488 8777 Fax: +64 9 488 8787
Ph: +64 4 570 5000 Fax: +64 4 569 2453 Email: enquiry@computershare.co.nz
Email: info@steelandtube.co.nz Website: www.computershare.co.nz
Website: www.steelandtube.co.nz
AUDITORS
PricewaterhouseCoopersYou can also read