EMERGING STRONGER HUGH JOHNSTON VICE CHAIRMAN & CHIEF FINANCIAL OFFICER - CAGNY 2021 - PepsiCo
←
→
Page content transcription
If your browser does not render page correctly, please read the page content below
CAGNY 2021

             EMERGING STRONGER
                 HUGH JOHNSTON
                 VICE CHAIRMAN &
                 CHIEF FINANCIAL OFFICER
SAFE HARBOR STATEMENT & NON-GAAP
INFORMATION
 Safe Harbor Statement
 Statements in this communication that are “forward-looking statements,” including our 2021 guidance and long term targets, are based on currently available information, operating plans
 and projections about future events and trends. Terminology such as “aim,” “anticipate,” “believe,” “drive,” “estimate,” “expect,” “expressed confidence,” “forecast,” “future,” “goal,” “guidance,”
 “intend,” “may,” “objective,” “outlook,” “plan,” “position,” “potential,” “project,” “seek,” “should,” “strategy,” “target,” “will” or similar statements or variations of such words and other similar
 expressions are intended to identify forward looking statements, although not all forward-looking statements contain such terms. Forward-looking statements inherently involve risks and
 uncertainties that could cause actual results to differ materially from those predicted in any such forward looking statements. Such risks and uncertainties include, but are not limited to: the
 impact of COVID-19; future demand for PepsiCo’s products; damage to PepsiCo’s reputation or brand image; issues or concerns with respect to product quality and safety; PepsiCo’s ability
 to compete effectively; PepsiCo’s ability to attract, develop and maintain a highly skilled and diverse workforce; water scarcity; changes in the retail landscape or in sales to any key customer;
 disruption of PepsiCo’s supply chain; political or social conditions in the markets where PepsiCo’s products are made, manufactured, distributed or sold; PepsiCo’s ability to grow its business
 in developing and emerging markets; changes in economic conditions in the countries in which PepsiCo operates; future cyber incidents and other disruptions; failure to successfully
 complete or manage strategic transactions; PepsiCo’s reliance on third-party service providers; climate change or measures to address climate change; strikes or work stoppages; failure to
 realize benefits from PepsiCo’s productivity initiatives; deterioration in estimates and underlying assumptions regarding future performance that can result in an impairment charge;
 fluctuations or other changes in exchange rates; any downgrade or potential downgrade of PepsiCo’s credit ratings; imposition or proposed imposition of new or increased taxes aimed at
 PepsiCo’s products; imposition of limitations on the marketing or sale of PepsiCo’s products; changes in laws and regulations related to the use or disposal of plastics or other packaging of
 PepsiCo’s products; failure to comply with personal data protection and privacy laws; increase in income tax rates, changes in income tax laws or disagreements with tax authorities; failure to
 adequately protect PepsiCo’s intellectual property rights or infringement on intellectual property rights of others; failure to comply with applicable laws and regulations; and potential
 liabilities and costs from litigation, claims, legal or regulatory proceedings, inquiries or investigations.

 For additional information on these and other factors that could cause PepsiCo’s actual results to materially differ from those set forth herein, please see PepsiCo’s filings with the Securities
 and Exchange Commission, including its most recent annual report on Form 10-K and subsequent reports on Forms 10-Q and 8-K. Investors are cautioned not to place undue reliance on any
 such forward-looking statements, which speak only as of the date they are made. PepsiCo undertakes no obligation to update any forward-looking statements, whether as a result of new
 information, future events or otherwise.

 Non-GAAP Information
 Please refer to PepsiCo’s web site at www.pepsico.com in the “Investors” section under “Financial Information – Events and Presentations,” and PepsiCo’s filings with the Securities and
 Exchange Commission, to find disclosure and a reconciliation of any non-GAAP financial measures contained herein.

                                                                                                                                                                                                           1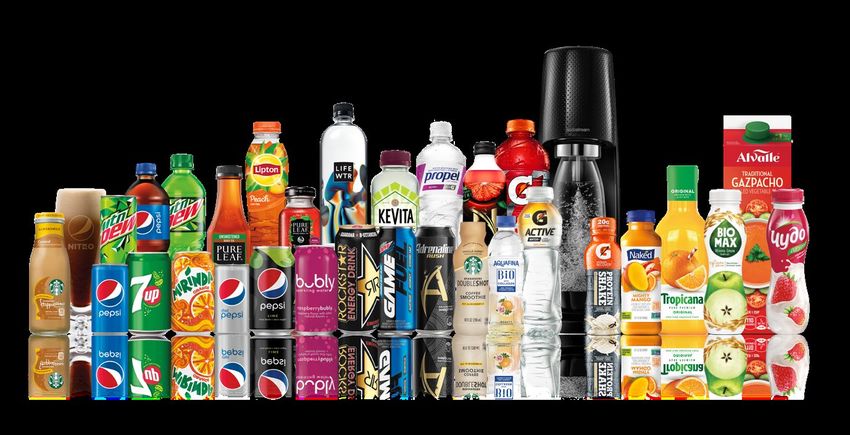
TODAY’S DISCUSSION

 01   Who We Are

 02   Our Value Creation Proposition

 03   Our Financial Outlook

                                       2
WHO WE ARE
23
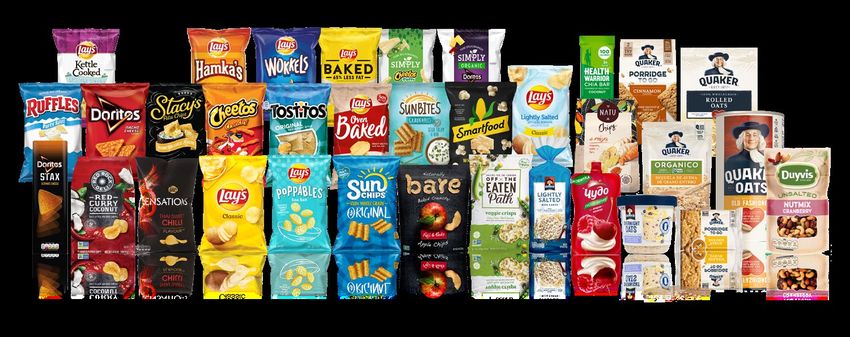
PepsiCo has a portfolio that includes
BILLION- Products sold in More than More than More than
200+ 290,000 $70 BILLION $10 BILLION
DOLLAR
BRANDS
that generated more than
countries and territories employees in net revenue in 2020 in operating profit in 2020
$1 billion each in estimated
annual retail sales in 2020. around the world
3
OUR MISSION

  MISSION               Create more smiles with every sip and every bite

                       Be the global leader in convenient foods and beverages
  VISION
                                       by winning with purpose

                     FA S T E R                                STRONGER                                          BETTER
            Winning in the marketplace, being         Transforming our capabilities, cost, and         Integrating purpose into our business
               more consumer-centric and                culture by operating as one PepsiCo,           strategy and doing even more for the
                                                       leveraging technology, winning locally                planet and for our people
    THE     accelerating investment for topline
                          growth
                                                                and globally enabled

  PEPSICO
    W AY
                  BE                              FOCUS &               VOICE               RAISE THE BAR                           ACT
                  CONSUMER        ACT AS          GET THINGS            OPINIONS            ON TALENT            CELEBRATE          WITH
                  CENTRIC         OWNERS          DONE FAST             FEARLESSLY          & DIVERSITY          SUCCESS            INTEGRITY

                                                                                                                                                4
GEOGRAPHIC MIX AND CATEGORY POSITIONS

                   Balanced Geographic Mix                                                                           Balanced Mix in Attractive Categories

                                                                   International
   Top 5 Markets
                                                                                                                              Snacks                                            Beverages
     comprise                                                                          % of Net
                                                                       Market          Revenue
         ~75%
  of Net Revenue                                                        Mexico             6
                                                                                                             • #1 position                                                                   • Strong #2
                                                                                                                                                                                          position with
                                                                        Russia             4                 • Leadership in
                                                  38%                                                          salty snacks
                                                                                                                                                 Snacks
                                                                                                                                                                                           leadership in
                                                                          UK               3
                                                                                                               and opportunity                                      Beverages             many markets

                                                                                                                                                55%
 North
 America                             62%                                 China

                                                                         South
                                                                                          2.5                  to target
                                                                                                               other
                                                                                                                                                                      45%                    • Compete
                                                                                                                                                                                                 broadly
                    % of Net                                                               2
     Market         Revenue
                                                                         Africa                                Macrosnack                                                                      in all LRB
                                                                         Total             17
                                                                                                               occasions                                                                      categories
        US              58

      Canada             4
                                                % of Total Net Revenue:
       Total             62
                                                        72%
                                                Developed:

                                                D&E: 28%
                                                                                                                                                                                                       5
 Note: PepsiCo data based on 2020 net revenue. Market share data (based on retail sales for macro snacks and beverages) based on 2020 Euromonitor. Numbers may not add due to rounding.
OUR DIVISIONS
                     Net Revenue By Division                                                                                       Core Division Operating Profit

                              APAC: 5%                                                                                                                         APAC: 5%
                     AMESA: 6%                                                                                                           AMESA: 7%
                                                                                                                                                                                                 PBNA: 17%

                                                                                                                      Europe: 12%
                                                                                      PBNA: 32%
 Europe: 17%

                                            $70.4                                                                                                               $12.0
                                            Billion                                                                  LatAm: 9%
                                                                                                                                                                Billion
  LatAm: 10%                                                                                                                                                                                               FLNA: 45%
                                                                                                                              QFNA: 6%

                     QFNA: 4%
                                                             FLNA: 26%

 Note: Full-Year 2020 reported operating profit was $10.1 billion. Core division operating profit is a non-GAAP financial measure that excludes certain items and corporate unallocated costs. Please refer to the
 “Investors” section of PepsiCo’s website at www.pepsico.com under the heading “Financial Information—Events and Presentations” to find the reconciliation of GAAP and non-GAAP information and definitions of       6
 non-GAAP financial measures. Numbers may not add due to rounding.
OUR NORTH AMERICA DIVISIONS
PepsiCo Beverages Frito-Lay Quaker Foods North
North America North America America
Top 5 Brands: Top 5 Brands: Top 5 Categories:
>65% ~60% >80%
of net revenue of net revenue of net revenue
Geographic Mix: : 94% / : 6% Geographic Mix: Geographic Mix:
LRB Mix: CSD: 43% / NCB: 57% : 93% / : 7% : 91% / : 9%
Bev. COBO / FOBO Mix: 95% / 5%
Note: PepsiCo data based on 2020 net revenue. COBO is defined as company owned bottling operations and FOBO is defined as franchised owned bottling operations. Pepsi includes Trademark Pepsi, Diet Pepsi,
and Pepsi Max. Mountain Dew includes, Trademark Mountain Dew, Diet Mountain Dew, and Mountain Dew Kickstart. Quaker Foods North America categories are defined by PepsiCo and include total oats, total bars, 7
total ready-to-eat cereal, mixes and syrup, and Golden Grain (Rice-a-Roni and Pasta Roni).OUR INTERNATIONAL DIVISIONS
Latin America Europe AMESA APAC
Top 5 Countries: Top 5 Countries: Top 5 Countries: Top 5 Countries:
~85% >60% >85% >85%
of net revenue of net revenue of net revenue of net revenue
Mexico Egypt South Vietnam
Chile Russia Germany China
Africa
Brazil Guatemala U.K. Turkey Saudi Pakistan Australia Philippines
Colombia France India Thailand
Snack / Beverage Mix: Snack / Beverage Mix: Snack / Beverage Mix: Snack / Beverage Mix:
90% / 10% 45% / 55% 70% / 30% 75% / 25%
Bev. COBO / FOBO Mix: Bev. COBO / FOBO Mix: Bev. COBO / FOBO Mix: Bev. COBO / FOBO Mix:
8% / 92% 93% / 7% 48% / 52% 0% / 100%
Note: Top 5 country percentage of net revenue, snack and beverage mix, and bottler mix based on 2020 net revenue data. COBO is defined as company owned bottling operations and FOBO is defined as franchised 8
owned bottling operations.OUR CULTURE AND VALUES
be consumer act as focus and get
centric owners things done fast
voice opinions raise the bar celebrate act with
fearlessly on talent and success integrity
diversity 9WINNING WITH PURPOSE
E nvironmental S ocial G overnance
GENDER FEMALE BOARD
PACKAGING AGRICULTURE
PARITY EMPOWERMENT DIVERSITY
RACIAL PORTFOLIO INDEPENDENT
WATER CLIMATE
EQUALITY DIVERSIFICATION BOARD
10TODAY’S DISCUSSION
01 Who We Are
02 Our Value Creation Proposition
03 Our Financial Outlook
11WE HAVE DELIVERED CONSISTENT ORGANIC
REVENUE GROWTH OVER THE LONG TERM
Our Long Term Organic Revenue Growth Target Remains Intact
5.0% +4-6%
4.5% 4.3%
4.0% 4.0%
3.7% 3.7%
2.3%
2013 2014 2015 2016 2017 2018 2019 2020 LT Target
Average: ~4%
Note: PepsiCo provides guidance on a non-GAAP basis as the Company cannot predict certain elements which are included in reported GAAP results, including the impact of foreign exchange and acquisitions, 12
divestitures and other structural changes. Organic revenue is a non-GAAP financial measure. Please refer to the “Investors” section of PepsiCo’s website at www.pepsico.com under the heading “Financial Information—
Events and Presentations” to find the reconciliation of GAAP and non-GAAP information and definitions of non-GAAP financial measures.BY EVOLVING OUR PORTFOLIO TO MEET THE
CHANGING NEEDS OF OUR CONSUMERS
Grow The Core Consumer-Centric
Address Strategic Gaps
Innovation
13AND BELIEVE THERE IS STILL A SIGNIFICANT RUNWAY
FOR GROWTH IN OUR KEY CATEGORIES
Global Beverages Opportunity Global Snacks Opportunity
5-YR Estimated 5-YR Estimated
CAGR: +4-5% 9% share CAGR: +4-5% 7% share
~$570 ~$550
Billion Billion
Note: PepsiCo defined global snacks include total savory, sweet, grains and dairy foods. PepsiCo defined beverages include liquid refreshment beverages categories and dairy. Figures exclude foodservice. Market size 14
(2019) and 5-year category CAGR (2020-2025) based on retail sales value of top 80 PEP countries from PepsiCo Portfolio Growth Model. Share is 2019 global retail value share from Euromonitor.WITH CLEAR PRIORITIES IN NORTH AMERICA
NA Market Leadership Key Priorities
• Accelerate growth by capturing
FLNA +
new needs and occasions,
QFNA
NA Position Market Share Market Size innovation, advanced digital
capabilities, and precision
Macrosnacks #1 ~$120B execution
• Outpace category growth,
Total LRB #1 ~$100B address consumer trends and
PBNA
modernize our go-to-market
system
eCommerce
Grocery ~$20B
• Leverage COVID-driven
channel growth to continue
eComm
>100% channel
sales and share momentum
growth in 2020
while building capabilities to
support competitive advantage
Note: PepsiCo defined macro-snacks includes total savory, sweet, and grains. NA includes United States and Canada. Market size is 2019 Retail Sales Value (RSV) from PepsiCo Portfolio Growth Model and excludes 15
Foodservice channel. eCommerce size and growth from Boston Consulting Group.AND INTERNATIONAL MARKETS
International Leadership In Food & Beverages
Key Priorities
in Key Growth Markets
• Broaden foods portfolio,
Int’l Position Market Share Market Size expanding to new categories,
needs and occasions
Snacks
China #6 ~$170B • Build scale by driving affinity,
availability, frequency and
affordability, especially in
Mexico #2 ~$39B developing markets to trade up
from unpackaged
Brazil #2 ~$34B • Invest strategically in beverage
markets, balancing growth and
Beverages
returns to be strong, profitable
Russia #1 ~$32B
#1 or #2 player
• Drive scale in select high
India #2 ~$22B growth LRB categories
Note: Market size and share is 2019 Retail Sales Value (RSV) and excludes Foodservice channel. Market size is from PepsiCo Portfolio Growth model and share is Euromonitor. China share is pre-acquisition of Be & 16
Cheery which would increase share position to #4.THAT TRANSLATES INTO A PROFITABLE GROWTH
EQUATION
Components Of Our Operating Leverage
Tailwinds Headwinds
Long-Term
Core
Long-Term Operating
Organic Operating Geographic Margin
Annual Capability Expansion
Revenue Expense &
Productivity Investments
Growth Inflation Channel mix
+4-6% ~$1 billion +20-30
bps
per annum
Note: PepsiCo provides guidance on a non-GAAP basis as the Company cannot predict certain elements which are included in reported GAAP results, including the impact of foreign exchange and mark-to-market 17
adjustments. Organic revenue and core operating margin are non-GAAP financial measures. Please refer to the “Investors” section of PepsiCo’s website at www.pepsico.com under the heading “Financial
Information—Events and Presentations” to find the reconciliation of GAAP and non-GAAP information and definitions of non-GAAP financial measures.BUT WILL VARY BY BUSINESS MIX AND PRIORITIES
Significant variation across Sectors
Total PepsiCo FLNA + QFNA PBNA International
Core Division Operating Core Division Core Division
Core Operating Margin
Margin Operating Margin Operating Margin
29.3%
15.0% 14.3%
9.1%
2020 2020 2020 2020
Note: Full-year 2020 PepsiCo reported operating margin was 14.3%. Full-Year 2020 FLNA reported operating margin was 29.4%. Full-Year 2020 QFNA reported operating margin was 24.4%. Full-Year 2020 PBNA
reported operating margin was 8.6%. Full-year 2020 International reported operating margin was 13.3%. Core operating margin represents total core operating margin for PepsiCo including corporate unallocated
expenses. Core division operating margin excludes certain items and corporate unallocated expenses. Core operating margin and core division operating margin are non-GAAP financial measures. Please refer to the 18
“Investors” section of PepsiCo’s website at www.pepsico.com under the heading “Financial Information—Events and Presentations” to find the reconciliation of GAAP and non-GAAP information and definitions of non-
GAAP financial measures.FLNA+QFNA: INVEST TO SUSTAIN / ACCELERATE
GROWTH AND ENHANCE COMPETITIVE ADVANTAGES
Today1 Future Key Drivers
Sustain/Increase Capture new occasions
and expand into
29.3% adjacencies
Increased
marketing and Productivity
breakthrough gains from
innovation automation and
digitization
Investments in portfolio,
Core Division Operating Margin reach and execution
Note: 1 Full-Year 2020 FLNA reported operating margin was 29.4%. Full-Year 2020 QFNA reported operating margin was 24.4%. Core division operating margin is a non-GAAP financial measure that excludes certain
items and corporate unallocated expenses. Please refer to the “Investors” section of PepsiCo’s website at www.pepsico.com under the heading “Financial Information—Events and Presentations” to find the 19
reconciliation of GAAP and non-GAAP information and definitions of non-GAAP financial measures.PBNA: EVOLVE PORTFOLIO AND IMPROVE PROFIT AND
RETURNS
Today1 Future Key Drivers
Increase
Improved portfolio mix to drive growth and
margin gains
9.1% Invest in advanced revenue management
capability
Enhance marketing ROI
Modernize supply chain and digital foundation
to accelerate productivity
Technology-enabled precision at scale
Core Division Operating Margin Expand Global Business Services capability
Note: 1 Full-Year 2020 PBNA reported operating margin was 8.6%. Core division operating margin is a non-GAAP financial measure that excludes certain items and corporate unallocated expenses. Please
refer to the “Investors” section of PepsiCo’s website at www.pepsico.com under the heading “Financial Information—Events and Presentations” to find the reconciliation of GAAP and non-GAAP information 20
and definitions of non-GAAP financial measures.INTERNATIONAL: GROW SCALE FOR OUR SNACKS
BUSINESS AND INVEST STRATEGICALLY IN BEVERAGES
Today1 Future Key Drivers
Snacks Beverage
Sustain/Increase
14.3% • Focus on building scale • Strategically invest to
via per capita balance growth and
consumption to drive returns, focusing on core
efficiencies brands with selective
• Unlock key price points NCB plays
and profitability with • Strengthen bottling
lower cost operating network, investing in
models in developing scaled local and global
markets partners
• Streamline and digitize operations through Global
Core Division Operating Margin Business Services
Note: 1 Full-year 2020 International reported operating margin was 13.3%. Core division operating margin is a non-GAAP financial measure that excludes certain items and corporate unallocated expenses.
Please refer to the “Investors” section of PepsiCo’s website at www.pepsico.com under the heading “Financial Information—Events and Presentations” to find the reconciliation of GAAP and non-GAAP 21
information and definitions of non-GAAP financial measures.OUR DIVISIONAL PRIORITIES KEEP OUR LONG-TERM
CAPITAL ALLOCATION PRIORITIES UNCHANGED
1
Invest in the Business
Capital spending to drive growth and productivity
agenda
2
Pay / Grow Dividends Increased dividend for 49 consecutive years
3
Strengthen Portfolio Bolt-On M&A
Through M&A
4
Share Repurchases While maintaining access to debt capital markets at
attractive rates
Note: 2021 dividend increase effective with the dividend expected to be paid in June 2021. For 2021, PepsiCo will be prioritizing capital spending and dividends over mergers and acquisitions as well as share repurchases.
As of February 11, 2021, PepsiCo has repurchased $100 million worth of shares and does not anticipate additional share repurchases for 2021. 22WE ARE PRIORITIZING HIGHER CAPITAL INVESTMENTS
FOR GROWTH AND PRODUCTIVITY INITIATIVES
Net Capital Spending Where Are We Investing?
(as % of Net Revenue)
ESG
Digitizing
end-to-end
Growth Productivity supply chain
Increase
Manufacturing
Capacity
23WHICH IS WHY OUR FREE CASH FLOW CONVERSION
HAS MODERATED BUT REMAINS STRONG
Free Cash Flow Conversion
121%
113% 110%
106%
96%
84%
78%
72%
2013 2014 2015 2016 2017 2018 2019 2020
Note: Free Cash Flow conversion is calculated by dividing Free Cash Flow by total Core Net Income attributable to PepsiCo. Free Cash Flow is calculated by subtracting capital spending from the sum of net
cash provided by operating activities and sales of property, plant and equipment. Free cash flow conversion ratio is a non-GAAP measure. Please refer to the “Investors” section of PepsiCo’s website at 24
www.pepsico.com under the heading “Financial Information—Events and Presentations” to find the reconciliation of GAAP and non-GAAP information and definitions of non-GAAP financial measures.WE ARE ALSO PRIORITIZING DIVIDEND GROWTH
Dividends Per Share
Current Dividend Yield: ~3%
Effective
June 2021
$4.30
$4.02
49
$3.79
$3.59
$3.17
$2.96
$2.76
$2.53
$2.24
Consecutive years of
dividend hikes
2013 2014 2015 2016 2017 2018 2019 2020 2021
Note: 2021 dividend increase effective with the dividend expected to be paid in June 2021. Current dividend yield reflects our annualized dividend per share divided by our share price as of 2/2/2021. 25AS WE BELIEVE WE HAVE ADDRESSED KEY PORTFOLIO
GAPS WITH RECENT ACQUISITIONS
M&A Spend (in millions) Recent M&A
$10,585
$556
2013 to 2017 2018 to 2020
Very Pleased With Our Current Portfolio
26AND MUST NOW FOCUS ON IMPROVING THE RETURN
ON OUR INVESTMENTS
Core Net ROIC
24.8%
22.9% 22.3%
21.5%
19.6% 19.9%
17.5%
16.4%
2013 2014 2015 2016 2017 2018 2019 2020
Note: Full-year 2020 reported net income attributable to PepsiCo was $7.1 billion. Core Net ROIC is a non-GAAP measure. Please refer to the “Investors” section of PepsiCo’s website at www.pepsico.com under the
heading “Financial Information—Events and Presentations” to find the reconciliation of GAAP and non-GAAP information and definitions of non-GAAP financial measures. 27WHILE PRESERVING OUR BALANCE SHEET STRENGTH
AND LIQUIDITY
Use of Cash /
Liquidity Principles
Committed To Maintaining Investment Grade Rating + Access to Tier-1 Commercial Paper
Investing In Our Business Returning Cash To Shareholders
2021 Priorities
1 2
Fund capital spending to preserve day-to-day Ensure long-term sustainability of growing
business operations while investing for growth dividend payments
3 4
Fund strategic M&A to compete effectively and Creating Additional Value To Shareholders In The
enhance future financial returns and liquidity Form of Share Repurchases
28AS WE ASPIRE TO DELIVER SUSTAINABLE GROWTH,
INCOME AND VALUE CREATION
Long-Term Targets Income
Core Core Current
Organic
Operating Constant Dividend
Revenue
Margin Currency EPS Yield
Growth
Expansion Growth
+4-6% +20-30 bps +HSD% ~3%
annually
Value Creation
Note: PepsiCo provides guidance on a non-GAAP basis as the Company cannot predict certain elements which are included in reported GAAP results, including the impact of foreign exchange and mark-to-market
adjustments. Organic revenue, core operating margin and core constant currency EPS are non-GAAP financial measures. Please refer to the “Investors” section of PepsiCo’s website at www.pepsico.com under the 29
heading “Financial Information—Events and Presentations” to find the reconciliation of GAAP and non-GAAP information and definitions of non-GAAP financial measures.TODAY’S DISCUSSION
01 Who We Are
02 Our Value Creation Proposition
03 Our Financial Outlook
302021 OUTLOOK
+MSD +HSD $5.9B
1 2 3
Organic Revenue Core Constant Cash Return to
Growth Currency EPS Growth Shareholders
Note: 1: +MSD is defined as mid-single digit. 2: +HSD is defined as high-single digit. 3: Comprised of $5.8 billion in dividends and $0.1 billion in share repurchases. As of February 11, 2021, PepsiCo has repurchased $100
million worth of shares and does not anticipate additional share repurchases for 2021. PepsiCo provides guidance on a non-GAAP basis as the Company cannot predict certain elements which are included in reported
GAAP results, including the impact of foreign exchange and mark-to-market adjustments. Organic revenue and core constant currency EPS are non-GAAP financial measures. Please refer to the “Investors” section of
PepsiCo’s website at www.pepsico.com under the heading “Financial Information—Events and Presentations” to find the reconciliation of GAAP and non-GAAP information and definitions of non-GAAP financial 31
measures. Guidance as of February 11, 2021.32
You can also read