CAGNY 2020 - Sysco Investor Relations
←
→
Page content transcription
If your browser does not render page correctly, please read the page content below

CAGNY 2020

Forward Looking Statements
Statements made in this presentation or in our earnings call for the second quarter of fiscal 2020 that look forward in time or that express management’s beliefs, expectations or hopes are forward-looking statements within
the meaning of the Private Securities Litigation Reform Act of 1995. Such forward-looking statements reflect the views of management at the time such statements are made and are subject to a number of risks,
uncertainties, estimates, and assumptions that may cause actual results to differ materially from current expectations. These statements include: our expectations that our investments in technology and our business will
allow for future growth and exceptional customer service; our expectations regarding our ability to increase profitability for SYGMA; our expectations regarding our ability to leverage operating expense growth to gross profit
growth; our expectations regarding our investments across Europe, including, but not limited to, the integration of Brakes France and Davigel to Sysco France, including our ability to continue to succeed in the French
marketplace and our expectations regarding the ability of our overall integration and supply chain transformation to deliver the anticipated long-term benefits under our three-year plan; expectations regarding growth
opportunities in Europe; expectations regarding growth opportunities in Latin America, and our plans to open additional retail cash and carry stores in Panama; our plans to focus on accelerating our business; our
expectations regarding the impact of costs associated with the senior leadership change; our ability to deliver against our strategic priorities, which we believe will provide excellent customer service and improve our overall
performance; statements regarding economic trends in the United States and abroad; our expectations regarding the amount of our capital expenditures in fiscal 2020; our expectations regarding future accelerated growth
and performance, and expectations regarding the impact on adjusted operating income of investment spending to achieve these goals; our expectations regarding trends in produce markets; our expectations regarding cash
flow from operations; and our expectations with respect to achieving our three-year financial targets through fiscal 2020.

The success of our plans and expectations regarding our operating performance, including expectations regarding our three-year financial objectives, are subject to the general risks associated with our business, including
the risks of interruption of supplies due to lack of long-term contracts, severe weather, crop conditions, work stoppages, intense competition, technology disruptions, dependence on large, long-term regional and national
customers, inflation risks, the impact of fuel prices, adverse publicity, labor issues, political or financial instability, trade restrictions, tariffs, currency exchange rates, transport capacity and costs and other factors relating to
foreign trade, any or all of which could delay our receipt of product or increase our input costs. Risks and uncertainties also include risks impacting the economy generally, including the risks that the current general economic
conditions will deteriorate, or consumer confidence in the economy or consumer spending, particularly on food-away-from-home, may decline. Market conditions may not improve. Competition and the impact of GPOs may
reduce our margins and make it difficult for us to maintain our market share, growth rate and profitability. We may not be able to fully compensate for increases in fuel costs, and fuel hedging arrangements intended to
contain fuel costs could result in above market fuel costs. Our ability to meet our long-term strategic objectives depends on our ability to grow gross profit, leverage our supply chain costs and reduce administrative costs.
This will depend largely on the success of our various business initiatives, including efforts related to revenue management, expense management, our digital e-commerce strategy and any efforts related to restructuring or
the reduction of administrative costs. There are various risks related to these efforts, including the risk that if sales from our locally managed customers do not grow at the same rate as sales from regional and national
customers, or if we are unable to continue to accelerate local case growth, our gross margins may decline; the risk that we are unlikely to be able to predict inflation over the long term, and lower inflation is likely to produce
lower gross profit; the risk that our efforts to modify truck routing, including our small truck initiative, in order to reduce outbound transportation costs may not be effective; the risk that our efforts to mitigate increases in
warehouse costs may be unsuccessful; the risk that we may not be able to accelerate and/or identify additional administrative cost savings in order to compensate for any gross profit or supply chain cost leverage
challenges; the risk that these efforts may not provide the expected benefits in our anticipated time frame, if at all, and may prove costlier than expected; the risk that the actual costs of any initiatives may be greater or
less than currently expected; and the risk of adverse effects to our business, results of operations and liquidity if past and future undertakings, and the associated changes to our business, do not prove to be cost effective or
do not result in the cost savings and other benefits at the levels that we anticipate. Our plans related to and the timing of any initiatives are subject to change at any time based on management’s subjective evaluation of our
overall business needs. If we are unable to realize the anticipated benefits from our efforts, we could become cost disadvantaged in the marketplace, and our competitiveness and our profitability could decrease. Adverse
publicity about us or lack of confidence in our products could negatively impact our reputation and reduce earnings. Capital expenditures may vary based on changes in business plans and other factors, including risks related
to the implementation of various initiatives, the timing and successful completion of acquisitions, construction schedules and the possibility that other cash requirements could result in delays or cancellations of capital
spending. Periods of significant or prolonged inflation or deflation, either overall or in certain product categories, can have a negative impact on us and our customers, as high food costs can reduce consumer spending in the
food-away-from-home market, and may negatively impact our sales, gross profit, operating income and earnings, and periods of deflation can be difficult to manage effectively. Fluctuations in inflation and deflation, as well
as fluctuations in the value of foreign currencies, are beyond our control and subject to broader market forces. Expanding into international markets presents unique challenges and risks, including compliance with local laws,
regulations and customs and the impact of local political and economic conditions, including the impact of Brexit and the “yellow vest” protests in France against a fuel tax increase, pension reform and the French
government, and such expansion efforts may not be successful. Any business that we acquire may not perform as expected, and we may not realize the anticipated benefits of our acquisitions. Expectations regarding the
financial statement impact of any acquisitions may change based on management’s subjective evaluation. A divestiture of one or more of our businesses may not provide the anticipated effects on our operations. Meeting our
dividend target objectives depends on our level of earnings, available cash and the success of our various strategic initiatives. Changes in applicable tax laws or regulations and the resolution of tax disputes could negatively
affect our financial results. We rely on technology in our business and any cybersecurity incident, other technology disruption or delay in implementing new technology could negatively affect our business and our
relationships with customers. For a discussion of additional factors impacting Sysco’s business, see our Annual Report on Form 10-K for the year ended June 29, 2019, as filed with the SEC, and our subsequent filings with
the SEC. We do not undertake to update our forward-looking statements, except as required by applicable law.

KEVIN HOURICAN
PRESIDENT & CEO

Sysco is the Industry Leader in Foodservice
  Distribution With a Platform for Growth

                      • Platform for long-term
                        growth
                      • Strong balance sheet
                      • Continually return value to
                        shareholders
                      • Socially responsible
                        investment
Our Four Strategic Priorities Will Accelerate Our
Current Growth and Position Us Well for the Future

Our Future Profitable Growth Acceleration
     Will Be Driven by Three Key Principles

   Enhancing             Being the most         Pursuing multiple
customer facing         efficient operator         avenues of
     tools                                           growth

                  Enabled by the power of our people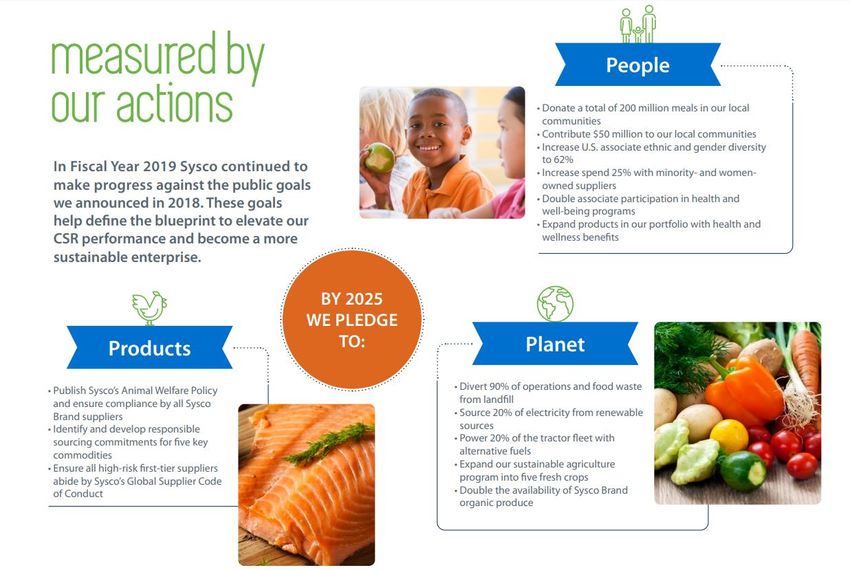
We Are Pursuing Multiple Avenues
                             of Growth
Examples include:
• Accelerating Organic
  Growth
   • Share of wallet
   • Metro markets
• M&A
• International

        All while maintaining a disciplined approach to profitable growth
M&A Is a Key Lever of Sysco’s Growth Strategy

                                                 Expansion of                           Acquired                                        Acquired J&M     Acquired     Acquired
 Traditional                    Acquired first     Canadian         Acquired           Supplies on          Acquired   Fully Acquired    Wholesale/       Waugh     Armstrong &
Foodservice    Acquired CFS   produce company     Operations    European Imports         the Fly             Doerle        Mayca          Imperio         Foods     Kula Produce
1970-1985         1988             2000             2002             2012                 2016               2018           2018           2019           2019         2019

   1985             1999               2001               2009             2014                 2016               2018             2018                2019           2019
SYGMA formed     Acquired first    Acquired Guest   First acquisition   JVs in Latin            Brakes            Acquired           HFM               Acquired      Acquired
                 meat company         Supply           in Ireland         America             acquisition           KFF           Acquisition           Classic       J. Kings
                                                                                                                                                        Drinks      Foodservice

                    Our strong balance sheet affords us the opportunity to fuel M&A growth
We Will Continue to Lead in
 Returning Value to
 Shareholders

Profitable share gaining topline growth
Meaningful cash generation
Dividend growth
Total Shareholder Return

NEIL RUSSELL
VP, CORPORATE AFFAIRS
Sysco Brand Portfolio Delivers Significant Overall Value
            in Quality, Variety and Price to Our Customers …

…including
five $1B
brands

…and three
$500M
brands
Four Decades of Progress
JOEL GRADE
EVP & CFO
2Q20 Financial Results

                                                                     Total Sysco                    2Q201

                                                                 Sales                     $15.0B   1.8%

                                                                 Gross Profit              $2.8B    2.0%

                                                                 Adj. Operating Expense1   $2.2B    1.5%

                                                                 Adj. Operating Income1    $627M    3.9%

                                                                            1
                                                                 Adj. EPS                  $0.85    13.2%

1 See Non-GAAP reconciliations at the end of the presentation.
Updated FY18-FY20 Three-year Plan Guidance
Guidance As Anticipated Updated Three-
Disclosed on FY18-FY20 Year Plan1
August 12, 2019 Results Guidance
Local Cases 3.0%-3.3% 3.3% On-Plan
Total Cases 2.5%-3.0% 2.5% On-Plan On-plan despite
continued
disciplined
Sales 3.5%-4.0% 3.7% On-Plan approach to
profitable growth
Gross Profit 3.5%-4.0% 3.6% On-Plan with our national/
SYGMA customers
Adjusted
~8% ~7% growth over 3 years,
Operating 7.0%
Income ~$600M1 +$500-525M over 3 years
Adjusted EPS ~15% ~15.5% On-Plan
1 See Non-GAAP reconciliations at the end of the presentation.FY18-FY20 Adj. Operating Income
Reset Breakout
~ 40% Solid leadership in place
Through the remainder of FY20 and we are deploying
International additional subject matter
Underperformance experts
~ 20%
Managing underperformance
U.S. Addressable within 90 days through improved revenue
management
Underperformance
~ 40%
50% are transitory Accelerated investments in
50% are investments customer facing and sales
Costs support technologyWe Are Improving Our
Customer-Facing Technology
1. Grow share of wallet
2. Sales support
technology
3. Drive efficiencies
4. Reduce complexityOur Cash Generation Capabilities Are
Strong; Funding Future Investments
Investment Cycle With Growth Comes:
Generate Cash Enhancing customer facing
tools
Being the most efficient
operator
Pursuing multiple avenues
of growth
Invest to GrowSysco Places a Priority on Returning
Value to Shareholders
16% 3-Year TSR 1
$1.8B Total Value Returned
51 Consecutive Annual Dividend Increases
17% ROIC 2,3
Returned $1.8 billion in value to shareholders through
1 Returns represent average annualized return as of February 10, 2020
2 See Non-GAAP reconciliations at the end of the presentation
3 ROIC TTM as of December 29, 2019
dividends and share buybacks in FY19While Following a Disciplined
Approach to Capital Allocation
1. Invest in the business
2. Grow the dividend
3. Strategic M&A
4. Paydown debt/ Opportunistic
Share RepurchaseWe Are Leveraging Our Momentum in
the Business for the Next 50 Years
• Strong fundamentals
• Consistent execution
• Well positioned for future
growthQ&A
Non-GAAP
Reconciliations
IMPACT OF CERTAIN ITEMS

                 Our discussion below and elsewhere herein of our results includes certain non-GAAP financial measures that we believe provide important perspective with respect to underlying
business trends. Other than free cash flow, any non-GAAP financial measures will be denoted as adjusted measures and exclude the impact from restructuring and transformational project costs
consisting of: (1) expenses associated with our various transformation initiatives; (2) severance and facility closure charges; and (3) restructuring charges.

                The fiscal 2020 and fiscal 2019 items described above and excluded from our non-GAAP measures are collectively referred to as "Certain Items." All acquisition-related costs in fiscal
2020 and fiscal 2019 that have been designated as Certain Items relate to the fiscal 2017 acquisition of Cucina Lux Investments Limited (the Brakes Acquisition). These include acquisition-related
intangible amortization expense. In addition, our results of operations for fiscal 2019 were negatively affected by acquisition-related integration costs specific to the Brakes Acquisition and the impact
of recognizing a foreign tax credit.

               Our results of our foreign operations can be impacted due to changes in exchange rates applicable in converting local currencies to U.S. dollars. We measure our International
Foodservice Operations results on a constant currency basis. Constant currency operating results are calculated by translating current-period local currency operating results with the currency
exchange rates used to translate the financial statements in the comparable prior-year period to determine what the current-period U.S. dollar operating results would have been if the currency
exchange rate had not changed from the comparable prior-year period.

                Management believes that adjusting its operating expenses, operating income, net earnings and diluted earnings per share to remove these Certain Items and presenting its
International Foodservice Operations results on a constant currency basis, provides an important perspective with respect to our underlying business trends and results and provides meaningful
supplemental information to both management and investors that (1) is indicative of the performance of the company's underlying operations, facilitating comparisons on a year-over-year basis, and
(2) removes those items that are difficult to predict and are often unanticipated and that, as a result, are difficult to include in analysts' financial models and our investors' expectations with any
degree of specificity.

                Although Sysco has a history of growth through acquisitions, the Brakes Group was significantly larger than the companies historically acquired by Sysco, with a proportionately greater
impact on Sysco’s consolidated financial statements. Accordingly, Sysco is excluding from its non-GAAP financial measures for the relevant period solely those acquisition costs specific to the Brakes
Acquisition. We believe this approach significantly enhances the comparability of Sysco’s results for fiscal 2020 and fiscal 2019.

                The company uses these non-GAAP measures when evaluating its financial results, as well as for internal planning and forecasting purposes. These financial measures should not be
used as a substitute for GAAP measures in assessing the company’s results of operations for periods presented. An analysis of any non-GAAP financial measure should be used in conjunction with
results presented in accordance with GAAP. As a result, in the table below, each period presented is adjusted for the impact described above. In the table below, individual components of diluted
earnings per share may not add to the total presented due to rounding. Adjusted diluted earnings per share is calculated using adjusted net earnings divided by diluted shares outstanding.
OPERATING INCOME TARGET
We expect to achieve our gross profit, operating income and earnings per share targets under our revised 3-
year strategic plan ending fiscal 2020. Our targets and expectations include adjusted operating income and adjusted
diluted earnings per share targets. We have revised the expected growth rates for these targets within our three-year
plan, and, although there are uncertainties in projecting financial results including Certain Items for the remainder of
fiscal 2020, we have prepared a reconciliation of these forecasted non-GAAP measures to the most directly comparable
forecasted GAAP measures based on our forecasted full year results. We have calculated these adjusted forecasted results
in the same manner as the reconciliations provided for historical periods presented herein. Nevertheless, the impact of
future Certain Items could cause projected non-GAAP amounts to differ significantly from our GAAP results. Future results
may differ from our expectations set forth in the table below as expressed in the forward-looking statements.IMPACT OF CERTAIN ITEMS, 2Q20
Sysco Corporation and its Consolidated Subsidiaries
Non-GAAP Reconciliation (Unaudited)
Impact of Certain Items
(Dollars in Thousands, Except for Share and Per Share Data)
13-Week 13-Week
Period Ended Period Ended Period Change Period
Dec. 28, 2019 Dec. 29, 2018 in Dollars % Change
Operating expenses (GAAP) $ 2,275,906 $ 2,319,817 $ (43,911) -1.9%
Impact of restructuring and transformational project costs (1) (57,105) (134,436) 77,332 -57.5%
Impact of acquisition-related costs (2) (17,312) (17,008) (304) 1.8%
Operating expenses adjusted for Certain Items (Non-GAAP) $ 2,201,489 $ 2,168,373 $ 33,116 1.5%
Operating income (GAAP) $ 552,493 $ 451,895 $ 100,598 22.3%
Impact of restructuring and transformational project costs (1) 57,105 134,436 (77,332) -57.5%
Impact of acquisition-related costs (2) 17,312 17,008 304 1.8%
Operating income adjusted for Certain Items (Non-GAAP) $ 626,910 $ 603,339 $ 23,571 3.9%
Net earnings (GAAP) $ 383,410 $ 267,380 $ 116,030 43.4%
Impact of restructuring and transformational project costs (1) 57,105 134,436 (77,332) -57.5%
Impact of acquisition-related costs (2) 17,312 17,008 304 1.8%
Tax impact of restructuring and transformational project costs (3) (15,372) (34,886) 19,514 -55.9%
Tax impact of acquisition-related costs (3) (4,658) (5,611) 953 -17.0%
Impact of foreign tax credit benefit - 15,154 (15,154) NM
Net earnings adjusted for Certain Items (Non-GAAP) $ 437,797 $ 393,481 $ 44,317 11.3%
Diluted earnings per share (GAAP) $ 0.74 $ 0.51 $ 0.23 45.9%
Impact of restructuring and transformational project costs (1) 0.11 0.26 (0.15) -57.7%
Impact of acquisition-related costs (2) 0.03 0.03 - NM
Tax impact of restructuring and transformational project costs (3) (0.03) (0.07) 0.04 -57.1%
Tax impact of acquisition-related costs (3) (0.01) (0.01) - NM
Impact of foreign tax credit benefit - 0.03 (0.03) NM
Diluted EPS adjusted for Certain Items (Non-GAAP) (4) $ 0.85 $ 0.75 $ 0.10 13.2%
Diluted shares outstanding 515,517,792 524,600,510
(1 )
Fiscal 2020 includes $34 million related to various transformation initiative costs, primarily consisting of changes to our business technology strategy, and $23
million related to restructuring, facility closure and severance charges. Fiscal 2019 includes $53 million related to various transformation initiative costs, of which
$17 million relates to accelerated depreciation related to software that is being replaced, and $81 million relates to severance, restructuring and facility closure
charges in Europe and Canada, of which $55 million relates to our integration of Brake France and Davigel into Sysco France.
(2 )
Fiscal 2020 and fiscal 2019 each include $17 million related to intangible amortization expense from the Brakes Acquisition, which is included in the results of
International Foodservice.
(3 )
The tax impact of adjustments for Certain Items are calculated by multiplying the pretax impact of each Certain Item by the statutory rates in effect for each
jurisdiction where the Certain Item was incurred.
(4 )
Individual components of diluted earnings per share may not add up to the total presented due to rounding. Total diluted earnings per share is calculated using
adjusted net earnings divided by diluted shares outstanding.
NM represents that the percentage change is not meaningful.
- more -OPERATING INCOME GROWTH FY18-FY20
Sysco Corporation and its Consolidated Subsidiaries
Non-GAAP Reconciliation (Unaudited)
Operating Income Growth
(In Thousands)
Year Ended
3-year Plan Change
June 27, 2020 July 1, 2017 $ Results CAGR
Operating income (GAAP) $ 2,539,614 $ 2,054,616 $ 484,998 7.3%
Impact of restructuring and transformational project costs 257,340 161,011 96,329
Impact of acquisition-related costs 68,822 102,049 (33,227)
MEPP Charge - 35,600 (35,600)
Operating income adjusted for certain items (Non-GAAP) (1) $ 2,865,776 $ 2,353,276 $ 512,500 6.8%
Diluted earnings per share (GAAP) $ 3.31 $ 2.08 $ 1.23 16.8%
Impact of restructuring and transformational project costs, net of tax 0.39 0.20 0.19
Impact of acquisition-related costs, net of tax 0.10 0.16 (0.06)
Impact of MEPP charge, net of tax - 0.04 (0.04)
Diluted EPS adjusted for Certain Items (Non-GAAP) (1)(2) $ 3.81 $ 2.48 $ 1.33 15.4%
(1 )
The forecasted adjusted operating income and adjusted diluted EPS targets for fiscal 2020 represents the expected result required to achieve the mid-point of the
fiscal 2018 to fiscal 2020 adjusted operating income growth target range of approximately $500 million to $525 million.
(2 )
Individual components of diluted earnings per share may not add up to the total presented due to rounding. Total diluted earnings per share is calculated using
adjusted net earnings divided by diluted shares outstanding.ROIC
Adjusted Return on Invested Capital (ROIC)
(Dollars in Thousands)
We calculate ROIC as net earnings from the trailing twelve months (TTM) divided by (i) stockholder’s equity, computed as the average of adjusted stockholders’
equity at the beginning of the TTM period and at the end of each fiscal quarter during the TTM excluding the impact of foreign currency translation adjustments; and (ii) long-
term debt, computed as the average of the long-term debt at the beginning of the TTM period and at the end of each fiscal quarter during the TTM. All components of our
ROIC calculation are impacted by Certain Items. As a result, in the non-GAAP reconciliation below, adjusted total invested capital is computed as the sum of (i) adjusted
stockholder’s equity, computed as the average of adjusted stockholders’ equity at the beginning of the TTM period and at the end of each fiscal quarter during the TTM; and
(ii) adjusted long-term debt, computed as the average of the adjusted long-term debt at the beginning of the TTM period and at the end of each fiscal quarter during the
TTM. Sysco considers adjusted ROIC to be a measure that provides useful information to management and investors in evaluating the efficiency and effectiveness of the
company's long-term capital investments, and we currently use ROIC as a performance criteria in our management incentive programs. It is possible that a different
definition of ROIC may be used by other companies since it can be defined differently. An analysis of any non-GAAP financial measure should be used in conjunction with
results presented in accordance with GAAP. In the table that follows, Adjusted ROIC is reconciled to a GAAP based calculation of ROIC.
26-Week
Period Ended
Dec. 28, 2019
Form of calculation:
Net earnings (GAAP) $ 1,813,038
Impact of Certain Items on net earnings 119,171
Adjusted net earnings (Non-GAAP) $ 1,932,209
Invested Capital (GAAP) $ 11,049,847
(1)
Adjustments to invested capital 275,517
Adjusted invested capital (Non-GAAP) $ 11,325,364
Return on investment capital (GAAP) 16.4%
Return on investment capital (Non-GAAP) 17.1%
(1)
Shareholder's equity adjustments include the impact of Certain Items from earnings and removal of foreign
currency translation adjustments that arose in the fiscal year.You can also read