Baird Global Consumer, Technology Services Conference New York - June 6th, 2019 Joe Ragan - CFO - Resideo
←
→
Page content transcription
If your browser does not render page correctly, please read the page content below

Baird Global Consumer, Technology
Services Conference
New York – June 6th, 2019
                    Joe Ragan - CFO
Disclaimer
    Forward Looking Statements
    This presentation contains “forward-looking statements.” All statements, other than statements of fact, that address activities, events or developments that we or our
    management intend, expect, project, believe or anticipate will or may occur in the future are forward-looking statements. Although we believe forward-looking
    statements are based upon reasonable assumptions, such statements involve known and unknown risks, uncertainties, and other factors, which may cause the
    actual results or performance of the company to be materially different from any future results or performance expressed or implied by such forward-looking
    statements. Such risks and uncertainties include, but are not limited to, those described under the headings “Risk Factors” and “Cautionary Statement Concerning
    Forward-Looking Statements,” in our Annual Report on Form 10-K for the year ended December 31, 2018 filed with the Securities and Exchange Commission
    (“SEC”). You are cautioned not to place undue reliance on these forward-looking statements, such as our guidance regarding 2019 and 2023 and our planned $50
    million cost program, which speak only as of the date of this presentation. Forward looking statements are not guarantees of future performance, and actual results,
    developments and business decisions may differ from those envisaged by our forward-looking statements.

    Non-GAAP Financial Measures
    This release includes EBITDA, Adjusted EBITDA, Adjusted EBITDA excluding Honeywell reimbursement agreement payments, Segment Adjusted EBITDA, Adjusted Net Income, Adjusted
    Net Income excluding Honeywell reimbursement agreement payments, adjusted basic and diluted net income per share, constant currency growth, and other financial measures not
    compliant with generally accepted accounting principles in the United States (GAAP). The non-GAAP financial measures are adjusted for certain items above and may not be directly
    comparable to similar measures used by other companies in our industry, as other companies may define such measures differently. Management believes that, when considered together
    with reported amounts, these measures are useful to investors and management in understanding our ongoing operations and in analysis of ongoing operating trends and provide useful
    additional information relating to our operations and financial condition. These metrics should be considered in addition to, and not as replacements for, the most comparable GAAP
    measure. Refer to the tables above in this release for reconciliations of non-GAAP financial measures to the most directly comparable GAAP measures. We believe EBITDA, Adjusted
    EBITDA excluding Honeywell reimbursement agreement payments, Segment Adjusted EBITDA, Adjusted Net Income, Adjusted Net Income excluding Honeywell reimbursement
    agreement payments, adjusted basic and diluted net income per share, and constant currency growth are important indicators of operating performance. For reconciliations of these
    measures to the most directly comparable GAAP financial measures to the extent that they are available without unreasonable effort, please refer to the tables above in this release. They
    should be read in connection with our financial statements presented in accordance with GAAP.

    A reconciliation of Adjusted EBITDA, Adjusted EBITDA excluding Honeywell reimbursement agreement payments, Segment Adjusted EBITDA to the corresponding GAAP measures is not
    available on a forward-looking basis without unreasonable efforts due to the impact and timing on future operating results arising from items excluded from these measures, particularly
    environmental expense, Honeywell reimbursement gain, non-operating (income) expense and stock compensation expense.

    The Honeywell Home trademark is a trademark of Honeywell International Inc. used under license to Resideo Technologies, Inc. Other brands and logos contained herein are trademarks of their respective owners.

1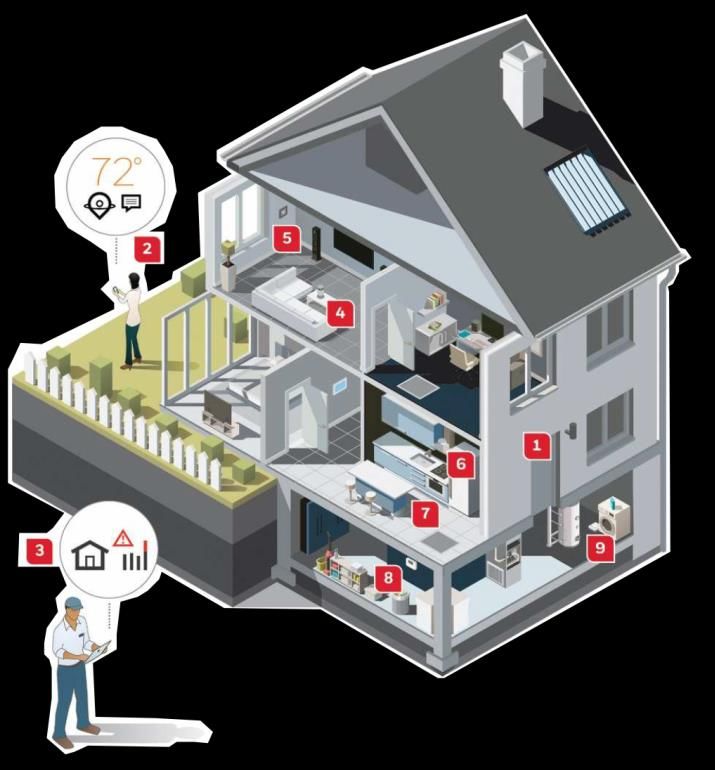
Business Overview

Resideo: Business Overview
Company Snapshot Key Facts and Figures Segment Overview
• Leading global provider of critical, residential comfort and Products Net Sales
security solutions
— Licensing agreement to use brand for 2018 Total Net
Products
40 years 150M 15M Sales:
100+ 45% Distribution
55% $4,827M
— Primary channel to market is professional installation, Solutions Installed
~95% of 2018 net sales Home Installed Year Heritage
Base Annually
— Maintains network of 110,000+ professional contractors, Segment Profit
3,000+ distributors,1,200+ OEMs, major retailers and online
merchants Leader Leader Distribution 2018 Total
— Currently serving 5.6M connected customers 28% Segment
Products
Profit: $529M
72%
• Leading global wholesale distributor of security and low voltage Security Systems Thermostats
products
— Customer base of 110,000+ contractors; operations across Distribution Geography Overview
17 countries
Other
— Serves as an important channel to market and provides 8% United 2018 Total Net
insight into current trends Sales:
350k+ 110k+ 200+ Europe
States
68% $4,827M
— ~85% of ADI sales are third party products Items Available
24%
Contractors ADI Stocking
• ~13,000 employees For Sale Locations
Select Customers Leader Leader Leader
Home Depot TRANE Johnstone
ADT USAA AO Smith Americas EMEA India
Global Leadership in Mission Critical Solutions and Security Distribution
3
Resideo Solutions Overview: Our Mission is to Provide a Safe, Secure,
    Efficient & Healthy Home                             On the Exterior                                                 On the Wall

                                                                 Exterior Camera, Outdoor Video, Motion                    5    Security Panel, Interior Camera, Indoor,
                                                          1
                                                                 Viewer, Perimeter Protection                                   Indoor Video, Motion Viewer, Sound
                                                                                                                                Detection, Motion Detection, Smoke
                                                                                                                                Detection, Glass break Detection, CO       Co
                                                                                                                                Detection
                                                         Behind the Wall
                                                                                                                           6    Thermostats, Life Care Telehealth
                                                                 Heating Controls, Furnace, Boiler and
                6                                          2
          7                                                      Hot Water Heater Controls                               In the Cloud

                                                           3 Humidification / Dehumidification                             7    Mobile Apps
                     5                                           Water Filtration and Treatment

                                                           4 Water Leak / Freeze Detection                                 8    AlarmNet 360

                                     1
                                 2

                             3
                                                                                           ADI Global Distribution
      8                                  4
                         2                                                                  9 Video Surveillance,
                                                                                                  Intrusion,
                                                                                                  Access Control
                                                                                                  Fire and Life                 10
                                                                                                  Safety, and
                                                                                                  Other Products,
                                                                                                  Including Wire,
                                             *Most Active SKUs
                                                                                                  Networking and
                                                                                                  Audio Visual Systems

                    Broadest Presence Supported by Leading Distribution Business

4
Resideo: Go-To-Market Channels
                                    Products                                                                  Distribution
               Resideo Comfort & Care and Security & Safety Solutions                                           Suppliers

                                       Professional Installation                                                 RemainCo                  Other Third
                                                                                         Resideo
                                                                                                                 Honeywell                   Parties
    Retail / Etail /
                            OEM             Factory Direct             Distributors
      Utilities

    Retail, Telcos,
       Utilities,           OEM
     Banks, Etail,
      Insurance

                                                                                                         Professional Installation
                                            Professional Contractors                  Security Dealers     System Integrators        Other Professional

                                               Homeowners and Small/Medium Business
                   Multi-Channel Go-To-Market Strategy with Focus on Professional Installation (DIFM)

5
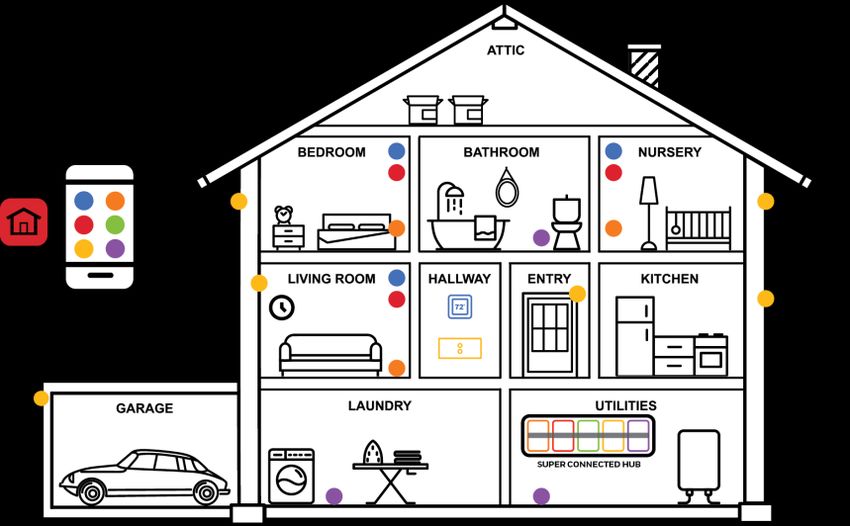
Software Ties It All Together – Resideo Ecosystem

                                                                                Software that unlocks new recurring
        Consumer in-app services offered                                      revenue business models for contractors
          on recurring revenue model

    Seamless control across connected product                                  Recurring revenue with developers and
    categories and control of 3rd party products                             participation in key smart home ecosystems

                          Software that Creates Recurring Revenue and Long Term Customers
6
2019 Q1 Financial Results
First Quarter 2019 Results

               Q1 2019                        Commentary

                           • GAAP revenue up 4%, 7% Constant Currency growth
                           • Security Business is back to growth
    Revenue     $1.22B
                           • Distribution 4% growth, 6% Constant Currency
                             growth with one less sales day

                           • $6 Million higher EBITDA than expectations due to
    Adjusted                 cost management
                $92M
    EBITDA                 • Product mix headwinds continue with rollout of new
                             platforms

                           • GAAP EPS of $0.39
    Adjusted   $0.29 per
                           • Adjusted EPS exceeded expectations due to stronger
    EPS          share
                             revenue and EBITDA in Quarter

8
Business is Balanced – With Two Growing Segments:
    Products & Solutions and Global Distribution
                                     Q1 Performance ($M)                                                                             Key Highlights
                                          $551
       PRODUCTS & SOLUTIONS

                              $523                                                   •       Strong growth in security driven by launch of next generation
                                                           $117                              platform, with opportunity for margin improvement
                                                                              $81
                                                                                     •       Award-winning launch at CES of new smart thermostat
                                                                                             (T9/T10)

                                                                                     •       Improvement in supply chain execution
                              2018         2019             2018              2019
                                                                                     •       Margin compression due to mix headwinds
                                     External Revenue(1)     Adj. EBITDA(2)

                                     Q1 Performance ($M)                                                                             Key Highlights

                                          $665
     GLOBAL DISTRIBUTION

                              $642                                                   • Solid growth in the Americas and EMEA, and within
                                                                                       Security and Life Safety product categories

                                                                                     • Enhancements in digital customer experience with
                                                                                       launch of key upgrade to website
                                                            $41               $46

                                                                                         (1): External revenue is net segment revenue after the elimination of intersegment revenue. For additional information, see our appendix.
                              2018         2019             2018              2019       (2): Excludes $3 million of estimated stand-alone costs for the three months ended March 31, 2018, which is included in adjusted EBITDA (Non-GAAP).
                                                                                         Note: Please see appendix for GAAP to non-GAAP reconciliations.

                                     Revenue               Adj. EBITDA(2)

9
Resideo Segment and Market Overview
Above Market
Below Market
Addressable Market Growth Est. Resideo
At Parity Select Players
Market ($B)3 Estimate (%)3 vs. Market4
Connected • Nest (Google), Ecobee, tado, Hive, Emerson,
Products & Solutions ($2.5B)2
$1.5B +10%
Thermostats GLAS (Johnson Controls)
Traditional Flat to
Comfort $2.5B • Emerson, Lennox, Carrier, Trane
Temperature Control down
$1.7B1
IAQ and • Aprilaire, BTW, Danfoss, Watts Water Tech,
$3.7B 4-5%
Potable Water Carrier, Foobot, Awair, Molekule
Residential Thermal
$2.7B 2-3% • SIT, ebmpast, Emerson, UTC
Solutions (RTS)
• Alarm.com, Vivint, Simplisafe, Tyco, 2GIG, UTC,
Pro Security5 $2.9B 2-4%
Security Ring, Nest Secure (Google), Abode
$0.8B1
DIY Awareness $2.3B +10% • Ring (Amazon), Nest (Google), Arlo, Ooma
ADI Distribution6 $20.6B 3-4% • Anixter, ScanSource
$2.7B1
1. 2018 revenue as reported in our Annual Report on Form 10-K for the year ended December 31, 2018 filed with the Securities and Exchange Commission; 2. Includes intersegment revenue of $305M as reported in 10K; 3. Addressable market and
growth rates for 2019 in the markets and geographies that we compete in; 4. Estimated Relative performance (sales $) over the past year; 5. Pro Security is professionally monitored security including those systems that are self-installed by consumers,
e.g. Simplisafe; 6. ADI Distribution includes physical security equipment sold through distribution (video surveillance, access control, intruder alarms, video door phones, fire detection); Sources: IHS, Navigant, BSRIA, Management estimates
Growing Presence in Attractive Markets
10Programs on Track to Accelerate Growth
Profile of Business
While Improving Mix and Quality of Earnings
Connecting Consumer & Pro Progress to date on Investment and Cost Programs
Comfort Security
• President of • Cost base • Next generation • Buoy Labs
Adjacencies Water
Products & optimization security platform acquired in Q1
Indoor
Air Quality
Leak
Detection
Solutions underway, $10M • T9/T10 Room- • Expand in
• VP Mobile Apps impact in 2019 by-Room Water Safety
• VP ISC • On track for thermostats and grow
Whole Home Solutions $50M in 2020 Recurring
Revenue
Double Down on Pro / • Whisker Labs
Do-it-for-me channel
Connect Consumers With Pro Channel to Provide a Safe & Efficient, Secure
and Healthy Home
11Updated 2019 Walk Based on Q1 Performance (As of May 9, 2019)
Forecasting FY Adjusted EBITDA at the Top of Guidance Through Cost Control Actions
$ millions
Assumption
change from
$25 previous quarter:
$49 -$10m
$30 Assumption
change from
$476 previous quarter:
$30 +$10m
$20 $10
$430 Updates to Product Mix
Assumptions:
Assumption
change from • Growing new security
previous quarter:
+$10m platform and
connected thermostats
faster than expected
• Post spin inventory
2018 Adj EBITDA Volume Net Inflation Key Initiative Product Mix Market Cost Reduction 2019 Adj EBITDA clean up
Incremental Moderation
Investment
Continued Disciplined Approach to our Growth Strategy
NOTE: The Mexican Tariff Impact may be offset by some conservatism in our original guidance regarding Chinese Tariffs. In addition, we will look to pass a portion of any tariff through, in increased price.
12Adjusted Results Best Represent Underlying
Earnings of Business – GAAP Results are Volatile
Due to HON Reimbursement Agreement
Three Months Ended
31-Mar
2019 2018
(Dollars in Millions except per share data)
Net revenue $ 1,216 $ 1,165 • Activity related to the Honeywell
Cost of goods sold 903 822 reimbursement agreement is
Gross profit 313 343
reflected in the Other (Income)
Selling, general and administrative expenses 228 212
Other (income) expense, net (16) 52 Expense line
Interest expense 17 -
229 264 • The sale of a Honeywell property
under the reimbursement
Income before taxes 84 79
Tax expense 36 34 agreement resulted in a significant
Net Income $ 48 $ 45 gain in Q1
Adjustments to Net Income (1) 23 61
Adj. Net Income excluding HON reimbursement agreement (non-GAAP) 71 106 • The net impact of this entry was
Assumed cash payments related to HON reimbursment agreement (non-GAAP) (35) (35) $45 million of non-operating net
Adjusted Net Income (non-GAAP) $ 36 $ 71 income
Earnings Per Share
Basic net income per share (GAAP) / adjusted (non-GAAP) $0.39 /$0.29 $0.58 / $0.37
Diluted net income per share (GAAP) / adjusted (non-GAAP) $0.39 /$0.29 $0.58 / $0.37 • We have adjusted this item out of
results for Q1
1) Adjustments to Net Income are comprised of Environmental expense, Honeywell reimbursement agreement expense (income), Estimated stand-alone costs,
Stock compensation expense, Repositioning charges, Other and Income tax adjustments; for full reconciliation of net income (unaudited) to adjusted net income
(Non-GAAP) see table in appendix
13Working Capital & Leverage
Working Capital Reported Leverage Pro Forma Reported
Q3 2018 Q4 2018 Q1 2019 Q3 2018 Q4 2018 Q1 2019
As Reported
Cash 184 265 212 Debt 1,225 1,201 1,196
Due from Related Parties 26 - - Cash 75 265 212
Accounts receivable 783 821 838 Net Debt 1,150 936 984
Inventory 603 628 701
Other Current Assets 72 95 111 TTM PF Adj EBITDA, inc. HON reimbursement 500 476 449
Current Assets 1,668 1,809 1,862 Leverage (Net Debt / PF Adj EBITDA) 2.3 2.0 2.2
Accounts Payable 850 964 1,013
Due to Related Parties 162 - -
Current Maturities - 22 22 • Cash usage driven by CAPEX, non-operating payments to
Accrued Liabilities 388 503 524 Honeywell and mandatory debt repayment
• Working capital source of $17 million
Current Liabilities 1,400 1,489 1,559
• Leverage increased 0.2 turns on lower cash, lower TTM EBITDA
Net Working Capital 268 320 303
Change in Net Working Capital 52 (17)
Note: Please see appendix for GAAP to non-GAAP reconciliations.
Sufficient Liquidity on Balance Sheet Supported by $350M Revolver
14Resideo Reiterates 2019 Full Year Guidance (As of May 9, 2019)
2019)
MARCH 2019 MAY 2019
Organic Growth 2-5% in 2019 / 7 – 10% in 2023 2-5% in 2019 / 7 – 10% in 2023
$410M – $430M EBITDA Range $410M – $430M EBITDA Range
Top End of the Range
Adjusted EBITDA ~11% excl. HON reimbursement agreement payments / ~11% excl. HON reimbursement agreement payments /
Range and Margin ~8% incl. HON reimbursement agreement payments ~8% incl. HON reimbursement agreement payments
EBITDA Profile: 40% 1H ‘19 – 60% 2H ‘19 EBITDA Profile: 40% 1H ‘19 – 60% 2H ’19
Capital Expenditures /
Capital Expenditures at ~1% of Revenue / Capital Expenditures at ~1% of Revenue /
Research &
Research and Development Expenses of ~$135M Research and Development Expenses of ~$135M
Development
Tax Rate / $ ~31 – 32% Cash Tax Rate $75 million
Prioritizing growth and deleveraging over capital return in Prioritizing growth and deleveraging over capital return in
Capital Return
2019 2019
Balance Sheet Funding Growth with Existing Liquidity; Funding Growth with Existing Liquidity;
Priorities Targeting Long-Term Gross Leverage ~2x Targeting Long-Term Gross Leverage ~2x
15Resideo: Positioned to Drive Growth
Solid start to the year Cost and investment Strong financial position
programs on track with healthy balance sheet
Well-Positioned to Gain Market Share and Drive Profitable Growth
16Appendix 17
Reconciliation Of Net Income (Unaudited)
     To Adjusted Net Income (Non-GAAP)

     (1)   Represents historical environmental expenses as reported under 100% carryover basis.
     (2)   Represents gain recorded net of expenses, related to the Honeywell Reimbursement Agreement.
     (3)   Represents the difference between our estimate of Selling, general and administrative costs as a stand-alone company and historical allocated costs.
     (4)   Stock compensation expense adjustment includes only non-cash expenses.
     (5)   Represents $19 million in cost directly related to the Spin-Off and ($1) million in non-operating (income) expense adjustment which excludes net interest (income) for the three months ended March 31, 2019.
     (6)   Represents the tax effect of pre-tax items excluded from Adjusted Net Income and the removal of discrete tax items, including the income tax impacts of the Tax Act. The tax effect of pre-tax items excluded from Adjusted Net Income is computed using the
           statutory rate related to the jurisdiction that was impacted by the adjustment after taking into account the impact of permanent differences and valuation allowances.
     (7)   Pursuant to the Honeywell Reimbursement Agreement, we are responsible to indemnify Honeywell in amounts equal to 90% of payments, which include amounts billed, with respect to certain environmental claims, remediation and, to the extent arising after the
           Spin-Off, hazardous exposure or toxic tort claims, in each case including consequential damages in respect of specified properties contaminated through historical business operations, including the legal and other costs of defending and resolving such liabilities,
           less 90% of Honeywell’s net insurance receipts relating to such liabilities, and less 90% of the net proceeds received by Honeywell in connection with (i) affirmative claims relating to such liabilities, (ii) contributions by other parties relating to such liabilities and (iii)
           certain property sales; such payments will be subject to a cap of $140 million in respect of liabilities arising in any given year (exclusive of any late payment fees up to 5% per annum).

18
Reconciliation Of Net Income (Unaudited)
To Adjusted EBITDA (Non-GAAP)
(1) Represents historical environmental expenses as reported under 100% carryover basis.
(2) Represents gain recorded, net of expenses related to the Honeywell Reimbursement Agreement.
(3) Represents the difference between our estimate of Selling, general and administrative costs as a stand-alone company and historical allocated costs, which excludes corporate depreciation charges
(4) Stock compensation expense adjustment includes only non-cash expenses.
(5) Represents $19 million in cost directly related to the Spin-Off and ($1) million in non-operating (income) expense adjustment which excludes net interest (income) for the three months ended March 31, 2019.
(6) Pursuant to the Honeywell Reimbursement Agreement, we are responsible to indemnify Honeywell in amounts equal to 90% of payments, which include amounts billed, with respect to certain environmental claims, remediation and, to the extent arising after the
Spin-Off, hazardous exposure or toxic tort claims, in each case including consequential damages in respect of specified properties contaminated through historical business operations, including the legal and other costs of defending and resolving such liabilities,
less 90% of Honeywell’s net insurance receipts relating to such liabilities, and less 90% of the net proceeds received by Honeywell in connection with (i) affirmative claims relating to such liabilities, (ii) contributions by other parties relating to such liabilities and (iii)
certain property sales; such payments will be subject to a cap of $140 million in respect of liabilities arising in any given year (exclusive of any late payment fees up to 5% per annum).
19Additional Points Regarding Fluid Tariff Environment
• Proposed tariffs primarily impact Products & Services segment
• Approximately 60% of our manufacturing is out of Mexico
• Global production footprint provide some ability to shift production
• Currently, management would consider moving production only if tariffs exceed 10%
• May 9, 2019 guidance included conservative expectation of impact of China tariffs; does not
include Mexico tariffs
• Conservativism of impact of China tariffs may offset impact of Mexico tariffs
• Will look to pass through a portion of tariff in increased pricing
20You can also read