Eviction Risk in Nevada - July 2020
←
→
Page content transcription
If your browser does not render page correctly, please read the page content below
Eviction Risk in Nevada

July 2020

Eviction risk manifests in two ways
1   Long-term income loss:                           2   Short-term cash flow problems:

    ❑   Federal and state benefits are limited           ❑   Benefits are delayed or arrive
        and/or unavailable (e.g., undocumented               inconsistently, creating cash flow
        workers, contract / gig workers, long-term           problems
        unemployed workers, etc.)
                                                         ❑   For several benefit programs, there
    ❑    Housing costs (and other expenses) may              is a cliff effect, meaning that
         exceed monthly income (and benefits --              benefits may not significantly
         for which there may be a “cliff effect”)            increase income

    ❑   Reemployment prospects may be limited,           ❑   An unexpected medical or family
        and benefits are expected to expire this             expense may place short-term
        summer, before a full economic recovery              pressure on cash availability
        with full employment
Between 272,000-327,000 Nevadans (or 118,000-142,000
households) could struggle to pay their rent by September 2020

  Nevada Tenants Eviction Risk by Sept 2020                                         Low-income individuals, people of color, and
  # of people in rented housing at risk of eviction                                 undocumented individuals are especially vulnerable
                                                                                    to housing market disruptions

                                                                          272,000-327,000

                                                                                                                 1,260,000
                            990,000

                 Tenants with limited /                           Tenants at risk of eviction            Total NV tenant population
                    no eviction risk                                 through Q3 2020

Source: COVID-19 Eviction Defense Project (CEDP) Model, 6/5/2020. See Methodology Page for Details.
Nevada will likely experience a surge in evictions when eviction
moratoria expire (on 08/31/2020)
Nevada Tenants Eviction Risk (2020) 38% Renter Unemployment 06-’08 3-Yr Avg. filings
32% Renter Unemployment 14-’16 3-Yr Avg. filings
# People
400,000
350,000 327,000
311,000
300,000 272,000
259,000
250,000
200,000
141,000
150,000
118,000
100,000
69,000
51,000
50,000 34,000
55,000
41,000
0 28,000
Apr ’20 May ’20 Jun ’20 Jul ’20 Aug ’20 Sep ’20 Oct ’20 Nov ’20 Dec ’20
Source: COVID-19 Eviction Defense Project Model, 6/5/2020. See Methodology Page for Details; Eviction Lab Nevada eviction filing data, scaled to have same
denominator (renter households). Note: COVID-19 EDP model includes evictions, eviction filings, and cases where tenants move to avoid an eviction filing.The COVID-19 eviction crisis will have 3 phases; of the ~300K Nevadans at risk of
eviction, people of color, low-income & undocumented renters are most vulnerable
Nevada Tenants Eviction Risk (2020) 38% Renter Unemployment
# People 32% Renters Unemployed
Vulnerable When Savings
Vulnerable Once & Credit Run Out
Enhanced UI Expires
400,000
350,000
Vulnerable Once
300,000 Moratorium Expires
250,000
200,000
150,000
100,000
50,000
0
Apr ’20 May ’20 Jun ’20 Jul ’20 Aug ’20 Sep ’20 Oct ’20 Nov ’20 Dec ’20
• Non-Citizens • African American & Latino/a communities • Families with savings and access to credit
At Risk • Citizens unable to access unemployment • Lower-income citizens w/ low savings after enhanced UI expires
insurance (UI) & stimulus without savings • Middle-income families paying high-rents with • Lower-middle income families that saved
Groups • African American & Latino/a Communities savings or access to credit UI and stimulus above typical income
• Middle- and moderate-income individuals & • Families with low savings or access to credit • Multi-income families
families with high rental cost burdensNevada rental debt could be between $900M-$1.1B by
2020 if economic conditions remain unchanged
Nevada Tenant Rental Debt (2020) 38% Renter Unemployment
32% Renter Unemployment
$
1,089,000,000
1,100,000,000
1,000,000,000
900,000,000 908,000,000
800,000,000
700,000,000
600,000,000 566,000,000
500,000,000 472,000,000
400,000,000
300,000,000 154,000,000
200,000,000 128,000,000
100,000,000
0
Apr ’20 May ’20 Jun ’20 Jul ’20 Aug ’20 Sep ’20 Oct ’20 Nov ’20 Dec ’20
Source: COVID-19 Eviction Defense Project Model, 6/5/2020. See Methodology Page for Details.Every county in Nevada is likely to experience an increase in evictions Nevada Eviction Risk by County, September 2020 Number in Renter Households # people Number at Risk of Eviction Clark County 249,700 Washoe County 49,300 Carson City 6,600 Douglas County 4,200 Lyon County 4,200 Nye County 3,800 Elko County 3,400 Churchill County 2,400 Counties with
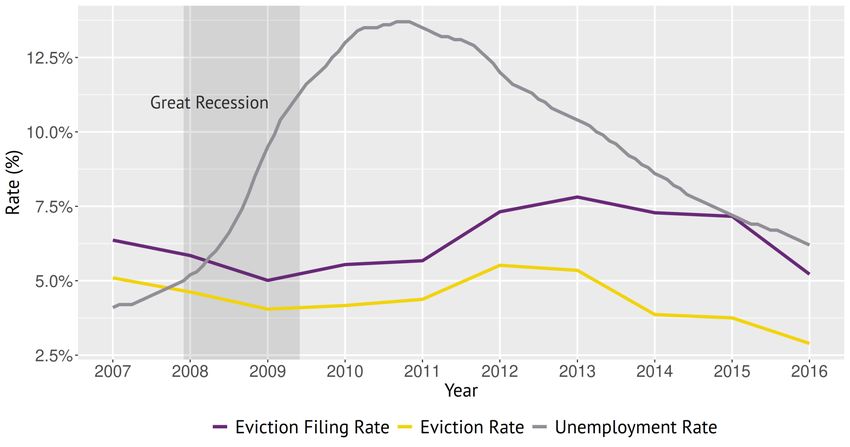
Historical data reveals evictions increased in Nevada as
unemployment declined, and the economy began to recover

Source: Guinn Center calculations, using data from EvictionLab.org and U.S. Bureau of Labor Statistics
While eviction moratoria temporarily protect tenants, evictions
are expected to significantly increase when they expire
 Currently, eviction moratoria:            When eviction moratoria expire:

 ❑   Delay eviction proceedings in court   ❑   Landlords will be able to immediately
                                               begin eviction proceedings against
 ❑   Stop sheriffs from removing tenants       tenants who have been unable to pay
     from their homes
                                           ❑   Landlords will be able to sue tenants for
 ❑   Create incentives for landlords and       unpaid rent
     tenants to negotiate payment
     agreements                            ❑   Tenants who have been unable to pay
                                               will face displacement and debt
 ❑   Allow local governments to stand up
     rental assistance programs to         ❑   Tenants may have damaged credit
     distribute CARES Act funds                history that could make it harder for
                                               them to secure housing
The number of potential evictions threatens the stability of the housing
market & suggests the need for additional federal assistance
Further financial support for Protect tenant and landlord Property tax support for state
tenants and landlords credit and local governments
❑ Provide additional cash ❑ Seal records of non- ❑ Leverage CARES Act and
support to both tenants payment evictions and future relief funds to
and homeowners to extend eviction filings from provide further cash
the ability to pay beyond credit agencies and support for state and
reopening of the economy landlords through 2020 local governments
confronting significant
❑ Leverage CARES Act and ❑ Beyond 2020, seal records declines in property taxes
future rent relief funds for of non-payment evictions
rental assistance with an and eviction filings from
emphasis on vulnerable credit agencies and
tenants and small/ landlords for any COVID-
medium-sized landlords 19 health related matterState & local policymakers can take immediate action to protect
tenants in the short-term
Short-term action
Establish mediation ❑ Nevada’s enforceable, statewide moratorium expires on August 31, 2020
1 program for tenants and ❑ Create a statewide mediation program that will allow tenants and landlords to work
landlords out repayment plans
2 Suspend summary ❑ Suspend summary evictions for failure to pay rent through December 31, 2020
evictions
3
❑ Suspending late fees through 2020 would lessen the financial impact of non-payment
Suspend late fees
and allow more tenants to catch up on money owed to their landlords
❑ Increase penalties for landlords who illegally lock out tenants or make premises
4 Increase penalties for
unlivable during moratoria with oversight and monitoring by the Nevada Attorney
illegal lockouts
General’s OfficeContact
About the Guinn Center About COVID-19 Eviction Defense Project
The Guinn Center is a 501(c)(3) nonprofit, The COVID-19 Eviction Defense Project aims to
nonpartisan, independent research center that stop mass evictions and homelessness in the
seeks to identify evidence-based solutions wake of the COVID-19 crisis by pairing lawyers
through research, public engagement, and with tenants facing evictions, developing
strategic partnerships. rigorous economic analyses to inform the
discussion, and devising policies and innovative
solutions that keep Americans housed.
Contact information: Contact information:
Nancy Brune, Ph.D., Executive Director Sam Gilman, Co-Founder
Meredith Levine, Director of Economic Policy Email: sam.gilman44@gmail.com
Dan Liden, Director of Data Analytics
Guinn Center
P.O. Box 750117
Las Vegas, Nevada 89136
Email: info@guinncenter.org
© 2020 Guinn Center for Policy Priorities. All rights reserved.Methodology
The COVID-19 Eviction Defense Project Model predicts, by state and by month, how many people will run out Importantly, the base case of the model predicts a recovery, assuming that 25% of unemployed
of money based on job loss during the pandemic. It allows us to project three different unemployment renters return to work by the end of the year.
scenarios among renters: 20%,1 25%,2 and 30% .3 Effective, total unemployment (including renters and
homeowners) topped out at 20% in April,4 and the Census Bureau’s housing pulse survey indicates that 30% Beyond renter unemployment rate, cost burden, rents, and timing of job losses, five inputs drive the
missed last month’s rent or mortgage payment, or have slight or no confidence that their household can pay model, particularly the timing that people run out of money. We aim to model more conservative
next month’s rent or mortgage on time.5 State unemployment risk is scaled based on Terner Center’s assumptions to account for unobservable, unmodelable facts.
analysis of the number of renter households with at least one worker in an industry at high risk of job loss, 6
including “Food Service; Entertainment; Mining and Extraction; Non-Essential Manufacturing; Non-Essential 1. Percentage of people with no access to UI based on Ben Zipperer & Elise Gould’s Economic Policy
Retail; Non-Essential Travel, Transportation, and Tourism; Other Services.”7 Based on American Housing Institute Survey, which provides inputs of 10%, 15%, 27% or 36% of people who cannot access UI,
Survey, our analysis assumes that one third of seniors work. and the New York Times’ coverage of unemployment filings. 13 This model also accounts for the at
least 6.7% of residents over the age of 18 who are non-citizens (American Community Survey). 14,15
The model evaluates the effect of CARES Act stimulus payments by family type, enhanced unemployment for
three months, and state unemployment (including different weekly UI caps) on family budgets. It cuts the
2. Percentage of people who can weather a 3- month cash emergency, as measured by Urban
data based on 13 family types to ensure that we accurately allocate stimulus funds, 5 income tiers, the
number of income earners, 3 levels of cost-burden, and citizenship status. Average income assumptions by
Institute data. This is likely to be a very conservative assumption, given that the Fed's 2016 Consumer
state come from the American Community Survey and are presented in 2019 dollars.8 Financial Survey indicates far lower savings amounts, but we included it to account for people who
had enough savings, access to credit, family support, or could otherwise find additional funds to cover
We analyzed family budgets on a household level. Our base data source is CHAS Table 7, as our source data a cash emergency. 16
by state.9 This enabled us to establish household income tiers, by family type, by cost-burden, and by state.
From there, we used AHS data to differentiate by family type and size. We needed to do this in order to 3. Percentage of benefits above pre-surplus income saved for future months: 20%. This is a
establish different budgets for two-income families compared to single-income families and to allocate the conservative assumption given that families can project uncertainty with reemployment. Based on
stimulus by family size. We further differentiated these ratios by household income tier using AHS data. After EITC spending, families typically only save 10% of EITC checks 6 months after payment, with 65%
establishing these ratios, e.g., the percentage of single families with two children using 2015 AHS data, we being spent in the first month or on repaying debts according to a study by Washington University in
assumed the same ratios held for 2019 and multiplied this ratio by the 2019 population. We establish St. Louis. 17
average rents by calculating the median housing cost to income ratio (HCIR).
4. Percentage of non-rent income that can be cut (by income tier). The assumption is based on the
For each Household Area Median Family Income (HAMFI) tier, we use CHAS Table 7 data to tabulate the Economic Policy Institute's family budget calculator.18 It considers semi-variable (in a pandemic)
percentage of people who are not cost burdened, the percentage who are moderately burdened, and the expenses like food, transportation, and childcare. The assumption is also likely conservative, as these
percentage who are severely burdened by family type.10 We assume these ratios remained the same cuts account for drastic sacrifices like reducing food intake and choosing not to pay other bills.
between 2016 and 2019. Using median HCIR data provided by the National Low Income Housing Coalition,
we then calculate the median burden for this group, giving us the median rents by HAMFI tier and cost-
5. Percentage of income covered by state UI (absent federal enhancement). This assumption is
burden level.11
applied up to state UI caps, using Nevada’s rate of 60% of income replaced by state UI, which is likely
The month in which someone runs out of money is based on the CBO's projections of the distribution of job
a conservative assumption as replacement is often 50% or less of a person’s income. The fifty-state
losses over time and observation about unemployment claims.12 For example, we project that 20% of total UI maximum payment information came from the U.S. Department of Labor.19
lost jobs occur in March, 45% in April, 20% in May, and 15% more over the course of the summer and
beyond. We account for situations where families have savings or temporary government benefits exceed Several other assumptions are important to note: we calculate that the average renter family size is
family income. These situations effectively delay eviction risk -- the moments where families run out of 2.3 compared to an average family size of 2.53 based on 2018 American Housing Survey. We also
money. scaled incomes and rents to 2019 $ using BLS data on wage growth.Sources 1. Jason Furman & Wilson Powell, The US unemployment rate is higher than it looks—and is still high if all furloughed workers returned, Peterson Institute for International Economics (June 5, 2020), https://www.piie.com/blogs/realtime-economic-issues-watch/us-unemployment-rate-higher-it-looks-and-still-high-if-all. 2. Michael Leachman, Projected State Shortfalls Grow as Economic Forecasts Worsen, CENTER ON BUDGET AND POLICY PRIORITIES (May 20, 2020), https://www.cbpp.org/blog/projected-state- shortfalls-grow-as-economic-forecasts-worsen. 3. Miguel Faria-e-Castro, Back-of-the Envelope Estimates of Next Quarter’s Unemployment Rate. FEDERAL RESERVE BANK OF ST. LOUIS (Mar. 24, 2020), https://www.stlouisfed.org/on-the- economy/2020/march/back-envelope-estimates-next-quarters-unemployment-rate. 4. Furman & Powell supra note 1. 5. U.S. Census Bureau, Household Pulse Survey (last accessed June 15, 2020) (tables 2a & 2b), https://www.census.gov/data/tables/2020/demo/hhp/hhp5.html. 6. Elizabeth Kneebone & Cecile Murray, Estimating COVID-19’s Near-Term Impact on Renters, TERNER CENTER FOR HOUSING AND INNOVATION, University of California (May 25, 2020), https://ternercenter.berkeley.edu/blog/estimating-covid-19-impact-renters (discussing at risk industries). 7. Id. 8. U.S. Census Bureau, American Consumer Survey, Median Household Income the Last 12 Months (2018). https://data.census.gov/cedsci/table?y=2018&tid=ACSDT1Y2018.B25119&t=Income%20and%20Poverty%3AOwner%2FRenter%20%28Tenure%29&hidePreview=true&vintage=2018&g=0 100000US.04000.001. 9. U.S. Department of Housing and Urban Development, Comprehensive Housing Affordability Strategy (2012-2016), HTTPS://WWW.HUDUSER.GOV/PORTAL/DATASETS/CP.HTML. 10. Id. 11. Median HCIR Data by State (unpublished data) (on file with the author) (tabulated by National Low Income Housing Coalition). 12. See PHILIP SWAGEL, CONG. BUDGET OFF., CBO’S CURRENT PROJECTIONS OF OUTPUT, EMPLOYMENT, AND INTEREST RATES AND A PRELIMINARY LOOK AT FEDERAL DEFICITS FOR 2020 AND 2021, (Apr. 24, 2020), https://www.cbo.gov/publication/56335. 13. See Ben Zipperer & Elise Gould, Unemployment Filing Failures: New Survey Confirms that Millions of Jobless Were Unable to File an Unemployment Insurance Claim, Economic Policy Institute (Apr. 28, 2020), https://www.epi.org/blog/unemployment-filing-failures-new-survey-confirms-that-millions-of-jobless-were-unable-to-file-an-unemployment-insurance-claim/; See also Emily Badger & Alicia Parlapiano, States Made It Harder to Get Jobless Benefits. Now That’s Hard to Undo, N.Y.TIMES (Apr. 30, 2020), https://www.nytimes.com/2020/04/30/upshot/unemployment-state-restrictions-pandemic.html. 14. U.S. Census Bureau, American Community Survey (2018) (last accessed May 30, 2020), https://data.census.gov/cedsci/table?q=United%20States&g=0100000US.04000.001&tid=ACSDP1Y2018.DP05&vintage=2018&hidePreview=true&moe=false&tp=false 15. U.S. Census Bureau, American Housing Survey (last accessed May 30, 2020), https://www.census.gov/programs- surveys/ahs/data/interactive/ahstablecreator.html?s_areas=00000&s_year=2017&s_tablename=TABLE1&s_bygroup1=13&s_bygroup2=2&s_filtergroup1=1&s_filtergroup2=1 16. Jung Hyun Choi, Laurie Goodman, & Jun Zhu, We Must Act Quickly to Protect Millions of Vulnerable Renters, Urban Institute (Mar. 25, 2020), https://www.urban.org/urban-wire/we- must-act-quickly-protect-millions-vulnerable-renters. 17. Mathieu Despard et. al., Do EITC Recipients Use Tax Refunds to Get Ahead? New Evidence from Refund to Savings, Center for Social Development, Wash. U. (CSD Research Brief No. 15- 38, Jan. 2015), https://openscholarship.wustl.edu/cgi/viewcontent.cgi?article=1589&context=csd_research 18. Economic Policy Institute, Family Budget Calculator (last accessed May 30, 2020), https://www.epi.org/resources/budget/. 19. U.S. Department of Labor, Significant Provisions of State Unemployment Laws (Jan. 2020), https://oui.doleta.gov/unemploy/content/sigpros/2020-2029/January2020.pdf.
You can also read