The Hidden Impacts of Vehicle Parking and Parking Policy - APRIL 2021 - MOVEMN.ORG
←
→
Page content transcription
If your browser does not render page correctly, please read the page content below
The Hidden Impacts of
 Vehicle Parking and
    Parking Policy
        APRIL 2021

        MOVEMN.ORG
I. INTRODUCTION
Parking lots, towers, and garages are ubiquitous in American cities. This is the result, in part, of mandatory
minimum parking requirements present in many zoning codes. These requirements stem from the
expectation that a person be able to drive to and from anywhere and park their car for relatively cheap if
not completely free.

Minneapolis is no exception: local ordinances mandate a minimum number of parking spaces for many
real estate development projects. These required parking spaces occupy land, cost money to construct,
encourage people to drive, increase greenhouse gas emissions, and increase economic and racial
disparities.

The Minneapolis 2040 Plan, approved in 2018, established a policy to “eliminate the requirement for
off-street parking minimums throughout the city.”1 Similarly, the City of Saint Paul established a policy to
“Reduce or eliminate citywide minimum parking requirements” in its Climate Action & Resilience Plan.2
Both cities are now in the process of implementing these policies in city code. This paper illustrates the
effect of parking requirements (and lack of parking maximums) in Minneapolis to inform both Minneapolis
and Saint Paul’s decision-making processes around parking reform.

This report looks the impact of a single year’s worth of parking space approvals in Minneapolis. The
report finds that one year’s worth of Minneapolis parking approvals—about 6200 spaces—equals:

 >         Space — 940,000 square feet of surface area—enough to completely cover 16 football
           fields every year!

 >         Cost — $105 million in construction costs—enough to fund two new Bus Rapid Transit lines
           every year!

 >         Climate Pollution — Over 21,000 metric tons of CO2 emitted every year due to trips
           incentivized by parking availability!

 >         Inequity — harm to lower income communities and communities of color.

This report is intended to provide context and perspective for decision makers and residents in the Twin
Cities as they consider parking code and policy reforms.

1 Minneapolis 2040 Plan, Policy 6 (2018), https://minneapolis2040.com/policies/pedestrian-oriented-building-and-site-design/.
2 Saint Paul Climate Action & Resilience Plan (Dec. 2019), page 56, https://www.stpaul.gov/sites/default/files/Media%20Root/
Mayor%27s%20Office/Saint%20Paul%20Climate%20Action%20%26%20Resilience%20Plan.pdf.
II. BACKGROUND: PARKING DATA For the purposes of this study, Move Minnesota assumes approximately 6200 parking spaces are approved in the City of Minneapolis each year. Move Minnesota arrived at this figure by reviewing all Minneapolis City Planning Commission development applications over a six-month period in quarters two and three of 2020 and doubling that count. Over six months, the Minneapolis Planning Commission approved forty-eight development applications. These applications included 3118 parking spaces. Of these approved parking spaces, 864 spaces were surface-lot spaces and 2254 spaces were enclosed.3 Of the 3118 parking spaces approved, 2753 were residential spaces and 365 were part of commercial projects.4 3 Enclosed spaces include both above-grade and below-grade parking spaces. 4 We define commercial broadly to include office buildings, schools, retail locations, and all other non-residential uses.
III. PARKING: THE SPACE IT TAKES
Parking takes up a lot of space. And there is a lot of it. Although there has not been a comprehensive
inventory of the number of parking spaces in Minneapolis or Saint Paul, a study of peer cities found
between five and nineteen parking stalls per household in those cities.5

Yet we keep adding parking and it keeps taking up space. Based on Move Minnesota’s parking counts,
Minneapolis approves just shy of one million square feet of space dedicated to parking
cars every year!!6 More than 250,000 square feet of this total is surface parking.

To put this in perspective, the ~950,000 square feet of parking approved in Minneapolis each year is
equivalent to more than:

• Sixteen football fields, or
• Forty-three First Avenue venues (or 950 Main Room dance floors!).

Or, to put it another way, if you lined up all the annually-approved parking stalls end to end, they would
extend 21 miles—that’s farther than the distance between the Minnesota State Capital and Hudson,
Wisconsin… a whole other state!

And while we are perhaps not sacrificing music or sports venues when we build this much parking, we
do likely sacrifice housing and work space. This is because buildings can only be so big under a zoning
code. Thus, if significant space is dedicated to parking within that limited building envelope, that parking
area cannot be used for the primary purpose of the building, whether providing housing, office, or other
uses.

To put this in context, the average apartment size in Minneapolis is 786 square feet.7 At 786 square feet,
if developers in Minneapolis replaced parking spaces with apartments—potentially literally feasible given
the inclusion of parking in residential building envelopes—the city could see just shy of 1200 additional
apartments constructed each year.8

5 Eric Scharnhorst, Quantified Parking: Comprehensive Parking Inventories in Five Cities, Research Institute for Housing America (May
2018). Seattle, WA, has 5.2 parking stalls per household; De Moines, IA, has 19.4 parking spaces per household. Other cities in the
study (New York, Philadelphia, and Jackson, WY) were less comparable to Minneapolis.
6 Minneapolis parking area design specifications require standard parking stalls be 8 feet 6 inches wide and 18 feet deep, which equals
153 square feet per parking space. 153 ft2 X 6200 spaces = 949,600 total square feet. (This number does not include drive aisles in lots
and garages, which can often take up around a third of the lot area depending on the angle of the stalls, whether the aisles are one way
or two, etc.—the 950,000 ft2 used in the examples is a deliberately conservative number.)
7 RentCafe (last viewed Nov. 2020), https://www.rentcafe.com/average-rent-market-trends/us/mn/minneapolis/.
8 As an aside, not all parking spaces can be converted to residential units post-construction: the ceilings in garages are often lower than
those in apartments, and some parking is constructed on an incline while residential units are not. Further, the average apartment square
footage does not include hallway and lobby spaces. However, given how conservative our estimate for the total parking square footage
built in Minneapolis (see footnote 6), 1200 units is a reasonable approximation.
IV. PARKING: THE MONEY IT TAKES
Parking spaces are not cheap to build: the average surface space costs between $5,000-$10,000 to
construct,9 while structured parking can cost $20,000 to more than $50,000 to build.10 In Minneapolis,
this means the development community spends upward of $100 million on parking every single
year.11

Money spent on building parking is money unable to be spent on other potential infrastructure or
benefits. For example, to complement the analysis in Part III of this report, $100 million could pay for the
construction of 636 residential units, assuming the average unit size of 786 square feet and $200 per
square foot construction costs for mid-rise buildings.12

Or, at least as relevantly, $100 million could support alternative transportation options for tenants in
individual developments or for the community at large. For example, $100 million could pay for one
year’s worth of unlimited Metro Transit fares for more than 69,000 people—that’s the equivalent of free
transit for everyone in the city of St. Cloud, Minnesota!13 Or, if the money were spent on infrastructure,
those parking costs could support construction of two Bus Rapid Transit lines every single year!14

In short, there is an opportunity cost to building parking in Minneapolis that directly implicates people’s
ability to live and travel in the city.

9 Transportation Cost and Benefit Analysis II, Victoria Transit Policy Research Institute (March 20, 2020), https://www.vtpi.org/tca/
tca0504.pdf.
10 Above-grade parking (parking above the ground) is typically less to construct than below-grade parking: $24,000 vs $34,000 per
space respectively nationwide. But these numbers may under-estimate the cost of parking: The GAO found that parking adds $56,000 to
the cost of a housing unit (Low Income Housing Tax Credit, Government Accountability Office (Sept. 2018), page 30-31, https://www.
gao.gov/assets/gao-18-637.pdf). For purposes of staying conservative in our data analysis, we use $21,500 per enclosed parking
space for our calculations (see Parking Structure Cost Outlook for 2019, WGI https://wginc.com/parking-outlook/).
11 In Q2 and Q3 of 2020, the Minneapolis Planning Commission approved the construction of 864 surface spaces. Using $5,000
as the cost of a surface space, this totals to $4.32 million dollars worth of spaces. Add to that the 2254 stalls of structured parking at
$21,500 per space (for a total of $48.5 million in construction costs) and the six-month-worth-of-spaces total comes to $52.8M, or over
$100 million annually in parking construction costs. Operations and maintenance costs for parking are not included in these numbers.
12 See Hannah Hoyt, More for Less? An Inquiry into Design and Construction Strategies for Addressing Multifamily Housing Costs, Har-
vard Joint Center for Housing Studies (March 2020) page 23 for housing cost estimates (https://www.jchs.harvard.edu/sites/default/
files/media/imp/harvard_jchs_gramlich_design_and_construction_strategies_multifamily_hoyt_2020_3.pdf). At $200 per square foot,
the average housing unit on Minneapolis costs $157,200 to build.
13 An unlimited monthly Metro Transit pass in 2021 is $120, making the annual cost $1440.
14 The C-Line BRT cost $37M; the B-Line cost 54M.
V. PARKING: THE EMISSIONS IT MAKES
In addition to direct costs, constructing parking imposes costs on society by encouraging driving. Parking
encourages driving though a phenomenon called “induced demand,” in which the easier it is to drive a
car—whether because of increased road capacity or increased parking capacity—the more likely people
are to drive, either instead of using alternate transportation modes or through an increase in trips.15

Increased driving creates a host of negative impacts, including increasing greenhouse gas emissions.16
The transportation sector is the State of Minnesota’s highest source of climate pollution, and cars and
other personal vehicles are responsible for the majority of these emissions.17

Move Minnesota found that the car travel induced by the 6200 parking spaces approved in one year
was substantial, and that the corresponding emissions increase was also substantial. Importantly, all
parking spaces considered for the study are in Minneapolis, a city (like St. Paul) reasonably well served
by transit, walking, rolling, and bicycling alternatives, which means that alternative ways of getting
around exist if driving is not encouraged.

First, Move Minnesota’s analysis assumed that a reduction in parking spaces at commercial locations
would primarily impact people’s choice of commutes, rather than people’s decisions to own an
automobile.18 Move Minnesota’s analysis revealed an estimated annual increase of 840 metric tons of
greenhouse gases generated from one year’s worth of parking approvals.19

15 For a fuller explanation of induced demand, see Driving Down Emissions, Transportation for America (2020), page 12 (https://
smartgrowthamerica.org/wp-content/uploads/2020/10/Driving-Down-Emissions-FINAL.pdf). For an overview of induced demand
generated by parking, see Eric Jaffe, The Strongest Case Yet that Excessive Parking Causes More Driving, Bloomberg CityLab (Dec. 12,
2016) https://www.bloomberg.com/news/articles/2016-01-12/study-the-strongest-evidence-yet-that-abudant-parking-causes-more-
driving.
16 Increased driving rates also negatively impact health outcomes, increase traffic fatalities, and reduce social cohesion, among other
impacts.
 17 Greenhouse Gas Emissions Inventory 2005-2018, Minnesota Pollution Control Board, January 2021 (https://www.pca.state.
mn.us/sites/default/files/lraq-1sy21.pdf).
18 Although commercial spaces are used for customer parking in retail, for the purposes of the study each commercial space was as-
sumed to primarily service commuters driving to work.
 19 The average commuter in the Twin Cities drives 9.5 miles to work each day (Elizabeth Kneebone and Natalie Holmes, The Growing
Distance Between People and Jobs in Metropolitan America, Brookings (March 2015), https://www.brookings.edu/wp-content/up-
loads/2016/07/srvy_jobsproximity.pdf). Assuming a round trip commute five days per week, fifty weeks per year, this totals 4750 com-
mute miles driven annually. The EPA estimates that the average car emits 404 grams of CO2 per mile (Greenhouse Gas Emissions from
a Typical Passenger Vehicle, EPA (last viewed November 2020) https://www.epa.gov/greenvehicles/greenhouse-gas-emissions-typ-
ical-passenger-vehicle). At that rate, the average drive alone commuter produces 1919 kilograms of CO2 every year. Move Minnesota
estimated that every 100 commercial spaces approved would induce sixty people to commute by car. (Studies show that after charging
for parking in lieu of having it free produce a 50-60% reduction in driving rates (see e.g. David Gutman, The Not-So-Secret Trick to
Cutting Solo Car Commutes: Charge for Parking By the Day, Seattle Times (Aug. 11, 2017) https://www.seattletimes.com/seattle-news/
transportation/the-not-so-secret-trick-to-cutting-solo-car-commutes-charge-for-parking-by-the-day/); removing spaces would have a
similar if not more extreme effect.) 1919 kgs X 730 commercial spaces X 60% = 840,552 kgs, or 840 tons.
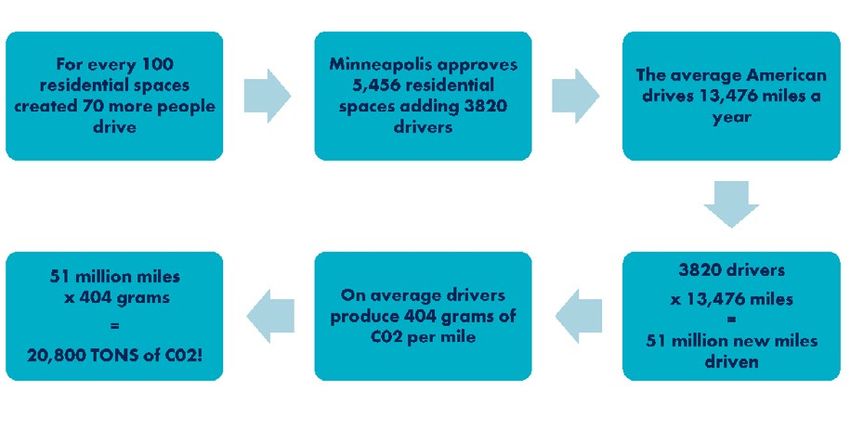
Second, Move Minnesota’s analysis assumed that a reduction in residential parking spaces would
primarily impact people’s decision to own a car at all, thereby impacting all driving trips. Move
Minnesota’s analysis revealed an estimated annual increase of 20,800 metric tons of greenhouse gas
emissions attributable to residential parking construction each year.20

In total, the estimated ongoing annual contribution of greenhouse gas emissions
attributable to one year’s parking approvals in the City of Minneapolis is over 21,500 tons
of carbon emissions. This represents a full 2% increase in induced transportation emissions across the
City of Minneapolis every year, which runs contrary to the city’s goal to reduce emissions by 30% by
2025 and thus must be counterbalanced by other emissions reduction measures.21

20 The average American drives 13,476 miles annually (Annual Miles Driven Per Driver By Age Group, Federal Highway Administra-
tion, https://www.fhwa.dot.gov/ohim/onh00/bar8.htm). Move Minnesota examined trends in new housing in other cities and estimat-
ed that for every 100 residential spaces approved, 70 people who would’ve decided to go car free drive instead (housing data from
DC and San Francisco shows that over 80% of new households are car free: Payton Chung, 88% of New DC Households are Car Free,
Greater Greater Washington (Sept. 12, 2014) https://ggwash.org/view/35905/88-of-new-dc-households-are-car-free). Thus the
5456 residential spaces approved in Minneapolis induced 70% of the holders of those parking spaces, or 3,822 people, to own and
drive a car annually. 3822 cars X 13,476 miles per year X 404 grams of CO2 emissions per mile = 20.8B grams of CO2 annually, or
20,800 metric tons of CO2.
 21 City of Minneapolis Office of Sustainability estimates that in 2018 the city released 4.3 million metric tons of CO2, approximately
one million tons of which was generated by the transportation sector (2018 GHG Update, City of Minneapolis, https://www2.minneap-
olismn.gov/media/content-assets/documents/2018-GHG-Inventory.pdf).
VI. IMPLICATIONS: RACIAL DISPARITIES AND
CLASS DISPARITIES
Parking requirements and construction carry particular costs for communities of color and lower income
community members. This is primarily because parking reenforces a series of land use, operational,
practical, and cultural systems in which car ownership is necessary to fully access opportunities. This
system is unsustainable.

Car ownership is inequitably distributed. In Minneapolis 31% of households of color do not own a car,
while only 12% of white households are carless.22 This disparity stems in part from discriminatory pricing
in auto loans and car insurance as well as the fact that non-citizen residents cannot get a driver’s license
in Minnesota.23 But even those who do not own cars ultimately pay a monetary cost for parking, whether
that cost is bundled into the cost of food (because grocery stores build and maintain parking), rent (renters
who don’t own cars pay an estimated $440 million for parking they will never use24), or other commodity
prices.25

Changing our infrastructure priorities from parking to transit, biking, walking, and rolling infrastructure
would begin to reduce these inequities.

22 Car Access, National Equity Atlas (last viewed April, 2021) https://nationalequityatlas.org/indicators/Car_access#/?-
geo=07000000002743000.
23 Fact Sheet: Driver’s Licenses for All, Immigrant Law Center (Feb 17, 2021) https://www.ilcm.org/latest-news/fact-sheet-drivers-li-
censes-for-all/.
24 C.J. Gabbe and David Pierce, Hidden Costs and Deadweight Losses: Bundled Parking and Residential Rents in the Metropolitan Unit-
ed States, Housing Policy Debate (Vol. 27, 2017) https://www.tandfonline.com/doi/abs/10.1080/10511482.2016.1205647.
25 Donald Shoup, How Parking Requirements Hurt the Poor, Washington Post (March 3, 2016) https://www.washingtonpost.com/
news/in-theory/wp/2016/03/03/how-parking-requirements-hurt-the-poor/.
VII.          CONCLUSION
This report has shown how parking takes space from housing and other uses; how parking drains money
that could be used to support sustainable and healthy transportation options and housing; how parking
generates greenhouse gas emissions at a time our communities seek and need to cut emissions; and how
parking harms lower income and communities of color.

Parking in Minneapolis is abundant and ubiquitous. Similar patterns of parking and parking development
exist in Saint Paul. Minimum parking requirements in cities’ zoning codes have contributed to the
prevalence of parking and the associated reliance on automobiles in our communities.

The results of this study show that if Minneapolis, and other cities around the state of Minnesota and
the country, were to eliminate or reduce parking requirements—while ensuring mobility for all—the
cities would have more tools to support community, create space for housing, and fund transportation
alternatives.

ACKNOWLEDGEMENTS
Gabriel Barrett, Erik Thompson, and Sam Rockwell contributed to the writing of this report.

                                 Move Minnesota is a leader in the movement for an equitable and
                                 sustainable transportation system that puts people first. We are passionate
                                 about connecting communities, ending the climate crisis, expanding access
                                 to jobs and resources, and improving daily life for Minnesotans of all
                                 ages, races, incomes, and abilities.

                                             MOVEMN.ORG
You can also read