Nitrogen dioxide hourly distribution and health risk assessment for winter season in low town of Mohammedia city, Morocco
←
→
Page content transcription
If your browser does not render page correctly, please read the page content below
The current issue and full text archive of this journal is available on Emerald Insight at:
                                     https://www.emerald.com/insight/2634-2499.htm

FEBE
1,1                                              Nitrogen dioxide hourly
                                               distribution and health risk
                                             assessment for winter season
14                                            in low town of Mohammedia
Received 7 March 2021
Revised 11 March 2021
                                                      city, Morocco
Accepted 13 March 2021
                                                                              Rachida El Morabet
                                                         LADES Lab, Department of Geography, FLSH-M,
                                                     Hassan II University of Casablanca, Mohammedia, Morocco
                                                                               Roohul Abad Khan
                                            College of Engineering, King Khalid University, Abha, Saudi Arabia, and
                                                                Soufiane Bouhafa and Larbi Barhazi
                                                         LADES Lab, Department of Geography, FLSH-M,
                                                     Hassan II University of Casablanca, Mohammedia, Morocco

                                     Abstract
                                     Purpose – Air quality and its assessment in urban areas has become a necessity. This is attributed to the
                                     increasing air pollution in urban landscape from anthropogenic activities necessary for economic growth and
                                     development. This study investigates air quality and potential health risk posed from nitrogen dioxide (NO2) to
                                     the residents of low town of Mohammedia city, Morocco.
                                     Design/methodology/approach – The NO2 concentration was measured on an hourly basis for the winter
                                     season of the year 2014, 2015 and 2016. The air quality was assessed in terms of Air Quality Index (AQI).
                                     Noncarcinogenic risk assessment was done to evaluate possible health risk to the inhabitant of low town from
                                     NO2 exposure.
                                     Findings – The maximum concentration reached 85–96 mg/m3 (at 6 p.m., 2014), 96–104 mg/m3 (7–9 p.m., 2015)
                                     and 102–117 (8–11 p.m., 2016). The AQI during maximum NO2 levels (peak hours) ranged between 0–50 mg/m3
                                     (good) to 51–100 mg/m3 (unhealthy for sensitive group). The risk quotient (RQ) was calculated for average daily
                                     intake and average hourly intake of NO2. RQ was found to be less than 1 (no potential health risk, lifetime and
                                     hourly) for all three years. However, increase in RQ value from 0.84 (2014) to 0.98 (2016) indicates increase in
                                     potential health risk. Hence, policy and measures should be adopted to reduce the potential health risk.
                                     Originality/value – This study is very first of its kind for the area and hence can serve as reference study for
                                     future works. Further studies are required to assess air pollution in other seasons (summer, spring, autumn),
                                     impact of climatic condition and parameters on air quality. Also, for direct impact assessment number of cases
                                     attributed to air pollution needs to be investigated.
                                     Keywords Average daily inhalation, Average hourly inhalation, Air Quality Index, Nitrogen dioxide,
                                     Risk quotient
                                     Paper type Research paper

                                     © Rachida El Morabet, Roohul Abad Khan, Soufiane Bouhafa and Larbi Barhazi. Published in Frontiers
                                     in Engineering and Built Environment. Published by Emerald Publishing Limited. This article is
                                     published under the Creative Commons Attribution (CC BY 4.0) licence. Anyone may reproduce,
                                     distribute, translate and create derivative works of this article (for both commercial and non-commercial
Frontiers in Engineering and Built
Environment                          purposes), subject to full attribution to the original publication and authors. The full terms of this licence
Vol. 1 No. 1, 2021                   may be seen at http://creativecommons.org/licences/by/4.0/legalcode
pp. 14-24
Emerald Publishing Limited               The paper was funded under the project scheme, Programme Ibn Khaldoun d’appui a la recherche
e-ISSN: 2634-2502
p-ISSN: 2634-2499
                                     dans le domaine des Sciences Humaines et Sociales, CNRST, MOROCCO, for project entitled “Health
DOI 10.1108/FEBE-03-2021-0012        Security in Casablanca” Project number: IK/2018/23.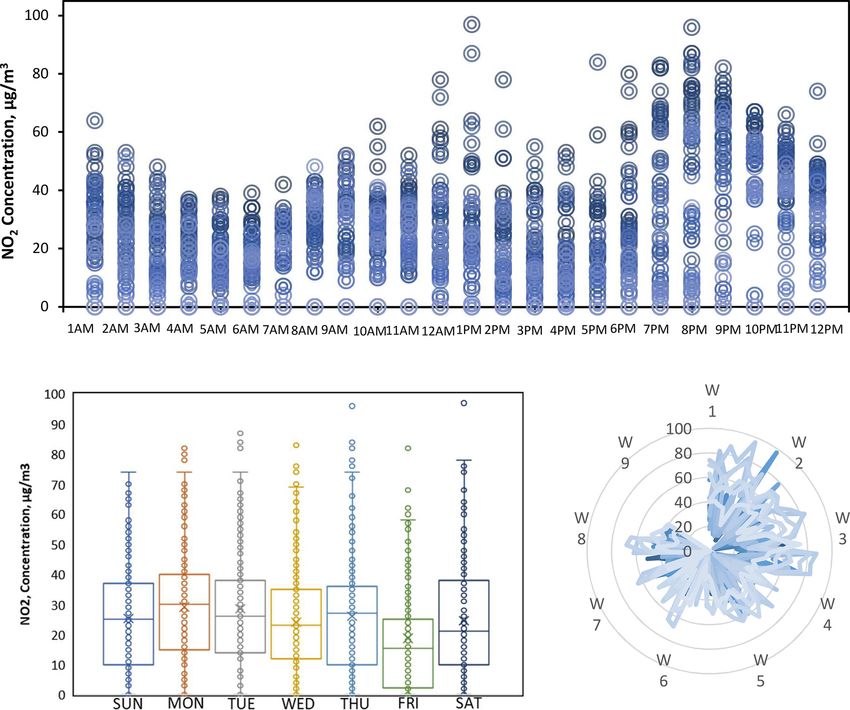
Introduction                                                                                           Air quality
Adverse health impact in urban landscapes is attributed to urban air pollution (Shi et al.,             and health
2020). In 2016, alone 4.2 million deaths were attributed to air pollution. Economy growth and
advancement contributes to increase in air pollution (Bao et al., 2021). This puts air pollution
                                                                                                       assessment
among one of the greatest risks to human health (Huang et al., 2021). The short- and long-term
effect of air pollution has been established by various epidemiology studies (Fenech and
Aquilina, 2020). Nitrogen dioxide (NO2) is among the primary pollutants contributing to
urban air pollution (Cisneros et al., 2021). The source of NO2 in urban air primarily comes from               15
combustion processes in automobiles and industries (Cisneros et al., 2021).
    This had led to a number of research works for assessing NO2 concentration worldwide.
Cisneros et al. (2021) assessed NO2 concentration during cold season in California, USA, for
the 2005–2015 duration. Burns et al. (2021) assessed NO2 concentration during coronavirus
disease 2019 (COVID-19) to determine its reduction in urban environment of Munich,
Germany. In Malaga (Spain), air quality network was designed in order to minimize adverse
environment and health impact attributed to NO2 (Lozano et al., 2009). In Seoul, Korea; an NO2
levels assessment was conducted to determine exceedance air quality pattern for a period of
1990–2000 (Kim et al., 2005). Paraschiv and Paraschiv (2019) conducted studies in two urban
areas of Romania and determine the contribution of industries and traffic to NO2 levels in
urban environment. Also, NO2 concentration was assessed in Middle Eastern and Asian
countries (Amini et al., 2019; Duan et al., 2019; Ghozikali et al., 2016; Ji et al., 2019).
Nevertheless, the literature work on North African countries especially Morocco in context to
NO2 concentration and urban air quality is still lacking.
    This not only necessitates NO2 levels assessment but also evaluation of health risks posed
by it in urban environment of Morocco. Also, NO2 has been reported to vary seasonally (Duan
et al., 2019). NO2 concentration is highly affected by local traffic condition in urban
environment. Also, the hourly distribution varies significantly during peak traffic hours.
Hence, this study assesses the hourly concentration of NO2 in low town area of Mohammedia
city to identify peak hours. This further lead to assess air quality in terms of Air Quality Index
(AQI) and evaluate health risk posed by NO2 on the urban population exposed to these
concentrations.

Methodology
Study area decsription
This study was conducted in the lower town area of Mohammedia city shown in Figure 1. The
study area is located in west side of Mohammedia city, between “Samir refinery” and “Sablet
beach”, close to the industrial areas well as the city center (epicenter of road traffic pollution),
caused by 404,648 of residents (Monographie de Mohammadia, 2015). The climate of the city
is influenced by Atlantic Ocean and experiences subhumid to semi-arid climatic conditions
(Kanbouchi et al., 2014). The average temperature of 13 8C in winter and 31 8C are experienced
during winters and summers, respectively (NOVEC, 2014).

Data collection
This work is carried out within the framework of the partnership FLSHM and DGM
“Direction de la meteorologie nationale” Morocco. The data were obtained from
meteorological station of low town of Mohammedia city. The NO2 concentration was
measured on an hourly basis in this study. The study duration was for three consecutive
winter season of the year 2014, 2015 and 2016 (see Table 1). The NO2 levels were assessed
based on the hourly concentration, daywise hourly concentration and weekly hourly
concentration. The hourly concentration was chosen as in urban environment traffic volumes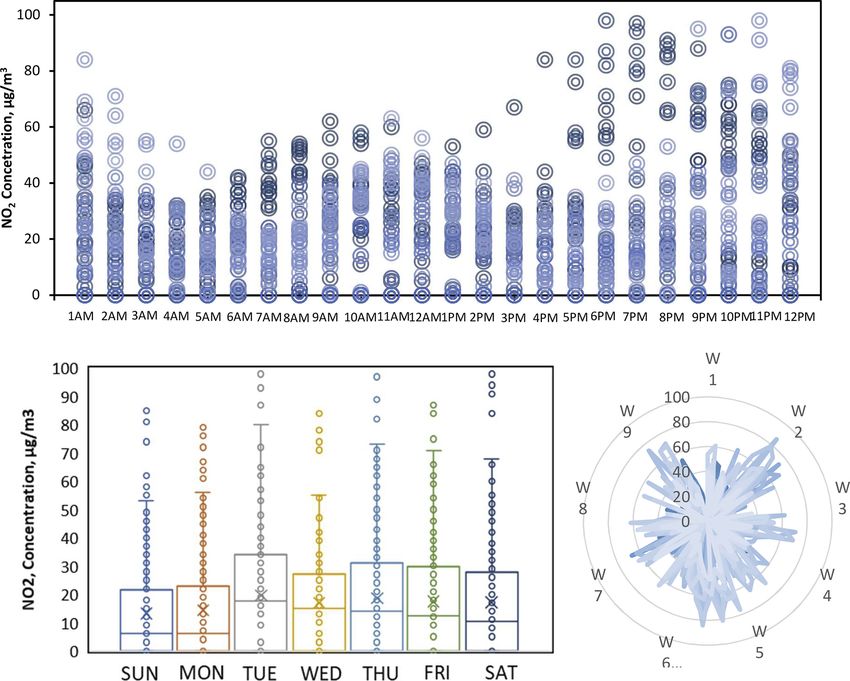
FEBE
1,1

16

Figure 1.
Study area within
Mohammedia
prefecture
2014                          2015                          2016
                                                                                                     Air quality
                            Std.                          Std.                          Std.          and health
Time     Mean   Median    deviation   Mean   Median     deviation   Mean   Median     deviation      assessment
1 a.m.    20      92         26        37      105         34        27      112         39
2 a.m.    13      69         17        28      100         31        19      107         32
3 a.m.     9      67         13        21       90         27        14      101         26
4 a.m.    10      82         16        19       67         23        12      101         24                       17
5 a.m.    10      63         13        15       69         20         9       82         20
6 a.m.    15      76         19        14       71         19        12       78         22
7 a.m.    33      94         30        21       78         23        17      101         30
8 a.m.    25     100         28        40       90         30        21      101         34
9 a.m.    19      80         22        43       98         32        21      104         32
10        17      67         21        35      104         31        30      102         35
a.m.
11        19     104         26        36       98         31        29      104         37
a.m.
12        16     106         24        32      110         36        28      102         35
a.m.
1 p.m.    14      98         23        30      116         37        25      100         32
2 p.m.    13      86         21        23      110         32        15      103         26
3 p.m.    12     108         23        18      101         28        12      106         24
4 p.m.    16     106         27        17      100         28        12      112         25
5 p.m.    34     104         38        17      112         30        17      112         32
6 p.m.    50     112         43        25      110         36        21      117         39
7 p.m.    52     112         44        48      111         46        22      116         39
8 p.m.    54     111         43        59      116         48        24      114         39
9 p.m.    49     105         43        68      111         45        32      116         44
10        44     103         39        73      106         39        38      115         47
p.m.
11        38     103         35        66      105         37        35      117         46                   Table 1.
p.m.                                                                                              Statistics of AQI for
12        26      96         30        51      108         35        35      111         43        winters of the year
p.m.                                                                                                         2014–2016

and industrial activities are much affected by time and can vary by a big margin in just few
minutes. Hence, the hourly concentration can represent more closely real-time air quality as
compared to average readings of 24 h, weekly or monthly. The NO2 concentration during
three winter years of 2014, 2015 and 2016 is presented in Figure 2.

Air Quality Index
Indexing approach is one of the simplest methods to present air quality. The AQI approach
employed in this study is in conformance to United States Environmental Protection Agency
(US EPA) standards (US EPA, 2009). This method allows to calculate AQI for each pollutant
in consideration, i.e. AQIi. This study has calculated AQI based on the hourly concentration of
NO2 and SO2. The range of values adopted for AQI varies between 0 and 500. AQI for the
pollutant was calculated as shown in Eq. (1).
                                      IHi  ILo
                              Ip ¼                ðCp  BPLo Þ þ ILo                        (1)
                                    BPHI  BOLo

Where, Ip is index for pollutant (p), Cp is pollutant concentration, BPHi is concentration
breakpoint ≥ Cp; BPLo is breakpoint concentration ≤ Cp; IHi is AQI value for BPHi; and ILo is
AQI for BPLo.
FEBE Health risk assessment
1,1 Health risk assessment was performed in accordance with standards (United States
Environmental Protection Agency, 2013; WHO Regional Office for Europe, 2016). These
methods have been adopted in several studies (Bo et al., 2020; Luo et al., 2020; Odekanle et al.,
2020; Suman, 2020). Health risk assessment was carried out based on average hourly intake
(AHI) and average daily intake (ADI). AHI was calculated using Eq. (2).
18 C 3 IR
AHI ¼ (2)
BW
Where, C is concentration of pollutant (mg/m3), inhalation rate (m3/hr) and BW (body weight)
in kg.
For chronic exposure average daily inhalation was calculated using Eq. (3)
ðC 3 IR 3 EF 3 EDÞ
ADI ¼ (3)
ðBW 3 ATÞ
Where, exposure frequency (EF) days/year; exposure duration (ED) years; exposure time
(ET) hours/day and average time (AT) in days (period over which exposure is averaged)
Risk quotient for acute exposure risk from the hourly concentration was estimated using
Eq. (4)
AHD
RQ ¼ (4)
Rfc
Risk quotient for chronic exposure was calculated using Eq. (5)
ADD
RQ ¼ (5)
Rfc
Where, reference concentration (RfC) value was 0.02 mg/kg/day for NO2 obtained from EPA/
NAAQA 1990 and IRIS (US-EPA) (Gusti, 2019).
Result and discussion
NO2 concentration in study area
NO2 has been identified as a pollutant which can adversely affect human health (Guo et al.,
2021). Long-term NO2 exposure has been linked to lung infection and mortality (Hou et al.,
2020; Huang et al., 2021). Short-term NO2 exposure has been investigated for conjunctivitis and
mortality (Amini et al., 2019; Samoli et al., 2006). Additionally NO2 has been positively linked to
Figure 2.
Hourly concentration
of NO2 in winters for
the year 2014, 2015
and 2016prebirth, conjunctivitis, skin disease, increase of asthma patients and cardiovascular mortality Air quality
(Cisneros et al., 2021; Duan et al., 2019; Ji et al., 2019; Li et al., 2020; Nitschke et al., 1999). and health
The NO2 concentration in the environment of low town in Mohammedia city was
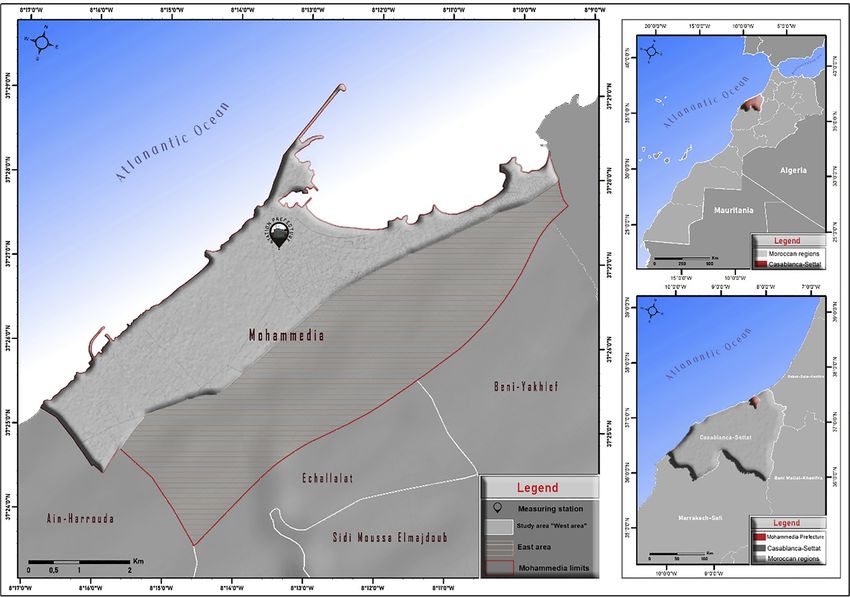
measured at an hourly interval. Figures 3–5 represent the concentration of NO2 for the
assessment
winters of the year 2014–2016. In the year 2014, NO2 was maximum at 6 p.m. In the year 2015,
NO2 levels in urban were found to be at peak at 1 p.m. and 8–10 p.m. indicating which can be
attributed to shift in traffic hours in the city. However, in winters of 2016, the NO2 level peaks
lasted from 6 p.m. to 11 p.m. The shift in peak and increase in peak hours indicates the 19
deterioration of air quality and increase in air pollution in the city (Cisneros et al., 2021;
Kim et al., 2005). These results indicate that NO2 concentration in low town city of
Mohammedia is primarily attributed to traffic conditions. As industrial pollution prevails for
much longer period of time (Morakinyo et al., 2017). This is primarily due to the reason that
work shifts in industries lasts for 6–8 h. Hence, concentration of NO2 will remain relevantly
constant. However, the increase in NO2 is not constant and only shows spikes attributed to
increase in traffic volume at given hours in the city.
Air Quality Index
The AQI was developed to represent air quality. US EPA, has defined AQI into six categories,
namely, good (0–50), moderate (51–100), unhealthy to sensitive groups (101–150), unhealthy
(151–200), very unhealthy 201–300 and hazardous (301–500) (United States Environmental
Protection Agency, 2013). However, for NO2 this range is 0–53, 54–100, 101–360, 361–649,
650–1,249, 1,250–1,649 and 1,650–2,049 ppb for the categories of good – hazardous,
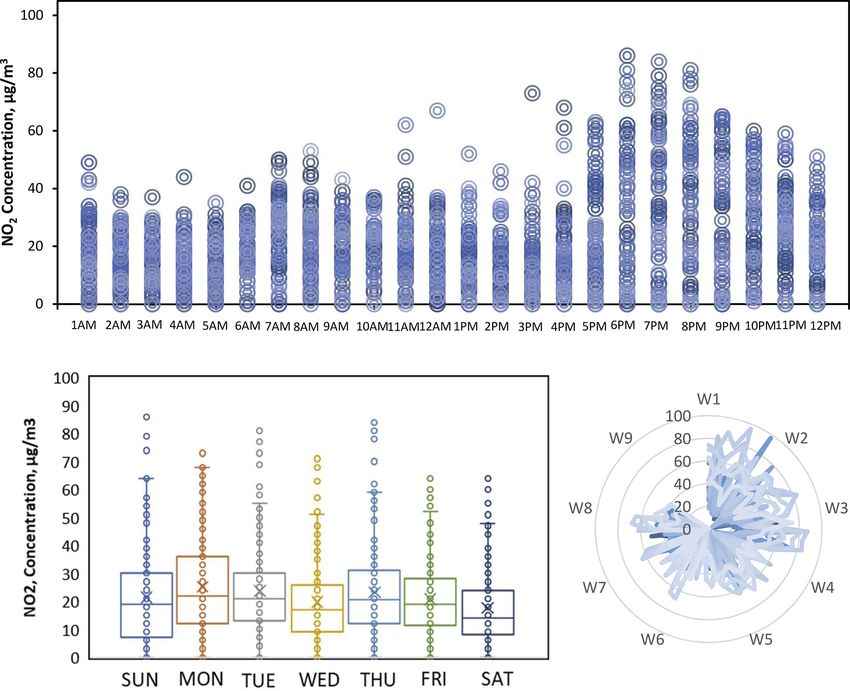
Figure 3.
NO2 hourly, daywise
and weekly
concentration during
winters of the
year 2014FEBE
1,1
20
Figure 4.
NO2 hourly, daywise
and weekly
concentration during
winters of the
year 2015
respectively (United States Environmental Protection Agency, 2013). AQI was estimated for
the hourly NO2 concentration for each year. During winters of the year 2014–2016, AQI
ranged between good – unhealthy to sensitive group conditions. In the year 2014, at peak
hour of 8 p.m., 27% of the observations were found to moderate, 26% unhealthy to sensitive
group and 47% good. For the year 2015, the peak hours of 1 p.m. and 8–10 p.m.; the 1 p.m. only
showed few spikes in NO2 levels, while 30% of AQI were unhealthy to sensitive group and
4% AQI were moderate and 64% were good. Nevertheless, in the year 2016, AQI was 70% in
good category, while 12% moderate and 16% unhealthy to sensitive group. The AQI infers
that even though there were spikes and increase in peak hour concentration in three
consecutive winter seasons but the overall air quality was improving for these particular
hours and can be attributed to local traffic and parameters (Zhou et al., 2020).
Noncarcinogenic risk
Noncarcinogenic risk assessment represents all the possible adverse health impact that may
occur to the person on exposure to the pollutant (Brauer et al., 2002; Ghozikali et al., 2016). This
study conduct health risk assessment based on life time exposure and hourly exposure. This
was done to investigate whether the hourly spikes in NO2 concentration can pose any risk to
human health or not. The risk quotient represents noncarcinogenic risks (Fenech and
Aquilina, 2020; Paraschiv and Paraschiv, 2019). RQ < 1 refers to no possible adverse health
effect to the population exposed to pollutant (Brunt and Jones, 2019; Odekanle et al., 2020).
The RQ value for ADI and AHI was found to be less than 1. The RQ based on AHI ranged inAir quality
and health
assessment
21
Figure 5.
NO2 hourly, daywise
and weekly
concentration during
winters of the
year 2016
between 0.1 and 0.2 for all three winters season of 2014–2016. Nonetheless, RQ ranged
between 0 and 0.84 (6 p.m.) in the year 2014, 0 to 0.96 in 2015, and in 2016 it increased 0–0.98.
Even though RQ < 1 for each year but the increasing trend suggests that mitigation measures
need to be adopted to overcome the yearly increasing risk.
Conclusion
This study was conducted to investigate the hourly concentration of NO2 at low town in
Mohammedia city, Morocco. The hourly concentration peaks were identified and were
investigated for AQI, and possible health risk. The peak hours suggest increase in NO2
concentration during winters of the year 2014–2016, also the peak hours increase from 6 p.m.
in 2014 to 8–11 p.m. during 2016 winters. But other than peak hours the concentration was
within ambient air limits.
Even though the number of spikes in winter season have increased for every year. But
AQI suggests that overall air quality has improved from 47% of the peak hour observation
were found to be in good category in 2014 which increased to 70% in winters of 2016. Despite
the spikes during peak hours of NO2 concentration the RQ < 1 at every hour. However, the
increasing trend of RQ values yearwise indicates that there is an increase in possible risk to
city residents. The correlation between AQI and RQ was found to be strong. The correlation
between AQI and RQ was 0.95 (ADI) and 0.94 (AHI). The strong correlation value further
validates results of the study, i.e. AQI is directly related to health risk.FEBE The hourly concentration helps in identifying the time duration of air pollution which may
1,1 pose potential risk to human health. Thereby it also provides an option to adopt policy and
measures to mitigate adverse effect of pollutant. As, this may aid in adopting measures
strictly for specified time duration, thus saving efforts and resources which may be used for
full 24-h duration. Future studies are required to determine impact of climatic parameters
(temperature, precipitation, humidity, wind direction), on NO2 concentration.
22
References
Amini, H., Trang Nhung, N.T., Schindler, C., Yunesian, M., Hosseini, V., Shamsipour, M.,
Hassanvand, M.S., Mohammedi, Y., Farzadfar, F., Vicedo-Cabera, A.M., Schwartz, J. and
Henderson, S.B. (2019), “Short-term associations between daily mortality and ambient
particulate matter, nitrogen dioxide, and the air quality index in a Middle Eastern
megacity”, Environmental Pollution, Vol. 254, pp. 1-9.
Bao, N., Lu, Y., Huang, K., Gao, X., Gui, S.Y., Hu, C.Y. and Jiang, Z.X. (2021), “Association
between short-term exposure to ambient nitrogen dioxide and the risk of conjunctivitis in
Hefei, China: a time-series analysis”, Environmental Research, Elsevier, Vol. 195 No.
April 2020, p. 110807.
Bo, M., Charvolin-Volta, P., Clerico, M., Nguyen, C.V., Pognant, F., Soulhac, L. and Salizzoni, P. (2020),
“Urban air quality and meteorology on opposite sides of the Alps: the Lyon and Torino case
studies”, Urban Climate, Elsevier, Vol. 34, p. 100698.
Brauer, M., Herderson, S., Kirkham, T., Lee, K.S., Rich, K. and Teschke, K. (2002), Review of the Health
Risks Associated with Nitrogen Dioxide and Sulfur Dioxide in Indoor Air Nitrogen Dioxide and
Sulfur Dioxide in Indoor Air, Report to Health Canada, University of British Columbia,
Vancouver, British Columbia, No. January.
Brunt, H. and Jones, S.J. (2019), “A pragmatic public health-driven approach to enhance local air
quality management risk assessment in Wales, UK”, Environmental Science and Policy,
Elsevier, Vol. 96 No. March, pp. 18-26.
Burns, J., Hoffmann, S., Kurz, C., Laxy, M., Polus, S. and Rehfuess, E. (2021), “COVID-19 mitigation
measures and nitrogen dioxide – a quasi-experimental study of air quality in Munich,
Germany”, Elsevier, Atmospheric Environment, Vol. 246, doi: 10.1016/j.atmosenv.2020.118089.
Cisneros, R., Gharibi, H., Entwistle, M.R., Tavallali, P., Singhal, M. and Schweizer, D. (2021), “Nitrogen
dioxide and asthma emergency department visits in California, USA during cold season
(November to February) of 2005 to 2015: a time-stratified case-crossover analysis”, The Science
of the Total Environment, Vol. 754, doi: 10.1016/j.scitotenv.2020.142089.
Duan, Y., Liao, Y., Li, H., Yan, S., Zhao, Z., Yu, S., Fu, Y., Wang, Z., Yin, P., Cheng, J. and Jiang, H.
(2019), “Effect of changes in season and temperature on cardiovascular mortality associated
with nitrogen dioxide air pollution in Shenzhen, China”, The Science of the Total Environment,
Elsevier B.V., Vol. 697, 134051.
Fenech, S. and Aquilina, N.J. (2020), “Trends in ambient ozone, nitrogen dioxide, and particulate
matter concentrations over the Maltese Islands and the corresponding health impacts”, The
Science of the Total Environment, Vol. 700, doi: 10.1016/j.scitotenv.2019.134527.
Ghozikali, M.G., Borgini, A., Tittarelli, A., Amrane, A., Mohammadyan, M., Heibati, B. and
Yetilmezsoy, K. (2016), “Quantification of health effects of exposure to air pollution (PM10) in
Tabriz, Iran”, Global Nest Journal, Vol. 18 No. 4, pp. 708-720.
Guo, H., Zhang, S., Zhang, Z., Zhang, J., Wang, C., Fang, X., Lin, H., Li, H. and Ruan, Z. (2021),
“Short-term exposure to nitrogen dioxide and outpatient visits for cause-specific conjunctivitis:
a time-series study in Jinan, China”, Atmospheric Environment, Elsevier, Vol. 247 No. August
2020, p. 118211.
Gusti, A. (2019), “Health risk assessment of inhalation exposure to So2 and No2 among traders in a
traditional market”, Public Health of Indonesia, Vol. 5 No. 2, pp. 30-35.Hou, D., Ge, Y., Chen, C., Tan, Q., Chen, R., Yang, Y., Li, L., et al. (2020), “Associations of long-term Air quality
exposure to ambient fine particulate matter and nitrogen dioxide with lung function: a cross-
sectional study in China”, Environment International, Vol. 144, doi: 10.1016/j.envint.2020.105977. and health
Huang, S., Li, H., Wang, M., Qian, Y., Steenland, K., Michael, W., Liu, Y., Sarnat, J., Papatheodorou, S.
assessment
and Shi, L. (2021), “Science of the total environment long-term exposure to nitrogen dioxide and
mortality: a systematic review and meta-analysis”, The Science of the Total Environment,
Elsevier B.V., Vol. 776, p. 145968.
Ji, X., Meng, X., Liu, C., Chen, R., Ge, Y., Kan, L., Fu, Q., Li, W., Tse, L.A. and Kan, H. (2019), “Nitrogen 23
dioxide air pollution and preterm birth in Shanghai, China”, Environmental Research, Elsevier,
Vol. 169 No. November 2018, pp. 79-85.
Kanbouchi, I., Souabi, S., Chtaini, A. and Aboulhassan, M. (2014), “Evaluation de la pollution des
eaux usees mixtes collectees par le reseau d’assainissement de la ville de Mohammedia”,
Les technologies de laboratoire, Vol. 8 No. 34, pp. 162-170.
Kim, K.H., Choi, Y.J. and Kim, M.Y. (2005), “The exceedance patterns of air quality criteria: a case
study of ozone and nitrogen dioxide in Seoul, Korea between 1990 and 2000”, Chemosphere,
Vol. 60 No. 4, pp. 441-452.
Li, J., Huang, J., Wang, Y., Yin, P., Wang, L., Liu, Y., Pan, X., Zhou, M. and Li, G. (2020), “Years of life
lost from ischaemic and haemorrhagic stroke related to ambient nitrogen dioxide exposure: a
multicity study in China”, Ecotoxicology and Environmental Safety, Elsevier, Vol. 203 No. April,
p. 111018.
Lozano, A., Usero, J., Vanderlinden, E., Raez, J., Contreras, J. and Navarrete, B. (2009), “Air quality
monitoring network design to control nitrogen dioxide and ozone, applied in Malaga, Spain”,
Microchemical Journal, Elsevier B.V., Vol. 93 No. 2, pp. 164-172.
Luo, H., Guan, Q., Lin, J., Wang, Q., Yang, L., Tan, Z. and Wang, N. (2020), “Air pollution
characteristics and human health risks in key cities of northwest China”, Journal of
Environmental Management, Elsevier, Vol. 269 No. December 2019, p. 110791.
Monographie de Mohammadia (2015), “Commune Urbaine Mohammadia”, available at: http://www.
mohammedia.ma/docs/101062015162125.pdf.
Morakinyo, O.M., Adebowale, A.S., Mokgobu, M.I. and Mukhola, M.S. (2017), “Health risk of inhalation
exposure to sub-10 μm particulate matter and gaseous pollutants in an urban-industrial area in
South Africa: an ecological study”, BMJ Open, Vol. 7 No. 3, pp. 1-9.
Nitschke, M., Smith, B.J., Pilotto, L.S., Pisaniello, D.L., Abramson, M.J. and Ruffin, R.E. (1999),
“Respiratory health effects of nitrogen dioxide exposure and current guidelines”, International
Journal of Environmental Health Research, Vol. 9 No. 1, pp. 39-53.
NOVEC (2014), “Etude d’impact sur l’environnement naturel, humain et socio-economique Projet
d’amenagement de la ville nouvelle de ZENATA Missions 1 : Description et analyse de l’etat de
reference Livret des agrandissements cartographiques Juin 2010”, pp. 1-36.
Odekanle, E.L., Sonibare, O.O., Odejobi, O.J., Fakinle, B.S. and Akeredolu, F.A. (2020), “Air
emissions and health risk assessment around abattoir facility”, Heliyon, Elsevier, Vol. 6
No. 7, p. e04365.
Paraschiv, S. and Paraschiv, L. (2019), “Analysis of traffic and industrial source contributions to
ambient air pollution with nitrogen dioxide in two urban areas in Romania”, Energy Procedia,
Vol. 157, pp. 1553-1560.
Samoli, E., Aga, E., Touloumi, G., Nisiotis, K., Forsberg, B., Lefranc, A., Pekkanen, J., Wojtyniak, B.,
Schindler, C., Niciu, E., Brunstein, R., Fikfak, M.D., Schwartz, J. and Katsouyanni, K. (2006),
“Short-term effects of nitrogen dioxide on mortality: an analysis within the APHEA project”,
European Respiratory Journal, Vol. 27 No. 6, pp. 1129-1137.
Shi, T., Dirienzo, N., Requia, W.J., Hatzopoulou, M. and Adams, M.D. (2020), “Neighbourhood scale
nitrogen dioxide land use regression modelling with regression kriging in an urban transportation
corridor”, Atmospheric Environment, Vol. 223, doi: 10.1016/j.atmosenv.2019.117218.FEBE Suman (2020), “Air quality indices: a review of methods to interpret air quality status”, Materials
Today: Proceedings, Elsevier, Vol. 34 No. 3, doi: 10.1016/j.matpr.2020.07.141.
1,1
United States Environmental Protection Agency (2013), “Technical assistance document for the
reporting of daily air quality – the air quality index (AQI)”, Environmental Protection,
Vol. EPA-454/B-, p. 28.
US EPA (2009), “Risk assessment guidance for superfund volume I: human health evaluation
manual (Part F, supplemental guidance for inhalation risk assessment)”, Office of
24 Superfund Remediation and Technology Innovation Environmental Protection Agency,
Vol. I, pp. 1-68.
WHO Regional Office for Europe (2016), Health Risk Assessment of Air Pollution, World Health
Organization, Denmark, Vol. 34 No. 3, pp. 1-40.
Zhou, W., Chen, C., Lei, L., Fu, P. and Sun, Y. (2020), “Temporal variations and spatial distributions of
gaseous and particulate air pollutants and their health risks during 2015–2019 in China”,
Environmental Pollution, Vol. 272 No. 1, doi: 10.1016/j.envpol.2020.116031.
Corresponding author
Rachida El Morabet can be contacted at: rachidaelmorabet@yahoo.fr
For instructions on how to order reprints of this article, please visit our website:
www.emeraldgrouppublishing.com/licensing/reprints.htm
Or contact us for further details: permissions@emeraldinsight.comYou can also read