3 International air travel infrastructure - MBIE

Page created by Josephine Allen
 
CONTINUE READING
3 International air travel infrastructure - MBIE
MINISTRY OF BUSINESS, INNOVATION AND EMPLOYMENT          TOURISM INFRASTRUCTURE     AUGUST 2016
                                                              TOURISM INSIGHT SERIES

14

     3 International
     air travel infrastructure
       ƨƨ Summary

           ››   Current air travel infrastructure is not sufficient to meet the expected demand growth in
                tourists over the next seven years.
           ››   Inbound seat capacity can be relatively quickly changed through adding/removing flights,
                assuming appropriate air service agreements are in place. However, capacity of airport
                infrastructure requires long-term planning. New Zealand’s international airports appear
                to be proactively working towards the expansion in airport infrastructure, though there
                could be short-term challenges before these large-scale developments come online.
           ››   The profitability of air routes (and therefore the likelihood of additional capacity coming online)
                depends on a combination of yield (return per passenger) and load factor (how full the airplane
                is). There are relatively few barriers to enter the market, so potential routes will be taken by an
                air carrier if they are profitable.

     3.1 International air travel infrastructure demand
     Of New Zealand’s 3.5 million annual visitors, 99 per cent come by air. Regions with
     international airports are widely recognised as being ‘gateways’ for international tourists
     to New Zealand, and serve as hubs from which they disperse to the regions.

     While domestic air travel is important for the regional dispersal of tourists from the main
     international airports, it is difficult to separate tourist trips from commuting or business
     trips in our data – therefore it is excluded from this analysis.

     While international visitor arrivals were relatively steady over the period from 2007 to 2012,
     from 2013 onwards there has been consistent growth as demand has recovered since the global
     financial crisis. Large reductions in fuel prices have contributed to a significant improvement
     in airline profitability and, as a consequence, their appetite for pursuing capacity growth –
     especially in the delivery of long-haul international air services. From the January 2013 year
     to the January 2016 year, there has been a 24 per cent increase in the number of arrivals
     into New Zealand. A large proportion of this growth has happened recently, with 10 per cent
     growth occurring in the March 2016 year. Annual arrivals have hit a record number, with
     3.3 million international visitors in the year ended March 2016.
MINISTRY OF BUSINESS, INNOVATION AND EMPLOYMENT                       TOURISM INFRASTRUCTURE                   AUGUST 2016
                                                                      TOURISM INSIGHT SERIES

Figure 4: International visitor arrivals, monthly                                                                                                    15

                                                                                                                                          Dec-2015

                                                                                                                               Dec-2014

             400,000
                                                                                                                    Dec-2013

                                                                                              Dec-2011   Dec-2012

                                                                                   Dec-2010
                                                                      Dec-2009

                                                           Dec-2008
                                     Dec-2006   Dec-2007
                          Dec-2005
  Arrivals

             300,000

             200,000
                             2006

                                                   2008

                                                                         2010

                                                                                                 2012

                                                                                                                       2014

                                                                                                                                             2016
                                                                                 Year

Source: International Travel and Migration statistics, Statistics New Zealand

Monthly visitor arrivals are much higher in the summer, peaking in December each year.
Considering the last 10 years (2005 to 2015), December arrivals are approximately 64 per cent
higher than the annual average, while June is approximately 30 per cent lower than the
annual average (Figure 5). Air travel infrastructure, therefore, must be versatile enough to
accommodate this level of variation throughout the year. Given the fact that airports must
also deal with visitors departing after their trip, this translates into around 6 million passenger
transfers each year. When considering inbound and outbound trips of New Zealanders each
year, the total passenger movements for the year ended March 2016 were over 11.6 million.
MINISTRY OF BUSINESS, INNOVATION AND EMPLOYMENT                                                        TOURISM INFRASTRUCTURE         AUGUST 2016
                                                                                                            TOURISM INSIGHT SERIES

16   Figure 5: Seasonality of international visitor arrivals
        Percentage of monthly arrival exceeding annual average

                                                                                                                                                         Maximum
                                                                 100%

                                                                                                                                                         Mean

                                                                 50%
                                                                                                                                                         Minimum

                                                                  0%                                                                                     Annual mean

                                                                        Jan   Feb   Mar   Apr   May   Jun     Jul     Aug     Sep    Oct   Nov     Dec

     Source: International Travel and Migration statistics, Statistics New Zealand

     The majority of the international visitors arrive at Auckland Airport (71 per cent in 2015)
     (Figure 6). Auckland has seen steady growth in arrivals, up 8.6 per cent in 2015. However,
     Queenstown and Wellington airports have seen stronger percentage growth over the last
     year (at 24 per cent and 15 per cent, respectively). The increase in Queenstown Airport arrivals
     is partly due to a reduction in volume through Christchurch, where infrastructure problems
     related to the 2010 and 2011 earthquakes (especially available accommodation and travel
     congestion difficulties), as well as the earthquakes themselves, may have discouraged some
     tourists. In June 2016, night operations will start in Queenstown, which is expected to attract
     more weekend tourists from Australia. Wellington Airport has seen growth due to new
     routes starting in the last year, but the potential for future growth may be muted. Arrivals
     to Christchurch Airport increased in 2015, but are still below pre-earthquake levels.
MINISTRY OF BUSINESS, INNOVATION AND EMPLOYMENT                                                  TOURISM INFRASTRUCTURE                                  AUGUST 2016
                                                                                                  TOURISM INSIGHT SERIES

 Figure 6: International visitor arrivals, annual average, by port                                                                                                                                                     17

                                                  Auckland                                                                                                                    Wellington
                     2.5
                               4.7%       6.7%      0.2%      3.5%     4.3%     8.6%                                                                          0.2%    21.5%      -1%         0.2%   -0.7%   15.1%

                     2.0                                                                                                                        0.20
Arrivals (million)

                                                                                                                           Arrivals (million)
                     1.5                                                                                                                        0.15
                                                                                                        71%

                     1.0                                                                                                                        0.10

                     0.5                                                                                                                        0.05

                     0.0                                                                                                                        0.00
                            2009    2010     2011      2012       2013       2014     2015                                                             2009      2010     2011         2012     2013    2014    2015

                                                 Queenstown                                              7%                                                               Christchurch
                                                                                                                                                0.6
                                            97.9%                    23.8%                                                                                2.6%       -12.1%     -7%      -0.1%      -0.9%   8.1%
                     0.20

                     0.15
Arrivals (million)

                                                                                                                           Arrivals (million)
                                                                                                  15%                                           0.4

                     0.10
                                                                                             6%                                                 0.2
                     0.05

                     0.00                                                                                                                       0.0
                                   2013                    2014                2015                                                                    2009     2010     2011         2012      2013    2014   2015

 Source: International Travel and Migration statistics, Statistics New Zealand

 Work undertaken by Auckland Airport suggests that there are opportunities to grow air
 capacity to a number of parts of the world, most notably Germany, Canada and Australia.
 Additional flights to these countries could potentially lead to higher visitor arrivals, as long
 as airport infrastructure is sufficient to support this growth.

 3.2 International air travel infrastructure supply
 Air transport infrastructure for tourism comprises airports, airplanes and the air navigation
 system. The quality and capacity of this infrastructure can have significant impact on the
 quality of a tourist’s experience.12

 The supply of air transport infrastructure can be broken down in to two main groupings:

 ›› infrastructure of airports
 ›› number and capacity of flights.

 Sufficient capacity of both are needed to support the high growth in visitor arrivals forecast.
 While new air services involve substantial commitments from airlines in terms of capital and
 operating costs, the primary assets (aircraft) are ultimately mobile and can be redeployed
 between markets with relatively short lead times. The number of flights to a particular
 destination can adjust quickly, provided there is sufficient aircraft available and sufficient
 demand at appropriate yields for airlines to operate profitably. In contrast, investment in
 airport infrastructure typically involves longer lead times and financial commitments to
 immobile, largely specialised assets with high fixed costs.

 It is difficult to measure the available supply of airport infrastructure. However, it is
 relatively straightforward to identify capacity and the number of seats occupied of flights
 into New Zealand.

 12 National Infrastructure Unit. (2015). Infrastructure evidence base – 2015 refresh: Transport sector. Retrieved from
 http://www.infrastructure.govt.nz/plan/evidencebase/2015-nip-evidence-transport.pdf
MINISTRY OF BUSINESS, INNOVATION AND EMPLOYMENT                                 TOURISM INFRASTRUCTURE                    AUGUST 2016
                                                                                     TOURISM INSIGHT SERIES

18   New Zealand has five airports with scheduled international services: Auckland, Wellington,
     Christchurch, Dunedin and Queenstown. Twenty-six airports receive scheduled domestic
     services from operators of aircraft of 19 seats or more. Two airports (Auckland and Christchurch)
     are capable of supporting long-haul international air services. Christchurch Airport has
     a significant amount of under-utilised capacity in this regard. Most airports are owned by
     local government, though some are partly owned by central government or private investors.
     Airways New Zealand, a state-owned enterprise, provides air navigational infrastructure.

     Aviation capacity is provided by the two domestic and 24 international passenger carriers
     which operate in New Zealand. This infrastructure is for the most part privately provided.
     The total air capacity is shown in Figure 7, with 28.9 million domestic seats and 7.3 million
     inbound international seats in 2015.

     Figure 7: Seat capacity by origin

                                                Domestic                                                             International
              29,000,000

                                                                                   7,250,000

                                                                                   7,000,000
              28,000,000
      Seats

                                                                                   6,750,000

              27,000,000

                                                                                   6,500,000

              26,000,000
                                                                                   6,250,000
                           2008

                                  2009

                                         2010

                                                2011

                                                       2012

                                                              2013

                                                                     2014

                                                                            2015

                                                                                               2008

                                                                                                      2009

                                                                                                              2010

                                                                                                                       2011

                                                                                                                              2012

                                                                                                                                     2013

                                                                                                                                            2014

                                                                                                                                                   2015

     Source: Sabre

     Air New Zealand carries approximately 80 per cent of domestic traffic and, together with their
     alliance partners, operates 40 per cent of international capacity into and out of New Zealand.
     About 95.6 per cent of passenger seat hours are flown on large planes (greater than 30 seats).
MINISTRY OF BUSINESS, INNOVATION AND EMPLOYMENT                                    TOURISM INFRASTRUCTURE                        AUGUST 2016
                                                                                   TOURISM INSIGHT SERIES

Figure 8: Flight capacity of international and national flights per operator                                                                                  19

                                                              Domestic                                               International

  Virgin Australia International Airlines
                      Transavia Airlines
     Thai Airways International Public
            Singapore Airlines Limited
                            Sama Air Llc
                    Qantas Airways Ltd.
                  Philippine Airlines Inc.
      Malaysia Airline System Berhad
                       Lan Airlines S.A.
             Korean Air Lines Co. Ltd.
           Jetstar Airways Pty Limited
                  Hawaiian Airlines Inc.
                           Flexflight Aps
                                Emirates
                China Southern Airlines
                  China Eastern Airlines
                          China Airlines
           Cathay Pacific Airways Ltd.
   Cargolux Airlines International S.A.
                        Airlines Air Onix
     Air Vanuatu (Operations) Limited
                           Air Tahiti Nui
                          Air Pacific Ltd.
                Air New Zealand Limited
                       Air China Limited
            Air Caledonie International
                  Aerolineas Argentinas
                                             0

                                                                                                                0
                                                  5,000,000

                                                              10,000,000

                                                                            15,000,000

                                                                                         20,000,000

                                                                                                       25,000,000

                                                                                                                     1,000,000

                                                                                                                                      2,000,000

                                                                                                                                                  3,000,000

                                                                                                      Seats

                                                                           Year              2013            2014   2015

Source: Sabre
MINISTRY OF BUSINESS, INNOVATION AND EMPLOYMENT                        TOURISM INFRASTRUCTURE                AUGUST 2016
                                                                            TOURISM INSIGHT SERIES

20   Figure 9: Percentage of flight capacity of international and domestic flights, by operator

                                                             Domestic                                  International

      Virgin Australia International Airlines
                          Transavia Airlines
          Thai Airways International Public
                Singapore Airlines Limited
                                Sama Air Llc
                        Qantas Airways Ltd.
                      Philippine Airlines Inc.
          Malaysia Airline System Berhad
                           Lan Airlines S.A.
                 Korean Air Lines Co. Ltd.
                Jetstar Airways Pty Limited
                       Hawaiian Airlines Inc.
                               Flexflight Aps
                                    Emirates
                     China Southern Airlines
                      China Eastern Airlines
                              China Airlines
               Cathay Pacific Airways Ltd.
       Cargolux Airlines International S.A.
                            Airlines Air Onix
          Air Vanuatu (Operations) Limited
                               Air Tahiti Nui
                              Air Pacific Ltd.
                  Air New Zealand Limited
                           Air China Limited
                Air Caledonie International
                      Aerolineas Argentinas
                                                 0%

                                                       20%

                                                               40%

                                                                        60%

                                                                                  80%

                                                                                        0%

                                                                                                 10%

                                                                                                            20%

                                                                                                                       30%

                                                                                                                                40%

                                                                                   Seats

                                                                     Year      2013      2014        2015

     Source: Sabre

     3.2.1 Air service agreements
     The pool of air routes available to carriers is governed by air service agreements. These
     agreements are required before an international flight can operate between two countries.
     New Zealand has 59 agreements in place, 18 agreements approved by Cabinet are awaiting
     signature, one code-share arrangement is awaiting signature, and two agreements are
     under negotiation.
MINISTRY OF BUSINESS, INNOVATION AND EMPLOYMENT               TOURISM INFRASTRUCTURE    AUGUST 2016
                                                              TOURISM INSIGHT SERIES

Table 1: New Zealand air service agreements                                                                           21

 COUNTRY                                          AGREEMENT TYPE                             STATUS

 Argentina, Australia, Austria, Belgium,          Bilateral air services                     In place
 Brazil, Cambodia, Canada, China,
 Denmark, Fiji, Finland, France, Germany,
 Greece, Hong Kong, Indonesia, Ireland,
 Italy, Jamaica, Japan, Korea, Kuwait,
 Luxembourg, Macau, Malaysia, Mexico,
 Nauru, Niue, Norway, Papua New
 Guinea, Philippines, Qatar, Russia, Saudi
 Arabia, Seychelles, Solomon Islands,
 South Africa, Spain, Sri Lanka, Sweden,
 Switzerland, Taiwan, Thailand, Turkey,
 United Arab Emirates, United Kingdom,
 Uruguay, Vanuatu, Viet Nam

 Brunei, Chile, Cook Islands, Mongolia            Multilateral Agreement on the              In place
 (cargo-only), Singapore, Tonga and the           Liberalization of International Air
 United States of America                         Transportation (MALIAT)

 Curacao, Czech Republic                          Code-share only air services               In place
                                                  arrangement

 Bahrain, Colombia, Egypt, Ethiopia,              Air services                               Approved by Cabinet
 Iceland, Israel, Mauritius, Nepal,                                                          but awaiting signature
 Netherlands, Nigeria, Pakistan, Panama,
 Portugal, Oman, Paraguay Serbia,
 Togo, Zambia

 The Bahamas                                      Code-share only                            Awaiting signature

 Laos, Peru                                       Air services                               Under negotiation

Air service agreements specify:

›› routes that can be flown
›› capacity (frequency and aircraft types) that may be offered
›› how many airlines may operate
›› how tariffs are regulated.

Open skies agreements are a subset of air service agreements that place little or no
restrictions on available routes, number of flights or flight prices. New Zealand currently
has more than 40 agreements that could be classified as open skies agreements, depending
on the definition of open skies used by different jurisdictions. These agreements set
New Zealand as one of the most open commercial aviation markets in the world, with
relatively few barriers that could restrict air carriers flying to the country.

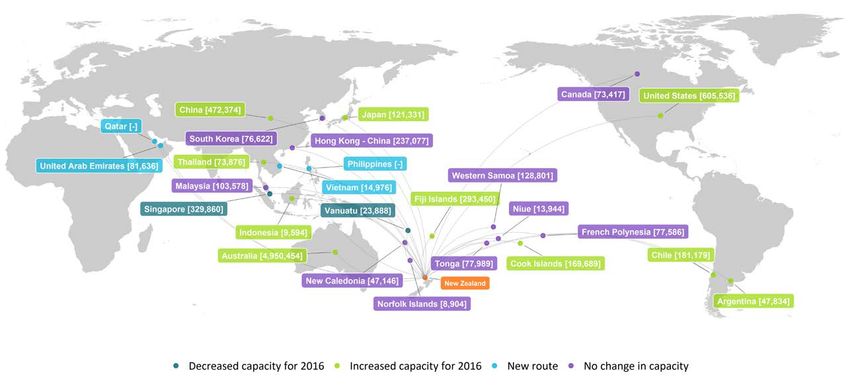
3.2.2 International air connections
Air connectivity is critical to the tourism industry and to the New Zealand economy as a
whole. Figure 10 shows all the countries flying directly to New Zealand, while Figures 42
to 45 in Appendix 3 of this report show the cities with direct flights to New Zealand by port,
along with new routes and planned expansions. Please note that in the graphs, due to
fluctuations in capacity across years, a change in capacity is only considered if it grows
or falls by more than 5 per cent. Capacity changes of less than 5 per cent are considered
to be unchanged.
MINISTRY OF BUSINESS, INNOVATION AND EMPLOYMENT   TOURISM INFRASTRUCTURE   AUGUST 2016
                                                       TOURISM INSIGHT SERIES

22   New air routes provide increased capacity and this can influence demand. After an extended
     period of little growth in annual capacity (number of seats), New Zealand saw a significant
     increase in inbound flight capacity from late 2013, with this expected to continue in 2016
     and 2017 (refer Figure 7). In contrast, growth in inbound capacity to Australia has been more
     consistent over the period. Given its relatively small size and distance from a number of
     international markets, long-haul international air services to New Zealand involved significant
     commercial risks, especially in the very high fuel price environment that existed between
     2009 and 2013. These risks have reduced as demand has continued to grow and the cost
     of fuel has decreased significantly.
Figure 10: Inbound capacity to New Zealand, 2016
                                                                                                    MINISTRY OF BUSINESS, INNOVATION AND EMPLOYMENT
                                                                           TOURISM INSIGHT SERIES
                                                                                                    TOURISM INFRASTRUCTURE

Note: data for the Philippines and Qatar are currently unavailable.
                                                                                                    AUGUST 2016

                                                                      23
MINISTRY OF BUSINESS, INNOVATION AND EMPLOYMENT              TOURISM INFRASTRUCTURE   AUGUST 2016
                                                                  TOURISM INSIGHT SERIES

24   Figure 11: Inbound capacity – New Zealand vs Australia

                                                                 Monthly capacity
                                                                                                                   Australia

               4,000,000

               3,000,000
       Seats

               2,000,000

                                                                                                                New Zealand

               1,000,000
                                  2010

                                                         2012

                                                                                    2014

                                                                                                          2016
                                                                Capacity index
                                                                                                                   Australia
               140
                                                                                                                New Zealand

               120
       Value

               100
                           2010

                                                  2012

                                                                                 2014

                                                                                                         2016
     The recent growth in capacity has been shared across New Zealand’s four main international
     airports. Capacity growth has been exceptional in Queenstown, up 97.9 per cent from 2013 to
     2014, and 23.8 per cent from 2014 to 2015. The number of international arrivals in Queenstown
     in 2013 was very low when compared to the other airports in New Zealand. That said,
     Queenstown’s capacity is now just approaching Wellington’s. In terms of actual seats,
     58.5 per cent of the growth has occurred in Auckland, with much smaller absolute growth
     in capacity for the other airports.
MINISTRY OF BUSINESS, INNOVATION AND EMPLOYMENT              TOURISM INFRASTRUCTURE   AUGUST 2016
                                                             TOURISM INSIGHT SERIES

Figure 12: Annual inbound capacity to New Zealand’s main international airports                                                 25

                                                            Monthly capacity
          1,250,000

                                                                                                                     Auckland
          1,000,000

           750,000
  Seats

           500,000

           250,000                                                                                         Christchurch

                                                                                                             Wellington

                 0                                                                                         Queenstown
                             2010

                                                    2012

                                                                               2014

                                                                                                     2016
                                                           Capacity index

          600

                                                                                                           Queenstown
          400
  Value

          200                                                                                                     Auckland

                                                                                                            Wellington

                                                                                                           Christchurch
            0
                      2010

                                             2012

                                                                            2014

                                                                                                    2016
Source: Sabre

Approximately a million more seats have been made available from Australia over the last four
years, increasing capacity by 25 per cent. Capacity to China remains at a much lower level than
Australia, but has seen a meteoric rise, from less than 50,000 in 2008 to almost 500,000
in 2016. The capacity of flights to the United States fell over the global financial crisis period,
but has since recovered, growing above the previous high in capacity due to new flights to
Houston and San Francisco, and growth in the number of existing flights to Los Angeles.
Other growth areas include the Middle East, where a new flight from Qatar Airways from
Doha to Auckland is planned in February 2017 (which will break records for being the longest
commercial long-haul flight in the world).
MINISTRY OF BUSINESS, INNOVATION AND EMPLOYMENT                                                                             TOURISM INFRASTRUCTURE                                          AUGUST 2016
                                                                                                                                 TOURISM INSIGHT SERIES

26   Figure 13: Annual inbound capacity to New Zealand by origin country

                                          South America                                                                               Australia                                                                    Southeast Asia
                                                                                                   5,000,000
                                                                                                                                                             AUSTRALIA                                                                      SINGAPORE
                                                                        CHILE                      4,750,000                                                                               300,000
                  150,000

                                                                                                   4,500,000
          Seats

                                                                                           Seats

                                                                                                                                                                                   Seats
                  100,000                                                                                                                                                                  200,000                                                 MALAYSIA
                                                                                                   4,250,000
                                                                                                                                                                                                                                            THAILAND
                   50,000                                         ARGENTINA                                                                                                                100,000                   BRUNEI
                                                                                                   4,000,000                                                                                                                            INDONESIA
                                                                                                                                                                                                                                                 VIETNAM
                       0                                                                           3,750,000                                                                                    0
                            2008
                                   2009
                                          2010
                                                 2011
                                                        2012
                                                               2013
                                                                      2014
                                                                             2015
                                                                                    2016

                                                                                                                 2008
                                                                                                                        2009
                                                                                                                               2010
                                                                                                                                       2011
                                                                                                                                               2012
                                                                                                                                                      2013
                                                                                                                                                              2014
                                                                                                                                                                     2015
                                                                                                                                                                            2016

                                                                                                                                                                                                     2008
                                                                                                                                                                                                            2009
                                                                                                                                                                                                                   2010
                                                                                                                                                                                                                          2011
                                                                                                                                                                                                                                 2012
                                                                                                                                                                                                                                         2013
                                                                                                                                                                                                                                                 2014
                                                                                                                                                                                                                                                        2015
                                                                                                                                                                                                                                                               2016
                                          North America                                                                         Central Asia                                                                               Pacific
                  600,000                                                                                                                                                                  300,000
                                                                UNITED STATES                                                                                                                                                                   FIJI ISLANDS
                                                                                                   400,000                                                      CHINA

                  400,000
                                                                                                   300,000
          Seats

                                                                                           Seats

                                                                                                   200,000
                  200,000

                                                                      CANADA                       100,000                                                                                 200,000
                            2008
                                   2009
                                          2010
                                                 2011
                                                        2012
                                                               2013
                                                                      2014
                                                                             2015
                                                                                    2016

                                                                                                               2008
                                                                                                                      2009
                                                                                                                             2010
                                                                                                                                      2011
                                                                                                                                              2012
                                                                                                                                                      2013
                                                                                                                                                             2014
                                                                                                                                                                     2015
                                                                                                                                                                            2016
                                                                                                                                                                                                                                          COOK ISLANDS

                                                                                                                                                                                   Seats
                                                                                                                                                                                                                                        WESTERN SAMOA
                                                 Far East                                                                                    Gulf
                                                                                                   81,636.50                                                                                                                                            TONGA
                                                                                                                                                                                           100,000
                  300,000
                                                                                                                                                                                                                                  FRENCH POLYNESIA
                                                                                                   81,636.25
                                                         HONG KONG - CHINA
                  200,000                                                                                                                                                                                                               NEW CALEDONIA
          Seats

                                                                                           Seats

                                                                                                   81,636.00
                                                                                                                                                                                                                                                VANUATU
                                                                       JAPAN
                                                                                                                               UNITED ARAB EMIRATES
                  100,000                                                                                                                                                                                                                           NIUE
                                                                SOUTH KOREA                        81,635.75
                                     TAIWAN
                                                                                                                                                                                                                                    NORFOLK ISLANDS
                       0                                                                                                                                                                        0
                                                                                                   81,635.50
                            2008
                                   2009
                                          2010
                                                 2011
                                                        2012
                                                               2013
                                                                      2014
                                                                             2015
                                                                                    2016

                                                                                                                                               2016

                                                                                                                                                                                                     2008
                                                                                                                                                                                                            2009
                                                                                                                                                                                                                   2010
                                                                                                                                                                                                                          2011
                                                                                                                                                                                                                                 2012
                                                                                                                                                                                                                                         2013
                                                                                                                                                                                                                                                 2014
                                                                                                                                                                                                                                                        2015
                                                                                                                                                                                                                                                               2016
     Source: Sabre

     3.2.3 Planned/New growth in capacity
     New Zealand airports have announced a number of new flights across 2016 that should
     increase capacity in the short-to-medium term. A full list of these flights is presented in
     Appendix 1.

     3.2.4 Airport infrastructure
     Several construction projects are in the pipeline to expand international airport capacity.
     These projects are required to support the growth in tourist numbers that additional flights
     will bring.

     As part of its 30-year plan, Auckland International Airport plans to build a new terminal, a new
     northern runway and a new taxi apron, at an estimated cost of $2.4 billion.13 The new terminal
     will be built in stages, with the plan to be able to accommodate up to 40 million domestic and
     international passengers annually,14 and have 94 spaces for aircraft to park. The first stage of
     the plan, to be completed by 2019, is to merge the domestic and international terminals. More
     car parking will be in place by 2022. Space has been allocated for a rail corridor and underground
     station as part of the plan.

     13 Auckland Airport. (2014). Airport of the future: Our vision for the next 30 years. Retrieved from http://www.aucklandairport.
     co.nz/downloads/aial-masterplan.pdf
     14       The existing airport terminal accommodated 16.5 million passengers in 2015.
MINISTRY OF BUSINESS, INNOVATION AND EMPLOYMENT   TOURISM INFRASTRUCTURE   AUGUST 2016
                                                  TOURISM INSIGHT SERIES

Construction of a new 10-storey, 1,000-space car park at Wellington Airport is underway.             27
This $70 million project should be completed by the end of 2017. Work is also underway
on a new control tower, estimated to cost around $18 million, to be completed late 2016.
Wellington Airport lodged a resource consent application to extend Wellington’s runway
on 28 April 2016. The proposed $300 million extension, if successful, will increase the runway
south by 354 metres, allowing direct long-haul flights to Asia. A resource consent hearing
on the proposal is expected to occur in February 2017.

Queenstown Airport’s $18 million expansion was completed in April 2016. This was an 18-week
construction project, including widening the airport’s runway from 15 metres to 45 metres,
installing runway, taxiway, apron and approach lights, and trenching for electrical cabling.
The investment is designed to increase the capacity of the airport by allowing aircraft
operations to be extended beyond a ‘daylight hours only’ limitation.

In all, around $2.8 billion of work is in the pipeline for New Zealand’s international airports,
the lion’s share (85 per cent) being for Auckland’s long-term terminal development.

3.2.5 Sustainability of air services
Load factors measure the percentage of total seats on a flight being used by passengers.
They are one of the few readily available measures to assess how an air service might be
performing financially for an airline and whether there may be incentives to grow or reduce
capacity on a particular route. However, for airline operators, a number of other important
questions are involved in such a decision. These factors include, but are not limited to:

a. Revenue quality – a function of not only the volume of passengers but also the price
   at which a given level of volume exists. This influences whether the resultant revenue
   is derived at an economically sustainable level.
b. Opportunity cost/prioritisation – Given finite capital, is growth in an existing service
   or the introduction of a new service the best possible option for deploying that capital
   in terms of risk and return?

Both of the above factors necessarily include some consideration by an airline of how successfully
a new service is expected to compete against other airline offerings in a particular market.

New Zealand has one of the most open air services markets in the world. There are relatively
few, if any, barriers to entry other than the commercial risks inherent in operating international
flights themselves. Air services are capital intensive, labour intensive and sensitive to both
fuel price fluctuations and sudden changes in the demand environment.

Subject to an airline’s assessment of those commercial risks, opportunities for growth are
typically seized upon quickly. This is evidenced by the pace and scale of the growth seen in the
number of international air services that have either started and/or been announced over the
past 18 months across each of New Zealand’s key tourism markets, including Australia, China,
the United States, the United Kingdom/Europe, South East Asia and Japan.

From the Australia market, annual average load factors are generally growing across all
airports (apart from Queenstown). The load factor into Auckland has been increasing since
2013 from 70 per cent up to 75 per cent.

The Auckland load factor is lower than both Wellington and Dunedin. Dunedin, as a relatively
niche international airport serving only Australia, has a load factor over 80 per cent. Outside
of the Australian market, some clear patterns emerge. Pacific Island countries, including
New Caledonia, Tonga, French Polynesia and Western Samoa, have seen strong increases
in load factors over the last two to three years.
MINISTRY OF BUSINESS, INNOVATION AND EMPLOYMENT   TOURISM INFRASTRUCTURE   AUGUST 2016
                                                       TOURISM INSIGHT SERIES

28   Given these countries are more likely tourist destinations rather than tourist sources, and
     given New Zealand’s close ties with the Pacific, it suggests that these flights are catering for
     either New Zealand tourists and international tourists using New Zealand as a base, or for
     visiting friends and relatives in these islands.

     In conclusion, it looks likely that New Zealand will continue to attract more airlines eager to
     expand existing routes and grow new ones. Conversely, there is little fear that existing routes
     will close within the current environment.
You can also read