OUTBOUND CANADA U.S. Regional Travel Outlook 2017-2021 - June 2017
←
→
Page content transcription
If your browser does not render page correctly, please read the page content below
OUTBOUND CANADA
U.S. Regional Travel Outlook
                  2017-2021

                       June 2017
Table of Contents
Background .................................................................................................................................................................................. 1
Forecast Assumptions and Risks .................................................................................................................................................. 1
Canadian Economic Trends .......................................................................................................................................................... 2
Outbound Leisure Travel Forecast ............................................................................................................................................... 4
United States Tourism Performance............................................................................................................................................ 5
Airline Seat Capacity ............................................................................................................................................................. 7
Future Visits (Regional Outlook) .................................................................................................................................................. 8
New England ......................................................................................................................................................................... 8
North Central and Atlantic.................................................................................................................................................... 9
Mountain and Pacific Region ................................................................................................................................................ 9
Future Visits (Selected Destinations) ......................................................................................................................................... 10
Florida ................................................................................................................................................................................. 10
Orlando .................................................................................................................................................................... 11
Arizona ................................................................................................................................................................................ 12
Phoenix .................................................................................................................................................................... 12
Nevada ................................................................................................................................................................................ 13
Las Vegas .................................................................................................................................................................. 13
California............................................................................................................................................................................. 14
Los Angeles .............................................................................................................................................................. 14
Hawaii ................................................................................................................................................................................. 15
iBackground The Conference Board prepares annual five-year forecasts of Figure 1. Drivers of Outbound Travel travel by Canadians to the USA, the Caribbean, Mexico, Demand Asia/Pacific, and Europe. Many data sources are used to develop these forecasts. The main drivers of outbound leisure travel demand considered within the forecasts are depicted in Figure 1. The Conference Board is the largest economic forecaster in Canada with econometric models of the economy at national, provincial, metropolitan, and industrial levels. These models, involving over one thousand variables, are an important input into the outbound travel forecasts. The data collected from the travel intentions surveys conducted each year is another input into the travel forecasts. Other sources used include planned air capacity, marketing/ development reports, event data, political and environmental insights, and Canada’s demographic profiles. The forecasts assume that no major economic, political, military, or terrorist events will take place over the forecast period and that no major health or environmental issues will occur. Forecast Assumptions and Risks Direct air capacity is always a crucial variable to a forecast for a specific destination. An increase or decrease in direct capacity to a destination usually has a significant effect on arrivals. Additional capacity can occur either when a new carrier enters a market, or an existing provider introduces new routes or an increase in service. Air capacity is also affected by the demise of carriers which reduces available seats and can result in higher air fares. No carrier failures are anticipated over the forecast period. As such, the current forecast assumes that seat capacity data filed with OAG as of May 2017 will not change significantly during the remaining months of the year. Economic factors such as exchange rates and the growth in Canadian’s real disposable income impacts the volume of outbound travel, while conflict, war, and other political, environmental and health issues influence travel patterns. Civil unrest, terrorist attacks, health crises, and significant weather events can have a short-term negative impact on travel to a destination. Since the end of the recession in 2009, Canada’s economy grew at a rate that supported outbound leisure travel. This trend began to change along with economic performance in 2014, and has faltered somewhat in recent years. Looking forward, significant outbound growth is not anticipated, but Canada’s leisure tourism activity is expected to be fairly stable throughout the forecast period. That said, regional differences will continue to occur. Population demographics continue to be a key factor in outbound travel performance. Canada’s population will grow by just 4.1 per cent over the forecast period, leaving baby boomers (those born between 1946 and 1964) as the primary driver of outbound leisure travel performance. In addition, multi-generational travel will be further supported by the recent demographic shift; as of 2015 there were more seniors (65+) in Canada than children (≤14). A number of economic, demographic, and industrial factors will support outbound leisure travel during the forecast period. While the volume of outbound trips is forecast to increase over the next five years, not all destinations will share equally in this growth. ©Conference Board of Canada 1
Canadian Economic Trends

Between 2010 and 2014, Canada’s economy grew at a rate that supported outbound leisure travel. Then, the resource
sector started to take a hit resulting in lackluster performance in 2015. While there were large regional differences in the
country, business investment was weak in many sectors throughout 2016. The result was an economy that grew by a
modest 1.2%.

Looking forward, economic growth is projected to be more normal in 2017 but is expected to fall again in 2019. Growth will
be fueled by federal government stimulus spending and a small recovery in energy investment, but weak business
investment remains a concern. Provincially, the Conference Board of Canada forecasts strong economic growth in Alberta,
British Columbia, Saskatchewan, and Ontario over the short-term. Ontario, Quebec, BC, and Alberta produce the highest
volume of travellers so healthy economic growth in these regions should positively impact outbound travel activity.

Figure 2. Per cent change in real GDP, basic prices (2007 $)

                                  3.5%
                                          3.3%

   2.5%                                                      2.5%       2.6%
                                                                                                2.3%
                                                    1.9%                                                1.9%      1.8%    1.8%      1.8%
                                                                                         1.2%
             0.7%                                                                0.9%

   2007      2008     2009        2010    2011      2012     2013       2014     2015    2016   2017f   2018f     2019f   2020f     2021f

                      -3.2%

Source: CBoC forecast, May 2017

While household consumption will remain fairly flat, Canadians' real disposable income is forecast to see 2.1 per cent
growth this year, and average 1.7 per cent throughout the forecast period. But inflation, especially travel prices, are rising
faster than that. And, Canadian consumer debt is now a record 165% of disposable income. Most of that borrowing has
gone to buying houses, but people are increasingly interested in consuming experiences, rather than buying more stuff.

These income factors are sufficient to support outbound leisure travel, but growth will be modest as exchange rates
continue to impact travel and spending patterns. After trading at par for an extended period, the loonie lost 25 per cent of
its value against the U.S. dollar between 2013 and 2016. The most significant decline occurred in 2015 when the loonie
dropped to its lowest level since 2004. In response, trips to the U.S. took a significant hit. The dollar has now stabilized
somewhat, but is only expected to post an annual USD average in the mid- seventy-cent range through 2021. At the same
time, the Euro is expected to average $1.62 CAD, and the Pound is forecast to average $1.86 CAD.

  Economic Indicators                                           2017f            2018f          2019f           2020f         2021f
  Real GDP, market prices (2007 $) (% change)                   2.3%             1.8%           1.8%            1.7%             1.7%
  Real Disposable Income, basic prices (% change)               2.1%             1.4%           1.5%            1.6%             1.7%
  Household Spending, basic prices (% change)                   2.0%             1.8%           1.8%            1.8%             1.7%
  CAD/USD                                                       $1.34            $1.33          $1.30           $1.29         $1.28
  CAD/EUR                                                       $1.57            $1.63          $1.64           $1.58         $1.68
  CAD/GBP                                                       $1.86            $1.87          $1.87           $1.85         $1.84
Source: Conference Board of Canada (May 2017 Outlook), Scotia FX World Outlook

©Conference Board of Canada                                                                                                                 2
Canadian Demographics
Canada’s population is expected to surpass 38.1 million by 2021, an increase of 4.1 per cent compared to 2017. Impacted
by provincial migration patterns, growth will be greatest in Alberta (7.2%) and Saskatchewan (5.8%). The most populous
provinces—Ontario and Quebec—are expected to see some of the lowest population changes during the period, increasing
4.1 per cent and 3.1 per cent, respectively.
In addition, the composition of the population is changing. According to the Census, the foreign-born population has
tripled in the past twenty years, and continues to grow. Projections indicate that by 2031, Canada’s visible minority
population could rise to 12.8 million, an increase of 143 per cent. In conjunction with this increase, the place of birth of
foreign-born persons in Canada will exhibit major changes through 2031. The proportion of Asian-born persons will
continue to steadily increase, replacing the proportion of persons born in Europe. This change in the structure of the
population, will impact where people travel.
Figure 3. Canadian Population Forecast, 2017-2021 (% change)
Atlantic Canada 0.1%
Quebec 3.1%
Ontario 4.1%
Manitoba 4.7%
Saskatchewan 5.8%
Alberta 7.2%
British Columbia 4.5%
Territories 2.8%
Canada 4.1%
Source: CBoC forecast, December 2016
The aging of the population will also affect travel patterns as the share of Canadians aged 55+ continues to increase.
Between 2017 and 2021, the proportion of Canadians aged 55-64 will increase 4.4 per cent, while the share of people aged
65 and older will increase 15.0 per cent. This trend applies across many of the provinces as well. For example, in Ontario,
where the largest outbound travel market resides, the proportion of residents aged 55-64 will increase 7.2 per cent, while
those aged 65+ will increase 14.8 per cent. This phenomenal rate of aging has resulted in a historical first. As of 2015, the
number of Canadians aged 65+ outnumbered children age 14 and under. This is good news for organizations who rely on
outbound travel performance.
Figure 4. Per cent change in population by age and region, 2021 versus 2017
% change in Atlantic
Quebec Ontario Manitoba Saskatchewan Alberta BC Canada
population by age Canada
under 15 -0.9% 5.1% 3.5% 5.8% 8.0% 9.0% 3.4% 4.5%
15-24 -6.5% -5.2% -3.6% -1.4% -0.2% -1.3% -2.2% -3.2%
25-34 -3.7% 1.8% 5.1% 4.9% 3.1% 1.0% 4.1% 3.0%
35-44 -2.5% 4.1% 5.9% 8.5% 14.9% 15.2% 7.1% 6.7%
45-54 -9.3% -5.2% -6.4% -3.4% -2.0% -0.1% -4.5% -4.9%
55-64 1.2% 1.9% 7.2% 3.5% 1.3% 7.8% 3.2% 4.4%
65+ 14.4% 13.6% 14.8% 13.3% 13.1% 19.3% 16.2% 15.0%
Source: CBoC forecast, December 2016
©Conference Board of Canada 3Since Canadians aged 55 and older are more likely to travel outside of Canada for leisure purposes than their younger
counterparts Canada’s aging population will help grow outbound leisure travel in the short-term. In fact, if Canadians 55
and older take the same proportion of pleasure trips in 2020 as they did in 2010, trips to the U.S. by this age cohort would
see growth of 33.7 per cent and travel to non-U.S. destinations would increase 32.3 per cent. In contrast, the volume of
trips by Canadians aged 35-54 would decline due to a drop in the number of Canadians aged 45-54.
Even though travel frequency declines after age 74, older Canadians are now healthier, wealthier, and more mobile than
their predecessors. This will positively influence overseas travel over the next five years, but in the long-run, leisure
destinations in the U.S., the Caribbean, and Mexico will be more popular for the older population due to their proximity to
"home". In the short-term, the U.S. is expected to capture an average of 60 per cent of all Canadian outbound leisure trips,
which is down from previous years as more Canadians explore other parts of the globe, and large increases in immigration
continue to boost VFR trips to other countries. However, leisure destinations in the U.S. will slowly recapture their share of
the outbound market.
Outbound Leisure Travel Forecast
In 2016, Canadians of all ages made an estimated 23.8 million overnight leisure trips to the U.S. and other destinations.
While this was the second consecutive year of decline, unlike the shocks experienced in 2009 and 2002, trips to the U.S.
took a huge hit compared to overseas travel. During the year, leisure travel to the U.S. declined -7.7 per cent while overseas
trips grew 2.4 per cent. The acute declines in U.S. travel experienced of late are waning but trip volumes are still being
affected by overnight automobile travel, which declined by more than three million trips since its peak in 2013. As a higher
proportion of Canadians continue to visit non-U.S. destinations, the share of overseas leisure trips grew to 38 per cent in
2016; a trend that is not expected to reverse during the forecast period.
Looking forward, outbound leisure travel is forecast to grow at a slower rate than what was experienced in the past decade.
However, a shift in the demographics of travellers combined with increased visitation to overseas destinations will help
overall outbound travel performance in the coming years. Some key factors to note are that aging boomers are more
adventurous than the demographic that preceded them, and they have money to travel. Also, VFR trips related to
immigration trends are expected to continue to increase, and a lot of new air capacity has come online for Europe and Asia.
Figure 5. Outbound Leisure Trips to U.S. and Overseas Destinations (millions)
2009 14.2 7.1
U.S. Leisure Trips
2010 15.6 7.6
Overseas Leisure Trips
2011 16.7 7.9
2012 18.0 8.3
2013 18.7 8.1
2014 18.1 8.6
2015 15.9 8.9
2016p 14.8 9.5
2017f 15.1 9.9
2018f 15.5 10.1
2019f 16.0 10.4
2020f 16.7 10.6
2021f 17.4 11.0
Source: Statistics Canada, CBoC estimates.
©Conference Board of Canada 4Outbound leisure travel is forecast to grow at an average annual rate of 3.4 per cent between 2017 and 2021. Overseas
travel will be supported by a larger volume of older Canadians and immigration patterns. Following a couple of years of
declines, leisure trips to the U.S. are forecast to return to a more normal growth scenario in 2017. Throughout the forecast
period, trips to the U.S. are expected to post a compound average annual rate of growth of 3.6 per cent through 2021,
while the average annual rate expected for overseas destinations is 3.0 per cent
Figure 6. Annual Rate of Growth by Region, 2017-2021
4.2%
3.6%
3.0% 3.0%
2.9%
2.4%
2.2% 2.2%
1.6%
Caribbean Mexico South Central Europe Asia Oceania Total U.S.
America America Overseas
Source: CBoC
United States
Tourism Performance
It is well-known that the early 2000s were wrought with many unforeseen challenges for the tourism sector. 9/11, SARS,
and the war in Iraq occurred back-to-back. Trip volumes dropped off, then recovered a few years later as the value of the
dollar increased. Combined with pent-up demand, there was a 70.7 per cent increase in overnight leisure visits to the States
between 2004 and 2014. After reaching a peak of 18.1 million in 2014, leisure visits fell -12.2 per cent in 2015 and another
-7.8 per cent in 2016 to settle at the lowest level since the global recession. Interestingly, the latest shock of a tumbling
dollar had a more acute year-over-year impact than either the global recession (-3.0%) or 9/11 (-4.5%).
This dreary performance was driven primarily by reductions in auto travel. About 6 in 10 overnight leisure trips to the U.S.
are via automobile and auto travellers are much more price sensitive than people who travel by other modes. The good
news is that the share of trips by air is growing. Twenty years ago, just one-fifth of visitors flew to their U.S. destination.
This share has now increased to more than one-third partly because there is a lot more capacity available as the travelling
population demands ease of access. It is also a result of the attractiveness of convenient and cost-effective air options as
people increasingly take more frequent trips but of shorter duration.
The story still isn’t great for U.S. destinations, but it could be a lot worse. While an increasingly smaller share of outbound
trips are currently destined for the States, the good news is that a large proportion of U.S. travellers are 55 or older, which
is not only the fastest growing age cohort in the Country, but this group has also kept outbound leisure travel performance
from dropping off more significantly over the past couple of years. And, six-in-ten visitors are from Ontario and Quebec—
provinces with healthy economies and excellent access to many U.S. destinations.
©Conference Board of Canada 5Another reason trips stateside didn’t fall more drastically in the last couple of years is because of snowbird activity. When
overall outbound travel declined in 2015 and 2016, snowbird trips increased. Since 2000, Canada's snowbird market has
grown at an average annual rate of 9.8 per cent. Although snowbird trips to countries other than the U.S. are growing, this
trend will gradually reverse as more Canadian travellers move into the 65+ age category. Canadians are much more likely
to travel domestically or to the U.S. as they get older. They also march to their own drum and don’t let politics dictate their
leisure activities.
In January 2017, the Conference Board of Canada administered an online survey of Canadian adult travellers which
focussed on people who are likely to vacation in the U.S. This group were asked questions regarding the Trump Presidency
and any impact on their travel plans. Overall, 37 per cent of Canadians who said they are likely to take a leisure trip to the
U.S. over the next few years reported that the Trump Presidency would negatively impact their travel intentions. However,
the likelihood of the Trump Presidency negatively impacting travel to the U.S. reportedly decreases with age. A full half of
travellers aged 18-24 said they are less likely to travel to the U.S. under the current regime compared with one-quarter
(27%) of travellers aged 65+. Provincially, travellers from Quebec are the most ambivalent about impacts to their trip plans
(56% say it will have no impact), while a large proportion of travellers from BC (44%) and Ontario (38%) reported being less
likely to vacation stateside while Trump is in Office. In addition, while just 31 per cent of male travellers reported a negative
impact on their travel plans, 43 per cent of women said they are now less likely to travel to the U.S.
The “Trump Slump” could reduce performance regionally, but older travellers are less likely to be swayed by politics, which
should help temper the impact. With a forecasted average exchange rate in the mid-seventies, overnight leisure trips
stateside are estimated to gain some momentum this year. Throughout the forecast period, trip volumes are forecast to
grow at an average annual rate of 3.6 per cent.
Figure 7. Outbound Overnight Leisure Trips to the U.S., 2009-2021 (millions)
18.7
18.0 18.1
17.4
16.7 16.7
15.6 15.9 16.0
15.1 15.5
14.8
14.2
2009 2010 2011 2012 2013 2014 2015 2016p 2017f 2018f 2019f 2020f 2021f
Source: Statistics Canada, CBoC.
The vast majority of overnight leisure trips to the U.S. are via price-sensitive auto travellers. The exchange rate has
stabilized, but the low value of the loonie will continue to affect the volume of auto trips. Trips by automobile are forecast
to grow at an average annual rate of 2.8 per cent between 2017 and 2021, while trips by other modes are forecast to grow
at an average annual rate of 4.9 per cent.
©Conference Board of Canada 6Figure 8. Overnight Auto Travel and the Canadian Dollar, 2005-2021
13.0
Overnight Auto Trips $1.00
$0.95
12.0 Average Annual Exchange Rate
$0.90
Millions of Overnight Leisure Trips
11.0 $0.85
$0.80
10.0 $0.75
$0.70
9.0
$0.65
$0.60
8.0
$0.55
7.0 $0.50
$0.45
6.0 $0.40
2005 2006 2007 2008 2009 2010 2011 2012 2013 2014 2015 2016p 2017f 2018f 2019f 2020f 2021f
Source: Statistics Canada, CBoC.
Airline Seat Capacity
Since 2012, direct capacity from Canada has increased at an average annual rate of 2.1 per cent to surpass 18.5 million
scheduled seats in 2017. In volume terms, California, Florida, New York, Illinois, and Texas will account for over 9.6 million
seats in 2017, which represents 51.9 per cent of direct capacity. However, even though they remain in the top five, both
Florida (-5.3%) and New York (-2.9%) will see fewer direct seats this year compared to last. Compared to 2016, the South
Central region will see the largest growth in seat capacity this year (+13.0%), followed by New England (12.7%) and the
Pacific region (8.1%). From a State point-of-view, the biggest increases will be seen in Tennessee (64.6%), Utah (26.3%),
Louisiana (24.2%), Indiana (22.8%), and Colorado (19.9%). Half of the new capacity to these destinations will be provided
by Air Canada (50.9%).
Figure 9. Direct Seat Capacity to U.S. Destinations by Carrier, 2012-2017
Carrier 2012 2013 2014 2015 2016 2017 CARG (2012-2017)
Air Canada 5,607,327 5,601,187 5,896,443 6,625,152 7,490,023 8,221,551 8.0%
WestJet 2,185,160 2,439,555 2,605,099 2,656,694 2,841,391 2,941,143 6.1%
United 2,834,298 3,127,568 3,044,144 2,573,323 2,217,284 2,171,046 -5.2%
Delta 1,466,775 1,446,643 1,498,575 1,693,552 1,918,987 1,977,282 6.2%
American Airlines* 2,507,786 2,376,905 2,288,302 2,050,629 1,661,418 1,526,876 -9.4%
Porter 603,680 618,170 669,254 676,878 694,490 724,682 3.7%
Alaska Air 767,474 769,055 792,602 658,106 584,951 589,320 -5.1%
Other Carriers 693,688 349,381 354,909 439,732 460,709 367,473 -11.9%
Total 16,666,188 16,728,464 17,149,328 17,374,066 17,869,253 18,519,373 2.1%
Source: OAG. *Includes US Airways.
©Conference Board of Canada 7Future Visits (Regional Outlook)
When asked where in the U.S. they were most interested in visiting, Canadians again ranked New York City and Las Vegas at
the top of the list. These two destinations ranked first and second for all age groups. Backed by interest from travellers
aged 55+, Boston moved up two positions in the rankings, while Phoenix dropped one spot. Orlando took the third spot
overall, but interest varies by age. Canadians aged 35-54 ranked Orlando higher than those aged 18-34 or 55+. Canadians
aged 55+ remain less likely than younger travellers to identify Florida destinations as places they are interested in visiting,
which will negatively impact visitor volumes. Even so, Florida will continue to be the top U.S. state for Canadian leisure
travellers when measured in both visit nights and dollars spent.
Figure 10. Interest in Visiting U.S. Destinations Sometime in the Future (% of Canadians by Age)
age 18-34 age 35-54 age 55+ age 18-34 age 35-54 age 55+
New York City 49.7% 42.1% 27.4% Chicago 27.8% 18.4% 10.2%
Las Vegas 49.2% 41.2% 26.1% Florida Keys 18.7% 19.4% 14.9%
Orlando 37.2% 29.7% 14.2% San Diego 20.6% 15.8% 8.8%
Maui 31.1% 24.6% 15.9% Texas 16.7% 13.7% 10.4%
Los Angeles 39.1% 25.8% 8.4% Cape Cod area 10.4% 12.9% 15.1%
Boston 28.0% 22.5% 17.5% Fort Lauderdale 13.1% 11.7% 8.8%
Miami 39.3% 20.6% 7.7% Phoenix 10.1% 10.5% 8.5%
Source: CBoC travel intentions survey, October 2016.
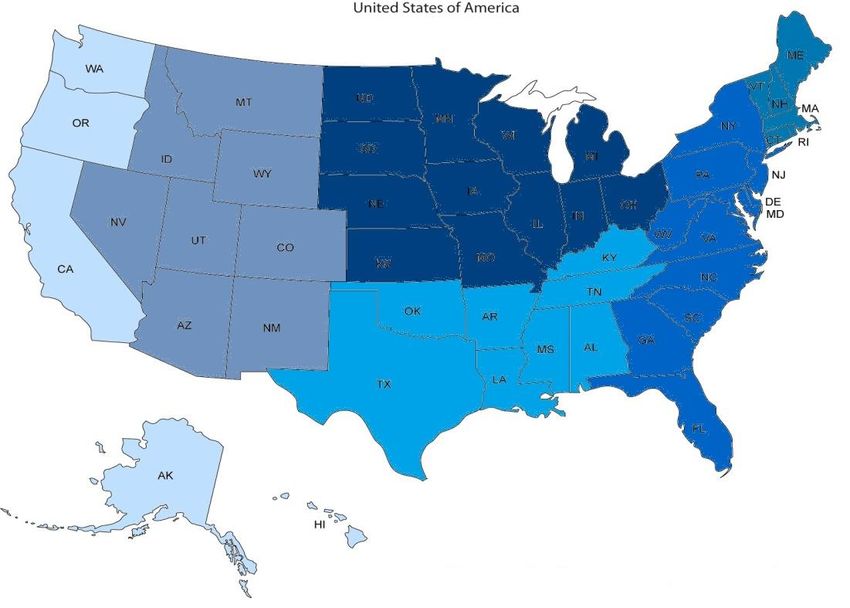
Figure 11. U.S. States by Travel Region
New England
Atlantic
North Central
South Central
Mountain
Pacific
New England
Following significant expansion last year, new and expanded service will add another 87 thousand direct seats to the region
in 2017. Most of the new capacity is being offered by Air Canada and WestJet and is destined for Boston. This increase in
direct capacity along with healthy visit interest by older travellers and the size of the outbound market in the key markets
of Ontario and Quebec will help trips to New England grow at an average annual rate of 4.0 per cent between 2017 and
2021. The region's overall market share is expected to average 10.3 per cent through 2021.
©Conference Board of Canada 8North Central and Atlantic
Following the trend that began with the decline in the value of the Canadian dollar, visitation to border states in the North
Central and Atlantic regions will continue to be impacted by a weak overnight auto market this year. However, the reality
of a sub-par dollar along with proximity to Canada's largest travel markets—Ontario and Quebec will help trip volumes to
destinations such as Michigan, Ohio, Pennsylvania, and New York recover by 2018. Over the forecast period, North Central
should see an average annual rate of growth of 2.9 per cent, while the rate of growth in the Atlantic region, including
Florida, is estimated to be 3.2 per cent. Florida will see more than 2.2 million direct seats in 2017, but this represents a -5.3
per cent decline compared to 2016. This reduction in capacity along with waning interest from key markets will negatively
affect travel volumes in the short-term.
Mountain and Pacific Region
Now that the resource sector has begun to recover, trip volumes from Central Canada and Alberta are expected to stabilize.
This activity, along with new air capacity and strong demand from British Columbia and Ontario, will help Mountain and
Pacific destinations see some growth in the coming years. Direct air capacity to the Pacific region, including California, will
see an increase of 347 thousand seats in 2017 (8.1%), while the Mountain region will see growth of 2.1 per cent.
With capacity to Hawaii expected to decline slightly in 2017, arrivals are expected to follow suit. Solid visit interest and the
strength of Hawaii’s repeat market will help support arrivals, but the market will not be as robust as was between 2010 and
2015. Now that the Alberta economy is recovering, visitation to Arizona is expected to recover some of its lost market
share throughout 2018. Las Vegas continues to be a destination Canadians intend to visit in the short-term, but high costs
continue to reduce Canadian travel volumes to Nevada. Of key destinations in the region, California is expected to see
decent growth in the short-term as carriers introduce new and expanded routes from Canada.
Overall, the Mountain region is forecast to post an average annual rate of growth of 3.3 per cent, while the Pacific region is
expected to see an average annual rate of growth of 4.3 per cent.
Figure 12. Visits to the U.S. by Region, 2012-2021 (millions of visits)
2011 2,420 8,778 3,377 3,286 4,227
2012 2,412 9,500 3,481 3,314 4,684
2013 2,536 9,767 3,235 3,588 5,305
2014 2,552 9,535 3,194 3,494 5,382
2015 2,204 8,351 2,882 3,051 4,542
2016p 2,083 7,791 2,689 2,847 4,238
2017f 2,109 7,832 2,715 2,757 4,678
2018f 2,194 7,880 2,726 2,833 4,771
2019f 2,264 8,090 2,792 3,078 4,880
2020f 2,369 8,372 2,875 3,243 5,175
2021f 2,471 8,876 3,047 3,143 5,542
New England Atlantic North Central South Central Mountain Pacific
Source: Statistics Canada, CBoC estimates. Note that the volume of visits amounts to more than the number of trips as more than one state can be visited
during the course of a single trip.
©Conference Board of Canada 9Future Visits (Selected Destinations)
Florida
While visitation from Canada declined in 2016, Florida remains the number one outbound travel destination for Canadians.
Since the loonie started to lose value in 2014, Florida has seen its volume of trips decline, dropping from 4.2 million trips in
2013 to almost 3.4 million in 2016. At the same time, direct air arrivals grew 16.9 per cent, and now represent about
almost half of visits. Ease of access and direct service to new destinations continues to be a key factor in tourism
performance in the state, but visit interest from older Canadians is waning. However, even though a smaller proportion of
Canadians aged 55+ indicate a desire to visit various destinations in Florida, 39.0 per cent of Canadian visitors to the State in
the past two years were born between 1945-1965.
Figure 13. Proportion of Travellers Aged 55+ Interested in Visiting Florida (in the Next Three Years), 2014-2016
6.0%
5.0% Orlando
4.0% Ft. Lauderdale
3.0% Miami
2.0% Florida Keys
1.0% Elsewhere in Florida
0.0%
2014 2015 2016
Source: Conference Board of Canada annual travel intentions survey
While population trends and ease of access will help visitation to the state recover from the recent declines in travel
volumes, the exchange rate will continue to negatively affect indirect arrivals and trips by automobile. Between 2014 and
2016, indirect arrivals, including auto trips, fell by more than one-third (-36.2%). The market is not expected to post
significant growth in the short-term, but will recover some of its lost market share through 2017 and 2018. Overall,
visitation is forecast to post an average annual rate of growth of 2.6 per cent during the forecast period.
Figure 14. Visits by Canadians to Florida each year (000s)
4,187
4,016
3,797
3,559 3,468 3,552 3,647
3,319 3,240 3,292 3,348
3,102
2,872
2,644
2,485
2,098
2006 2007 2008 2009 2010 2011 2012 2013 2014 2015 2016p 2017f 2018f 2019f 2020f 2021f
Source: Statistics Canada, CBoC estimates.
©Conference Board of Canada 10Orlando
Thanks to increased capacity to Orlando International, direct air arrivals in Orlando grew from 537 thousand in 2015 to 584
thousand in 2016. Even though there was a decline in indirect arrivals, growth in capacity to MCO along with new service to
Sanford and Melbourne airports resulted in almost 1.2 million arrivals in 2016. While some Florida destinations faltered,
Orlando saw a 1.9 per cent increase in overall arrivals during the year.
With direct air arrivals now accounting for almost half of all leisure visits to Orlando, seat capacity is a key contributor to
annual performance. Air Canada is planning some expansion in 2017, but other carriers are not reporting any new capacity,
resulting in minimal growth in direct arrivals throughout the year. After falling to the lowest level since 2011, indirect
arrivals are starting to regain some lost ground, but the proportion of visitors by land and through connecting traffic is not
expected to post much growth throughout the forecast period. Overall, visits to Orlando are forecast to grow at an average
annual rate of 1.5 per cent between 2017 and 2021.
Figure 15. Orlando (MCO) Capacity and Direct Arrivals, Annual
690,794
684,915
Seats Passengers
614,628
595,312
584,283
570,851
537,031
529,721
528,906
503,807
483,824
481,573
469,484
455,483
447,992
441,838
425,705
394,380
384,045
372,337
2008 2009 2010 2011 2012 2013 2014 2015 2016p 2017f
Source: OAG, CBoC estimates.
Figure 16. Canadian Visits to Orlando each year (000s)
1,275 1,291
1,215 1,236 1,263
1,170 1,180 1,192
1,140
1,085
1,015
960
910
865
2008 2009 2010 2011 2012 2013 2014 2015 2016p 2017f 2018f 2019f 2020f 2021f
Source: Visit Orlando, CBoC estimates.
©Conference Board of Canada 11Arizona
As expected, the decline in economic performance in Arizona’s key Canadian market, Alberta, resulted in a significant drop
in visitation of late. Between 2014 and 2016 Canadian visits to the State fell -14.2 per cent, with much of the drop occurring
in 2016. With close to half of visits to Arizona made by residents of the Prairie provinces, trip volumes to the state will
regain ground as the Alberta economy continues to grow. Though travel performance will lag economic growth, Alberta is
on track to post one of the largest increases in provincial GDP throughout 2017.
That said, a reduction in seat capacity will negatively affect performance. Direct seat capacity from Canada grew
significantly between 2008 and 2015, then fell to 536 thousand seats as American Airlines further reduced capacity from
Alberta. Even though Air Canada has plans to increase capacity in 2017 and WestJet will begin service to Phoenix-Mesa
Gateway Airport, continued route changes by American Airlines will reduce direct service by 30 thousand seats throughout
the year. Throughout the forecast period, Arizona is expected to benefit from an average market share of 27 per cent of
Canadian visits to the Mountain region. This is expected to result in an average annual rate of growth of 3.8 per cent.
Figure 17. Visits by Canadians to Arizona each year (000s)
896 885 864
850 843
769 765 800
704 728 744
2011 2012 2013 2014 2015 2016p 2017f 2018f 2019f 2020f 2021f
Source: Arizona Office of Tourism, Statistics Canada, CBoC estimates.
Phoenix
About six-in-ten Canadian visits to Arizona are to Phoenix, and most of those trips are by air. After a significant decline in
capacity in 2016, both American Airline and WestJet are further reducing service to PHX throughout 2017. In contrast, Air
Canada plans to add a significant number of direct seats during the summer months and WestJet has introduced new
service to Phoenix-Mesa airport that will add more than 12 thousand seasonal seats from Edmonton and Calgary in 2017.
These changes in capacity to the area will result in -5.6 per cent fewer available seats, bringing the annual passenger total
to 423 thousand.
Figure 18. Phoenix (PHX & AZA) Capacity and Direct Arrivals, Annual
Seats Passengers
617,676
593,840
570,184
560,927
533,425
507,454
503,414
500,472
494,150
465,627
461,106
438,302
426,693
423,132
2011 2012 2013 2014 2015 2016p 2017f
Source: OAG, US BTS, CBoC estimates. Includes PHX and AZA (as of 2017).
©Conference Board of Canada 12Nevada
While the CAD-USD exchange rate isn’t as much of an acute shock for travellers now that the dollar’s decline has slowed,
travel prices are increasing faster than disposable income. With Las Vegas as the main destination in Nevada for Canadian
leisure travel, prices are a key factor impacting visitation. The average daily rate at accommodations in Las Vegas increased
from $108 CAD in 2012 to $167 CAD in 2016. In addition, a reduction in the share of Canadians aged 25-49 will dampen
performance in the medium- to long-term as almost half of visitors to the state during the past three years fall into this age
group. With the state is poised to receive close to half of all Canadian visits to the Mountain region throughout the forecast
period, its performance is expected to resemble that of the region. Throughout the forecast period, the average annual
rate of growth is estimated at 3.4 per cent.
Figure 19. Visits by Canadians to Nevada each year (000s)
1,587 1,662
1,557
1,481 1,476 1,509
1,422 1,385
1,343 1,321 1,346
2011 2012 2013 2014 2015 2016p 2017f 2018f 2019f 2020f 2021f
Source: Statistics Canada, CBoC estimates.
Las Vegas
Following a -3.0 per cent reduction in direct seat capacity, Las Vegas welcomed 884 thousand Canadian deplanements in
2016, down from 912 thousand the year prior. Direct air passengers arriving in Las Vegas represent two-thirds total
overnight visits to Nevada each year. While Sunwing has cancelled air-only service, WestJet recently cancelled three routes
(YOW, YUL, YXX) and reduced service on four others (YEG, YXE, YQR, YYJ). Air Canada now accounts for 48.0 per cent of
direct capacity. With only Air Canada and WestJet providing direct service in 2017, overall capacity is expected to drop to
1.03 million seats resulting in 874 thousand direct arrivals.
Figure 20. Las Vegas Capacity and Direct Arrivals, Annual
Seats Passengers
1,097,747
1,075,516
1,064,931
1,029,632
912,529
903,690
894,649
884,602
874,884
874,079
866,939
789,913
789,081
776,197
2011 2012 2013 2014 2015 2016p 2017f
Source: OAG, US BTS, McCarran International Airport, CBoC estimates.
©Conference Board of Canada 13California
Even though California welcomed an estimated 1.5 million Canadian visitors in 2016, this represents the second annual
decline in as many years. Looking forward, the State is expected to benefit from increases in direct air capacity as well as
strong demand from the key markets of British Columbia and Ontario. California is also expected to benefit from strong
demand from younger travellers as well as significant increases in connecting traffic destined for Asia-Pacific destinations.
Throughout the forecast period, visitation is expected to stay fairly stable growing at an average annual rate of 2.5 per cent
between 2017-2021.
Figure 21. Visits by Canadians to California each year (000s)
1,708 1,746
1,625 1,622 1,664
1,543 1,567 1,579 1,541 1,580
1,476
2011 2012 2013 2014 2015 2016p 2017f 2018f 2019f 2020f 2021f
Source: Statistics Canada, CBoC estimates.
Los Angeles
An estimated 708 thousand Canadians visited LA in 2016; the same volume as seen in 2013 before the loonie started its
steep decline. Direct air service is scheduled to grow 10.4 per cent this year, which is estimated to result in 1.2 million
direct arrivals in 2017. Of these passengers, 711 thousand are expected to stay in the L.A. area. Overall visits (air and land)
to L.A. are expected to account for around 46 per cent of total Canadian visits to California, resulting in an average annual
rate of growth of 3.4 per cent between 2017 and 2021.
Figure 22. Los Angeles Capacity and Direct Arrivals, Annual
Seats Passengers
1,443,792
1,311,122
1,280,700
1,241,345
1,220,977
1,106,077
1,104,836
1,067,130
1,038,986
1,024,537
911,432
860,836
2012 2013 2014 2015 2016p 2017f
Source: OAG, US BTS, Los Angeles International Airport, CBoC estimates.
©Conference Board of Canada 14Hawaii
Benefitting from a strong outbound travel market in western Canada and new direct capacity from Toronto, Canadian
arrivals in Hawaii more than doubled between 2005 and 2015. Then, the market fell -6.5 per cent in 2016 as the value of
the loonie dropped to an annual average of $0.76 USD. During the year, direct arrivals grew 3.0 per cent to surpass 359
thousand, while indirect arrivals from U.S. ports declined -26.9 per cent. This was the third consecutive year of decreases in
indirect volume, pushing the overall share of visitors arriving from a Canadian airport up to 75 per cent. This share was 61
per cent in 2014 when the dollar averaged $0.91 USD.
Historically, lower taxes and fees resulted in a larger volume of Canadians flying to Hawaii via the U.S., but new direct
capacity is reversing this trend. Compared to 2015, WestJet offered additional capacity from Calgary and Edmonton
throughout the year, while Air Canada offered a slightly higher volume of direct seats from Toronto and Vancouver. These
changes resulted in a 1.6 per cent increase in direct capacity during the year. In contrast, Alaska Airlines’ seasonal service
from Bellingham offered -19.0 per cent fewer seats to Honolulu and Kahului in 2016. Looking forward, carriers are
currently reporting a decline of nine thousand direct seats in 2017, which along with higher costs for indirect travel is
expected to result in another year of stagnant growth.
Figure 22. Direct (International) and Indirect (Domestic) Passengers
250,000 400,000
Via U.S. Direct from Canada
350,000
200,000
300,000
250,000
150,000
200,000
100,000
150,000
100,000
50,000
50,000
0 0
1999 2000 2001 2002 2003 2004 2005 2006 2007 2008 2009 2010 2011 2012 2013 2014 2015 2016 2017
Source: Hawaii Tourism Authority, US BTS, OAG
Proximity will continue to attract travellers from BC to Hawaii and increased access will help the Ontario market grow.
These two provinces will see some of the largest increases in the baby boomer population, which is good news for the
destination. A high volume of repeat travellers is also beneficial to overall visitation. Two-thirds of Canadians who visited
Hawaii in 2016 were repeat visitors. A decrease in capacity in 2017 is expected to produce higher load factors, but the
decrease in seats is forecast to result in an estimated 472 thousand arrivals throughout the year. After that, Hawaii should
regain its share of Pacific region travellers, and grow at an average annual rate of 2.8 per cent over the forecast period.
©Conference Board of Canada 15You can also read