2018 Summer Reliability Assessment - NERC
←
→
Page content transcription
If your browser does not render page correctly, please read the page content below
2018 Summer Reliability Assessment
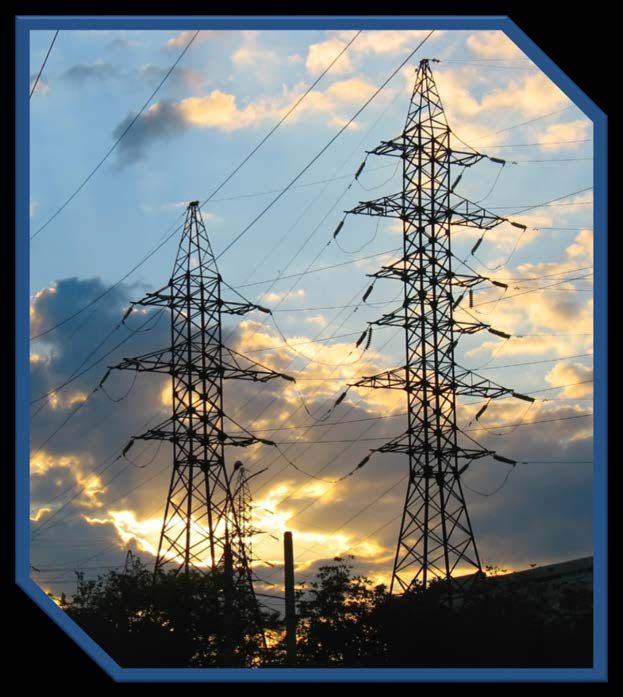
Table of Contents
Preface ............................................................................................................ 3   MRO-SaskPower......................................................................... 18
About this Report ............................................................................................ 5         NPCC-Maritimes ......................................................................... 19
Key Findings .................................................................................................... 6      NPCC-New England .................................................................... 20
Resource Adequacy......................................................................................... 6             NPCC-New York .......................................................................... 21
Operational Challenges Impacting ERCOT ...................................................... 9                          NPCC-Ontario ............................................................................. 22
Assessing At-Risk Capacity .............................................................................. 9              NPCC-Québec ............................................................................. 23
Operational Challenges Impacting MISO ...................................................... 11                          PJM ............................................................................................. 24
Operational Challenges Impacting CAISO ..................................................... 13                          SERC ........................................................................................... 25
Impacts of the Aliso Canyon Natural Gas Storage Operating Restrictions ... 14                                            SPP.............................................................................................. 26
Inverter-Based Resource Performance ......................................................... 14                         Texas RE-ERCOT ......................................................................... 27
FRCC .............................................................................................................. 15   WECC .......................................................................................... 28
MISO.............................................................................................................. 16    Data Concepts and Assumptions ............................................... 29
MRO-Manitoba Hydro................................................................................... 17
2018 Summer Reliability Assessment                                          33

Preface
The vision for the Electric Reliability Organization (ERO) Enterprise, which is comprised of NERC and the eight Regional Entities (REs), is a highly reliable and secure
North American bulk power system (BPS). Our mission is to assure the effective and efficient reduction of risks to the reliability and security of the grid.

The North American BPS is divided into eight RE boundaries as shown in the map and corresponding table on page four. The highlighted areas denote overlap as
some load-serving entities participate in one Region while associated Transmission Owners/Operators participate in another. The assessment areas are shown on
page 4.

                                                                             NERC Regions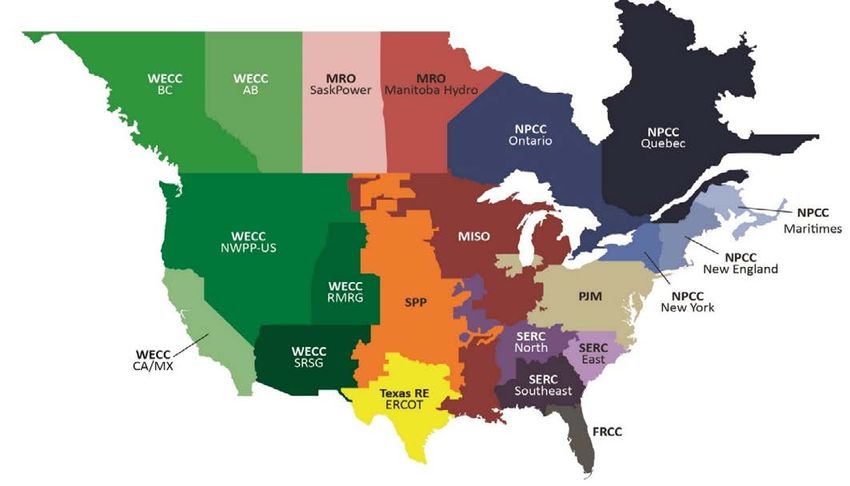
2018 Summer Reliability Assessment                        44

                                                             NERC Assessment Areas

FRCC—Florida Reliability Coordinating Council   Texas-RE - Texas Reliability Entity             WECC—Western Electricity Coordinating Council
 FRCC                                            ERCOT                                           WECC-CA/MX
                                                                                                 WECC-NWPP-AB
MRO—Midwest Reliability Organization            NPCC—Northeast Power Coordinating Council        WECC-NWPP-BC
 MRO-SaskPower                                   NPCC-Maritimes                                  WECC-NWPP-US
 MRO-Manitoba Hydro                              NPCC-New England                                WECC-RMRG
 MISO                                            NPCC-New York                                   WECC-SRSG
                                                 NPCC-Ontario
SPP RE—Southwest Power Pool Regional Entity      NPCC-Québec                                    SERC—SERC Reliability Corporation
 SPP                                                                                            SERC-East
                                                RF—ReliabilityFirst                             SERC-North
                                                 PJM                                            SERC-Southeast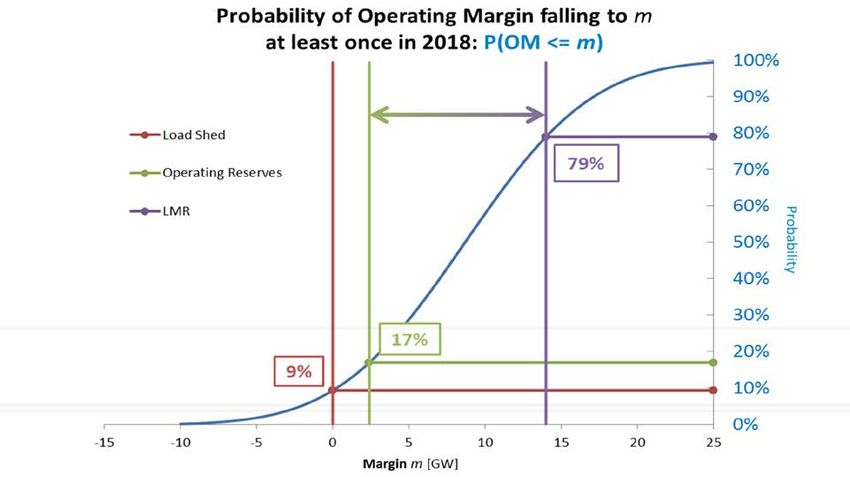
2018 Summer Reliability Assessment 5

About this Report
NERC’s 2018 Summer Reliability Assessment identifies, assesses, and reports on areas of concern regarding the reliability of the North American bulk power system
(BPS) for the upcoming summer season. In addition, this assessment presents peak electricity demand and supply changes and highlights any unique regional
challenges or expected conditions that might impact the BPS. The reliability assessment process is a coordinated reliability evaluation between the Reliability
Assessment Subcommittee (RAS), the Regions, and NERC staff. This report reflects NERC’s independent assessment and is intended to inform industry leaders,
planners, operators, and regulatory bodies so that they may be better prepared to take necessary actions to ensure BPS reliability. The report also provides an
opportunity for the industry to discuss their plans and preparations to ensure reliability for the upcoming summer period.
2018 Summer Reliability Assessment 6
Key Findings
NERC’s annual Summer Reliability Assessment covers the four-month (June–September) 2018 summer period. This assessment provides an evaluation of whether
or not there is adequate generation and transmission necessary to meet projected summer peak demands. The assessment monitors and identifies potential
reliability issues of interest and regional areas of concern that pertain to meeting projected customer demands. The following key findings represent NERC’s
independent evaluation of electric generation capacity and potential operational concerns that may need to be addressed:
• The majority of assessment areas maintain sufficient resources to meet and exceed their Planning Reference Margin Levels for this summer. However,
certain areas face additional operating challenges from either a resource shortfall or a diminishing resource surplus. Texas RE-ERCOT projects an
Anticipated Reserve Margin of 10.9 percent. This Reserve Margin equates to a capacity shortfall of 2,000 MW based on the Reference Margin Level of
13.75 percent.
Texas RE-ERCOT's own assessment indicates that given this shortfall, the deployment of ancillary services and contracted load control programs may
be required during peak demand periods.
Typical generator outages expected under normal conditions could limit Texas RE-ERCOT’s ability to maintain operating reserves.
When extreme condition scenarios are reviewed, operational challenges occur during times of peak demand low wind output, and generator outages.
Reserve Margins can be very volatile, as evidenced by the 2017 LTRA Reference Case Reserve Margin of 18.22 percent for Texas RE-ERCOT declining
to 11.76 percent in updated analysis just prior to publishing the 2017 LTRA late in 2018.
• Although MISO projects adequate reserves, more frequent reliance on behind-the-meter-generation (BTMG) and demand response will occur to meet
reliability requirements. To access these resources, MISO operators will have to take actions to initiate emergency operating procedures more often than
in the past. These actions are anticipated to provide sufficient energy or load relief to cover the normal forecasted system conditions.
• CAISO faces significant risk of encountering operating conditions that could result in operating reserve shortfalls. The increased risk is primarily a result of
lower hydro conditions and the retirement of 789 MW of dispatchable natural gas generation that had been available in prior summers to meet high load
conditions. The risk associated with the natural gas storage facility restrictions at the Aliso Canyon and other natural gas storage facilities to electric reliability
is greater in the local reliability areas of Southern California than to the rest of the CAISO system. Operational constraints limit Aliso Canyon output, increasing
ramping requirements in California. Any disruption in the Southern California gas system will be aggravated by the constraints at Aliso Canyon; in such a case,
gas deliveries to power generation would be at risk.
• ISO-NE is adopting a new Pay-for-Performance market design. Scheduled for implementation on June 1, 2018, this new market design is intended to provide
financial incentives for capacity resources to perform during scarcity conditions and thus enhance system reliability. Both internal and external market
monitors continue to assess the development, operation, performance, and state of competition in the wholesale electricity markets operated by the ISO.
• The ERO continues to raise awareness on inverter-based resource performance through NERC alerts1 and industry outreach. WECC staff reported significant
efforts on the potential loss of solar generation associated with inverter controls.
• Despite substantial progress made in addressing and coordinating the interdependencies between natural gas and electric infrastructure, the growing reliance
on natural gas continues to raise BPS reliability concerns. As underscored in NERC’s recent special assessment report, Potential Bulk Power System Impacts
Due to Severe Disruptions on the Natural Gas System, 2 planning approaches, operational procedures, and regulatory partnerships are needed to assure fuel
deliverability, availability, security (physical and cyber), and resilience from potential disruptions.
1 NERC Inverter Alert Announcement, May 2, 2018
2 NERC Special Assessment, November, 2017
2018 Summer Reliability Assessment                       7

Resource Adequacy
NERC uses the Anticipated Reserve Margin to evaluate resource adequacy by comparing the projected capability of Anticipated Resources to serve forecasted
peak load. 3 Large year-to-year changes in Anticipated Resources or forecasted peak load can greatly impact Planning Reserve Margin calculations. As shown in the
figure below, most assessment areas have sufficient Anticipated Reserve Margins to meet or exceed their planning Reference Margin Level for the 2018 summer
period except for Texas RE-ERCOT.

                                                  99%                               57%

      50%
      45%
      40%
      35%
      30%
      25%
      20%
      15%
      10%
       5%
       0%

                                 Anticipated Reserve Margin (%)                Prospective Reserve Margin (%)                  Reference Margin Level (%)

                                  Summer 2018 Anticipated/Prospective Reserve Margins Compared to Reference Margin Level

3
    Refer to the Data Concepts and Assumptions section for additional information on Anticipated Reserve Margins, Anticipated Resources, and Reference Margin Levels.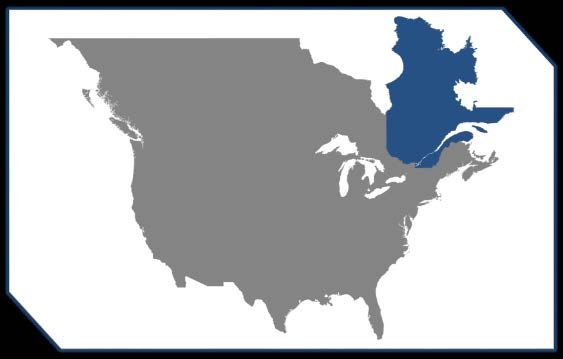
2018 Summer Reliability Assessment                                 8
Understanding the changes from year-to-year is an essential step in assessing an area on a seasonal basis. This understanding can be used to further examine
potential operational issues that emerge between reporting years. The figure below provides the relative change from the 2017 summer period to the 2018
summer period.

         50%
         45%
         40%
         35%
         30%
         25%
         20%
         15%
         10%
          5%
          0%

                  2017 Anticipated Reserve Margin %      2018 Anticipated Reserve Margin %        2017 Reference Margin Level      2018 Reference Margin Level

                                 Summer 2017 to Summer 2018 Anticipated Reserve Margins Year-to-Year Change
                                               Note: Areas with reserve margins greater than 50 percent are shown as 50 percent.
2018 Summer Reliability Assessment                                         9
Operational Challenges Impacting ERCOT
Based on ERCOT’s preliminary summer Seasonal Assessment of Resource Adequacy report, 4 released March 1, 2018, ERCOT expects to rely on a variety of
operational tools to help manage tight reserves and maintain system reliability. The ERCOT report focuses on the availability of sufficient operating reserves to
avoid emergency actions. It uses an operating reserve threshold of 2,300 MW to indicate the risk that an energy emergency alert Level 1 may be triggered during
the time of the forecasted seasonal peak load. This threshold level is roughly analogous to the 2,300 MW physical responsive capability threshold for energy
emergency alert Level 1. Physical responsive capability is a real-time capability measure used by ERCOT to indicate the amount of capacity that can quickly respond
to system disturbances. One caveat associated with this report is that it does not account for additional capacity and voluntary load reductions that may be realized
as the market responds to wholesale market price increases and anticipated capacity scarcity conditions.

ERCOT has a variety of operational tools to help manage tight reserves and maintain system reliability. For example, control room operators can release ancillary
services (including load resources that can provide various types of operating reserves depending on meeting certain qualification criteria), deploy contracted
emergency response service resources, instruct investor-owned utilities to call on their load management and distribution voltage reduction programs, request
emergency power across the dc ties, and request support from available switchable generators currently serving non-ERCOT grids.

Assessing At-Risk Capacity
The Anticipated Reserve Margin for ERCOT falls to 10.9 percent for the 2018 summer period, below their Reference Margin Level of 13.75 percent. This projected
shortfall in Planning Reserve Margins is primarily due to approximately 2,100 MW of delayed new resources and approximately 5,000 MW of plant retirements
that were expected to be available to serve load for this summer. These resources were included in the Reference Case in the NERC 2017 Long-Term Reliability
Assessment, 5 which projected an Anticipated Reserve Margin of 18.2 percent for the 2018 summer period. An updated analysis included in the LTRA assessment
showed that after accounting for the retirements and delays projected an Anticipated Reserve Margin of 11.76 percent for the summer of 2018. The NERC 2017
Summer Reliability Assessment 6 projected an Anticipated Reserve Margin of 15.0 percent. This volatility in the projected availability of capacity resources in the
ERCOT market is shown in the figure on the following page, which shows the cumulative changes in the Reserve Margin of 18.9 percent reported in ERCOT's May
2017 annual resource adequacy assessment (called the Capacity, Demand, and Reserves 7 report) to the NERC 2018 Summer Reliability Assessment projection of
10.9 percent.

An operational risk analysis (as introduced in NERC’s 2015 Summer Reliability Assessment) 8 is shown in the figure after the reserve margin changes from May,
2017. The Operational Risk Assessment portion of the figure represents a deterministic analysis that shows what happens when applying typical maintenance
outages and forced outages for thermal units, extreme weather forecast load level and forced outages, and low wind. While the cumulative impact of all of these
extreme event scenarios occurring are shown, it does not have a high likelihood of occurring. However, it does show the relative impact of each scenario in terms
of potential capacity loss with each one being large enough for a risk of at least emergency alert Level 1 events occurring. If forecasted summer conditions
materialize, ERCOT may need to rely on emergency operating procedures and import capabilities from neighboring areas.

4
 For details, see the ERCOT Seasonal Assessment of Resource (SARA) report, March 1, 2018
5
  NERC 2017 Long-Term Reliability Assessment, December 2017
6
  NERC 2017 Summer Reliability Assessment, May, 2017
7
  Report on the Capacity, Demand and Reserves (CDR) in the ERCOT Region, May 2, 2017
8
  NERC 2015 Summer Reliability Assessment, May, 2015
2018 Summer Reliability Assessment                      10

              Contributing Factors to ERCOT’s Reserve Margin Changes Since May 2017 and Operational Risk for Summer 2018

The above figure shows the most significant changes since the 2017 ERCOT CDR, including the following:
   •   A load forecast decrease of 1,175 MW in the summer 2018 peak load that increases the reserve margin approximately two percent
   •   Retirement of 4,273 MW of coal capacity in January and February 2018 (Big Brown, Monticello, and Sandow plants, owned by Vistra Energy)
   •   Retirement of 806 MW of natural-gas-fired capacity in late 2017 (Greens Bayou Unit 5 and S.R. Bertron Units 2-4)
   •   Delayed Tier 1 resources totaling about 2,100 MW and extended outages and mothballs of approximately 1,000 MW
2018 Summer Reliability Assessment 11
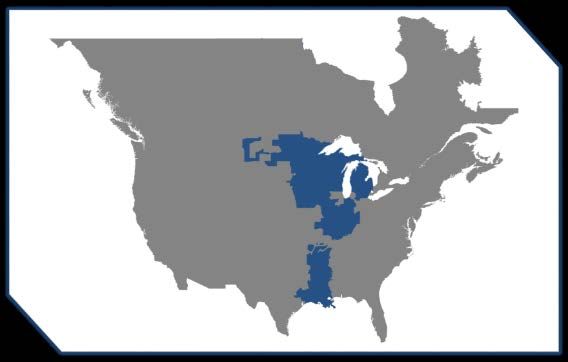
Operational Challenges Impacting MISO
Although adequate reserves are projected by MISO, in order to meet reliability requirements, it is projected that more frequent reliance on BTMG and demand
response will occur, as their surplus capacity (approximately two percent) diminishes. To access these resources, MISO operators will have to take actions to
initiate emergency operating procedures more often than in the past, as these resources are a substantial amount of their reserves. These actions are anticipated
to provide sufficient energy or load relief to cover the normal forecasted system conditions. For a high demand, high outage scenario, MISO is expecting to rely
heavily on demand response. The access to demand response resources is outlined in the sequence of actions in MISO’s Maximum Generation Emergency
Procedures shown in the figure below: 9
9
As presented in the MISO 2018 Summer Readiness Workshop, April 24,20182018 Summer Reliability Assessment 12
While progression through these steps indicates increasing risk, the first two steps are taken to access relied upon resources. This sequence corresponds to NERC
energy emergency alerts Level 1, 2, and 3. The figure below 10 represents the probability of a decrease in Operating Margin levels for the summer 2018 period in
MISO. As shown, there is a 79 percent chance of the operating margin falling to a level that would result in a NERC energy emergence alert Level 2 being issued.
Also shown is that there is a nine percent chance of load shed occurring.
Probability of Operating Margin Levels
10
As presented in the MISO 2018 Summer Readiness Workshop, April 24,20182018 Summer Reliability Assessment 13
Operational Challenges Impacting CAISO
As reported in the CAISO 2018 Summer Loads and Resources Assessment, 11 “the CAISO faces significant risk of encountering operating conditions that could result
in operating reserve shortfalls. The increased risk in 2018 over 2017 is primarily a result of lower hydro conditions and the retirement of 789 MW of
dispatchable natural gas generation that had been available in prior summers to meet high load conditions that persist after the solar generation ramps down
in the late afternoon. The risk increases during late summer when hydro availability decreases as the snow runoff progressively declines through the runoff
season and solar production declines in the late afternoon hours due to shorter days. CAISO is at greatest operational risk if seasonal peak hot weather conditions
occur in late August and early September.” The CAISO report does not consider the limitations at the Aliso Canyon Natural Gas Storage Facility. Natural gas
limitations and pipeline outages could exacerbate these conditions. An update on Aliso Canyon is provided in the next section below.
In the CAISO report, 2,000 scenarios were constructed using historic temperatures, demand, and current power plant availability. This assessment found a 50
percent chance that CAISO will need to declare a Stage 2 Emergency for at least one hour this summer. Should CAISO system operating conditions go into the
emergency stages, such as operating reserve shortfalls where non-spinning reserve requirement cannot be maintained or spinning reserve is depleted and operating
reserve falls below minimum requirement, CAISO will implement a mitigation operating plan to minimize loss of load in the CAISO BA. This plan is made up of the
following:
• Use the Flex Alert program, signaling that CAISO expects a high peak load condition. This program has been proven to reduce peak load in the CAISO
BA area.
• Use CAISO’s Restricted Maintenance program. This program is intended to reduce potential forced outages, thus minimizing forced outage rate during a
high peak load condition.
• Perform manual post-day ahead unit commitment and exceptional dispatch of resources under contract to ensure the ability to serve load and meet flexible
ramping capability requirements.
• Perform manual exceptional dispatch of intertie resources that have resource adequacy obligation to serve CAISO load.
• Use the Alert/Warning/Emergency (AWE) program.
• Use the Demand Response program, including the reliability demand response resources (RDRR) under the “Warning” stage.
• Perform manual exceptional dispatch of physically available resources that have not received an RA contract for the month.
11
CAISO 2018 Summer Loads and Resources Assessment2018 Summer Reliability Assessment 14 Impacts of the Aliso Canyon Natural Gas Storage Operating Restrictions The outlook for energy reliability in Southern California and in the Desert Southwest remains challenging due to uncertainty about the status of its natural gas system. The challenges to the natural gas system are greater than for the previous two summers and create the potential for natural gas providers to either curtail natural gas to the electric generators in Southern California or use natural gas from the Aliso Canyon underground natural gas storage facility. The challenges stem primarily from continuing outages on as many as four key natural gas pipelines and the operational constraints limiting the use of the Aliso Canyon natural gas storage facility. While the ability for the CAISO electric system in Southern California to maintain electric reliability poses a potential challenge with the loss of key storage capacity and natural gas pipeline facilities, when combined with the increasingly high use of the interstate pipelines, inherent flexibility may be reduced in the natural gas infrastructure serving the Desert Southwest and Southern California. Additionally, the availability of alternative resources may be less this summer due to below average hydroelectric conditions. Inverter-Based Resource Performance Recent grid disturbances in the Western Interconnection that involve the reduction in output of solar photovoltaic (PV) resources has put a spotlight on the performance of inverter-based resources connected to the BPS. On August 16, 2016, the Blue Cut Fire resulted in a solar PV reduction of around 1,200 MW. NERC and the Western Electricity Coordinating Council (WECC) launched a task force to identify the primary causes of the disturbance, which led to the publication of the Blue Cut Fire Disturbance Report. 12 The report identified potential risks to the reliability of the BPS, including erroneous frequency-based tripping in some inverters and the use of momentary cessation by inverters nearly across the fleet. Once these issues were identified through event analysis, NERC began outreach with industry and vendors to educate them on potential risks and mitigation strategies. NERC posted a Level 2 Alert, 13 which required a response from recipients and recommended specific actions to be taken by registered entities to address and mitigate these adverse characteristics observed in BPS-connected solar PV resources. On October 9, 2017, the Canyon 2 Fire resulted in another grid disturbance in the West, and NERC and the NERC Inverter-Based Resource Performance Task Force began identifying the causes of this disturbance. NERC published the Canyon 2 Fire Disturbance Report. 14 The report identified additional risks of solar PV tripping and continued use of momentary cessation, which pose a potential reliability risk to the BPS. NERC recently posted another Level 2 Alert 15 requiring a response for further data collection and recommending mitigating actions to address voltage-related tripping, improvements in dynamic modeling, and mitigation of momentary cessation. These recommendations are intended to apply to all solar PV resources connected to the BPS. 12.BlueCut Fire Disturbance Report 13 Industry Recommendation: Loss of Solar Resources during Transmission Disturbances due to Inverter Settings 14 Canyon 2 Fire Disturbance Report 15 Industry Recommendation: Loss of Solar Resources during Transmission Disturbances due to Inverter Settings - II
2018 Summer Reliability Assessment                                          15
                                                                                                                                                                    15

                                                                                                    On-Peak Expected Capacity: Generation Mix
                                                     Existing On-Peak Generation
                                                                                                     7% 5% 1% 12%
                                                    Generation Type       Percent                                                     Biomass
                                                    Biomass                 1%                                                        Coal
                                                    Coal                    12%
                                                                                                                                      Natural Gas
                                                    Hydro
2018 Summer Reliability Assessment 16
16
Existing On-Peak Generation On-Peak Expected Capacity: Generation Mix
Generation Type Percent
2% 2% 1%
Biomass2018 Summer Reliability Assessment 17
17
Existing On-Peak Generation On-Peak Expected Capacity: Generation Mix
Generation Type Percent 5% 2%
Coal 2% Coal
Hydro 93%
Natural Gas Hydro
5%
Wind2018 Summer Reliability Assessment 18
18
Existing On-Peak Generation On-Peak Expected Capacity: Generation Mix
Generation Type Percent
40%
Biomass2018 Summer Reliability Assessment 19
19
On-Peak Expected Capacity: Generation Mix
2% 3% Biomass
Existing On-Peak Generation
Generation Type Percent 27% Coal
Biomass 25%
3% Hydro
Coal 25% Natural Gas
Hydro 20%
Nuclear
Natural Gas 13% 10%
Nuclear Petroleum
10%
NPCC-Maritimes Petroleum 27% 13% 20% Wind
The Maritimes Assessment Area is a Wind 2%
winter-peaking NPCC subregion that
contains two Balancing Authorities. It is
comprised of the Canadian provinces of NPCC - Maritimes Resource Adequacy Data
New Brunswick, Nova Scotia, and Prince Demand, Resource, and Reserve Margins 2017 SRA 2018 SRA 2017 vs. 2018 SRA
Edward Island, and the northern Demand Projections Megawatts Megawatts Net Change
portion of Maine, which is radially Total Internal Demand (50/50) 3,320 3,235 -2.6%
connected to the New Brunswick power Demand Response: Available 369 300 -18.7%
Net Internal Demand 2,951 2,935 -0.5%
system. The area covers 58,000 square
Resource Projections Megawatts Megawatts Net Change
miles with a total population of 1.9
Existing-Certain Capacity 5,636 5,828 3.4%
million people.
Tier 1 Planned Capacity 0 0 -
Net Firm Capacity Transfers 0 0 -
Anticipated Resources 5,636 5,828 3.4%
Existing-Other Capacity 0 0 -
Prospective Resources 5,636 5,828 3.4%
Reserve Margins Percent Percent Annual Difference
Anticipated Reserve Margin 91.0% 98.6% 7.6%
Prospective Reserve Margin 91.0% 98.6% 7.6%
Reference Margin Level 20.0% 20.0% 0.0%
Highlights
• During the NERC 2018 summer assessment period, the Maritimes area has not identified any issues that
are expected to impact system reliability.
• If conditions were to change due to unplanned transmission or generator outages, operating adjustments
would be addressed by Operations Engineering through established procedures.2018 Summer Reliability Assessment 20
20
Existing On-Peak Generation On-Peak Expected Capacity: Generation Mix
Generation Type Percent 6% 3% 3%
4%
Biomass 3% Biomass
Coal 3% 20% Coal
Hydro 4% Hydro
Natural Gas 51% Natural Gas
Nuclear 13% Nuclear
Petroleum 20% Petroleum
Pumped Storage 6% 13% Pumped Storage
Solar2018 Summer Reliability Assessment 21
21
Existing On-Peak Generation On-Peak Expected Capacity: Generation Mix
Generation Type Percent 4% 4% 3% 11%
Biomass2018 Summer Reliability Assessment 22
22
Existing On-Peak Generation
On-Peak Expected Capacity: Generation Mix
Generation Type Percent 2%
8% 2%
Biomass 2% 23%
Hydro 23% Biomass
Natural Gas 24% Hydro
Natural Gas
Nuclear 41%
Nuclear
Petroleum 8% Petroleum
41%
Solar2018 Summer Reliability Assessment 23
23
Existing On-Peak Generation On-Peak Expected Capacity: Generation Mix
1% 1%
Generation Type Percent
Biomass 1% Biomass
Hydro 98% Hydro
Wind 1% Wind
98%
NPCC-Québec
The Québec Assessment Area (Province
of Québec) is a winter-peaking NPCC NPCC - Québec Resource Adequacy Data
subregion that covers 595,391 square Demand, Resource, and Reserve Margins 2017 SRA 2018 SRA 2017 vs. 2018 SRA
miles with a population of 8 million. Demand Projections Megawatts Megawatts Net Change
Total Internal Demand (50/50) 20,506 20,534 0.1%
Québec is one of the four NERC
Demand Response: Available 0 0 -
Interconnections in North America, with
Net Internal Demand 20,506 20,534 0.1%
ties to Ontario, New York, New England,
Resource Projections Megawatts Megawatts Net Change
and the Maritimes, consisting of either
Existing-Certain Capacity 34,478 34,014 -1.3%
HVDC ties, radial generation, or load to
Tier 1 Planned Capacity 5 0 -100.0%
and from neighboring systems.
Net Firm Capacity Transfers -1,855 -1,829 -1.4%
Anticipated Resources 32,628 32,185 -1.4%
Existing-Other Capacity 0 0 -
Prospective Resources 32,628 32,185 -1.4%
Reserve Margins Percent Percent Annual Difference
Anticipated Reserve Margin 59.1% 56.7% -2.4%
Prospective Reserve Margin 59.1% 56.7% -2.4%
Reference Margin Level 12.0% 12.6% 0.6%
Highlights
• No particular resource adequacy problems are forecasted since the system is winter peaking.
• Québec area expects to be able to provide assistance to other areas if needed, up to the transfer capability
available.
• The Reference Margin Level is set to 12.6 percent for the 2018 summer operating period for the Québec area.
• Maintenance and construction schedules will be coordinated to not impact inter-area transfer capabilities with
neighboring systems.2018 Summer Reliability Assessment 24
24
Existing On-Peak Generation
Generation Type Percent On-Peak Expected Capacity: Generation Mix
Biomass2018 Summer Reliability Assessment 25
25
Existing On-Peak Generation
Generation Type Percent On-Peak Expected Capacity: Generation Mix
Biomass2018 Summer Reliability Assessment 26
26
Existing On-Peak Generation
Generation Type Percent On-Peak Expected Capacity: Generation Mix
Biomass2018 Summer Reliability Assessment 27
27
Existing On-Peak Generation
On-Peak Expected Capacity: Generation Mix
Generation Type Percent
Biomass2018 Summer Reliability Assessment 28
28
Existing On-Peak Generation
On-Peak Expected Capacity: Generation Mix
Generation Type Percent
2% 2% 1%
Biomass 1% 2%2%
4% 17%
Coal 17% Biomass
Geothermal 1% Coal
1% Geothermal
Hydro 22%
Hydro
Natural Gas 47% Natural Gas
Nuclear 4% Nuclear
Other 2%
WECC Petroleum2018 Summer Reliability Assessment 29
29
Data Concepts and Assumptions
The table below explains data concepts and important assumptions used throughout this assessment.
General Assumptions
• Reliability of the interconnected BPS is comprised of both adequacy and operating reliability.
Adequacy is the ability of the electric system to supply the aggregate electric power and energy requirements of the electricity consumers at all times while
taking into account scheduled and reasonably expected unscheduled outages of system components.
Operating reliability is the ability of the electric system to withstand sudden disturbances such as electric short-circuits or unanticipated loss of system
components.
• The reserve margin calculation is an important industry planning metric used to examine future resource adequacy.
• All data in this assessment is based on existing federal, state, and provincial laws and regulations.
• Differences in data collection periods for each assessment area should be considered when comparing demand and capacity data between year-to-year seasonal
assessments.
• 2017 Long-Term Reliability Assessment data has been used for most of this 2018 assessment period, augmented by updated load and capacity data.
• A positive net transfer capability would indicate a net importing assessment area; a negative value would indicate a net exporter.
Demand Assumptions
• Electricity demand projections, or load forecasts, are provided by each assessment area.
• Load forecasts include peak hourly load, or total internal demand, for the summer and winter of each year.
• Total internal demand projections are based on normal weather (50/50 distribution) and are provided on a coincident basis for most assessment areas.
• Net internal demand is used in all reserve margin calculations, and it is equal to total internal demand then reduced by the amount of controllable and dispatchable
demand response projected to be available during the peak hour.
Resource Assumptions
• Resource planning methods vary throughout the North American BPS. NERC uses the following categories to provide a consistent approach for collecting and
presenting resource adequacy:
Anticipated Resources:
• Existing-Certain Capacity: included in this category are commercially operable generating units, or portions of generating units, that meet at least one of the following
requirements when examining the period of peak demand for the summer season: unit must have a firm capability and have a power purchase agreement (PPA) with
firm transmission that must be in effect for the unit; unit must be classified as a designated network resource; and/or where energy-only markets exist, unit must be a
designated market resource eligible to bid into the market.
• Tier 1 Capacity Additions: includes capacity that either is under construction or has received approved planning requirements.
• Net Firm Capacity Transfers (Imports minus Exports): transfers with firm contracts.2018 Summer Reliability Assessment 30
30
Prospective Resources: Includes all Anticipated Resources, plus the following:
Existing-Other Capacity: included in this category are commercially operable generating units, or portions of generating units, that are expected to be available to
serve load for the period of peak demand for the summer or summer season but do not meet the requirements of existing-certain.
Reserve Margin Definitions
Reserve Margins: the primary metric used to measure resource adequacy; it is defined as the difference in resources (anticipated or prospective) and net internal demand then
divided by net internal demand, shown as a percentile:
(Anticipated Resources – Net Internal Demand)
Anticipated Reserve Margin = Net Internal Demand
(Prospective Resources – Net Internal Demand)
Prospective Reserve Margin =
Net Internal Demand
Reference Margin Level: The assumptions of this metric vary by assessment area. The reference margin level is typically based on load, generation, and transmission
characteristics for each assessment area, and in some cases, the reference margin level is a requirement implemented by the respective state(s), provincial authorities, ISO/RTO,
or other regulatory bodies. If such a requirement exists, the respective assessment area generally adopts this requirement as the reference margin level. In some cases, the
reference margin level will fluctuate over the duration of the assessment period, or it may be different for the summer and summer seasons. If one is not provided by a given
assessment area, NERC applies a 15 percent reference margin level for predominately thermal systems and 10 percent for predominately hydro systems.
On-Peak Expected Capacity Generation Mix: generation mix is aggregated from 2017 Long-Term Reliability Assessment data. Fuel types with nominal quantities were aggregated
together as fuel types, renewables, other renewables, or other fuels.
Renewable Nameplate Capacities: these charts include renewable on peak and nameplate (de-rated and expected on peak added together) capacities.
Errata
July 1, 2018
Page 6: Added clarification on reserve margin key findings for Texas RE-ERCOT and natural gas deliveries in Southern California
Page 9: Added additional information on the Texas RE-ERCOT reserve margin changes from May 2017 to Summer 2018
Page 14: Updated impacts of natural gas storage facilities and pipeline impacts in Southern California
Page 25: Updated SERC load forecast data
Page 28: Updated WECC resource data and associated reserve margin calculationsYou can also read