Local Aggregate Assessment - Joint Minerals & Waste Plan Central & Eastern Berkshire Authorities - February 2021
←
→
Page content transcription
If your browser does not render page correctly, please read the page content below
Central & Eastern Berkshire Authorities

    Joint Minerals & Waste Plan

Local Aggregate Assessment

            February 2021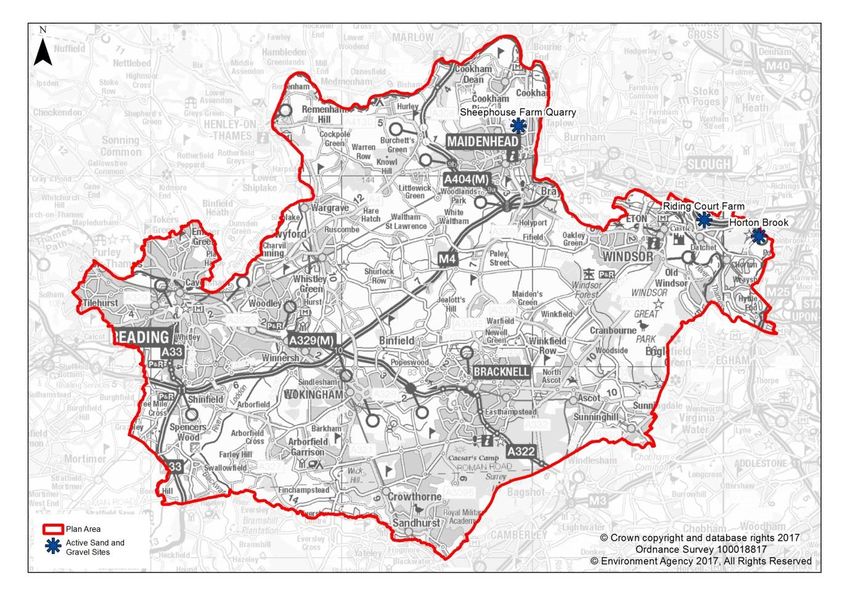
Prepared by Hampshire Services

Hampshire County Council

www.hants.gov.uk/sharedexpertise
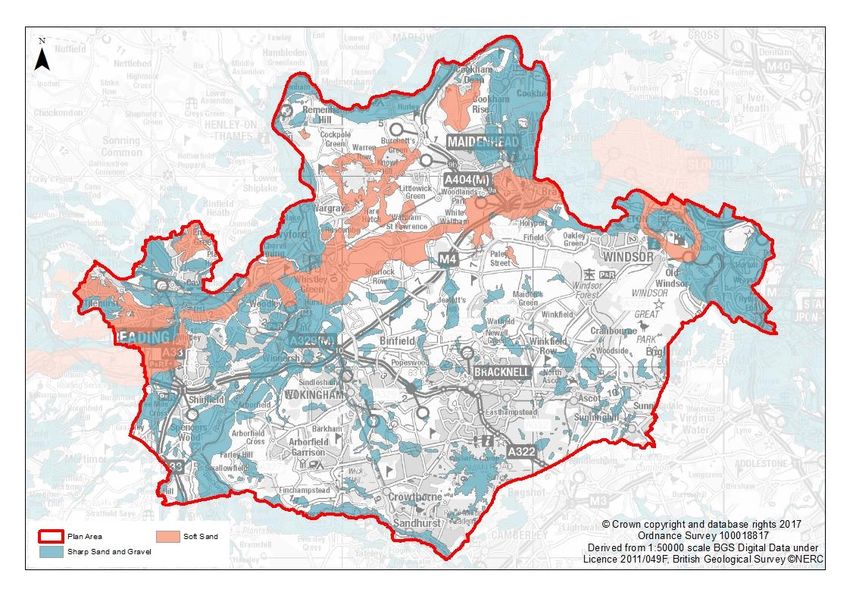
Table of Contents
1. Introduction .......................................................................................................... 3
2. Land Won Aggregate ........................................................................................... 7
3. Crushed Rock .................................................................................................... 12
4. Marine-won sand and gravel ............................................................................. 14
5. Recycled/Secondary Aggregates....................................................................... 15
6. Future Aggregate Supply ................................................................................... 18
7. Future provision of sand and gravel ................................................................... 22
8. Conclusions and review of the LAA .................................................................... 25

Tables and Figures
Table 1: Permitted active quarries in Central and Eastern Berkshire, 2019 ............... 9
Table 2: Land-won sand and gravel sales in Central and Eastern Berkshire, 2010-
2019 (Thousand tonnes, Tt) ..................................................................................... 10
Table 3: Total consumption of Primary Aggregate in Berkshire, 2009 and 2014 ...... 12
Table 4: Crushed rock sales from rail depots and wharves in Berkshire (Berks) and
Hampshire (Hants), 2010-2019 (Thousand tonnes, Tt) ............................................ 14
Table 5: Recycled aggregate capacity, 2019 ........................................................... 16
Table 6: Recycled and Secondary aggregate sales in Central and Eastern Berkshire,
2010-2019 (Thousand tonnes, Tt) ............................................................................ 17
Table 7: Central and Eastern Berkshire sand and gravel reserves and landbank 2019
................................................................................................................................. 21
Table 8: Total sales and estimated production capacity, 2019 ................................. 23

Figure 1: Sand and gravel resources in Central and Eastern Berkshire. .................... 7
Figure 2: Location of active quarries in Central and Eastern Berkshire, 2019 ............ 8
Figure 3: Sales of land-won Sand and Gravel in Central and Eastern Berkshire ..... 10
Figure 4: Sales of land-won sand and gravel in South-East England and Central and
Eastern Berkshire ..................................................................................................... 11
Figure 5: Location map of active recycled aggregate sites in Central and Eastern
Berkshire, 2019 ........................................................................................................ 17

A 2014 Summary – Central and Eastern Berkshire (for the calendar year 2019)

                    2019     Average      Average      Trend    Trend
                                                                           LAA        Reserve   Landbank   Capacity
                    Sales     (10 yr)    (3yr) Sales   (10 yr    (3 yr                                                                     Comments
                                                                         Rate (Mt)      (Mt)     (years)    (Mtpa)
                     (Mt)   Sales (Mt)      (Mt)       sales)   sales)

                                                                                                                      There are no active soft sand sites within the Plan
Soft Sand
                                                                                                                      area.

                                                                                                                      Figures are combined with soft sand to provide ‘All
Sharp Sand &                                                                                                          Sand & Gravel’ figures.
Gravel
                                                                                                                      The landbank is above the minimum 7-year
                    0.528     0.635         0.51                          0.628        7.407      11.8       1.11     requirement. The LAA Rate remains unchanged due
All Sand & Gravel
                                                                                                                      to economic uncertainties. Please note capacity is
                                                                                                                      based on 2018 data.
                                                                                                                      Central and Eastern Berkshire does not have any
Crushed Rock                                                                                                          natural hard rock resources and therefore relies on
                                                                                                                      imports of this material.

                                                                                                                      Figures for Central and Eastern Berkshire are only
Recycled /                                                                                                            available for the last 6 years. The LAA Rate reflects
                    0.092                  0.121                          0.121                             0.148     the 3-year average to account for economic
Secondary                                                                                                             uncertainty but also (temporary) capacity information.
Aggregates                                                                                                            Agg recycling capacity has been significantly reduced
                                                                                                                      at Bray Quarry.

                                                                                                                      There are no wharves in Central and Eastern
Marine Sand &
                                                                                                                      Berkshire.
Gravel

Rock Imports by                                                                                                       Not relevant to the Plan area.
Sea

Rail Depot Sales
(Sand & Gravel
                                                                                                                      There are no rail depots in Central and Eastern
                                                                                                                      Berkshire, although the area is likely to be served by
                                                                                                                      rail depots in neighbouring mineral planning areas.
Rail Depot Sales
(Crushed Rock)

                                                                                  1
It is likely that there will be in an overall increase in future aggregate demand to account for the increased level of planned future infrastructure
delivery, but this is set in the context of a current recession and future economic uncertainty. The LAA Rate of 0.628Mt for sand and gravel is
unchanged from 2018, taking account of future uncertainty. However, the LAA Rate for recycled aggregate has been reduced to 0.121 to
Comments reflect economic uncertainties but also known changes in capacity. The LAA Rates will continue to be revisited yearly to establish whether the
Central and Eastern Berkshire Authorities are making a full contribution to the Managed Aggregate Supply System. The current sales figures
show a trend of the Plan area rising to meet demand, but it is unclear whether this trend will continue based on current economic
circumstances.
2Executive Summary
Introduction
This is the Local Aggregate Assessment (LAA) for Central and Eastern
Berkshire and covers the administrative areas of the plan-making partners
(Bracknell Forest Council, Reading Borough Council, the Royal Borough of
Windsor & Maidenhead and Wokingham Borough Council). In addition,
information has been provided for Slough, where available. The purpose of the
LAA is to detail the current and predicted situation in Central and Eastern
Berkshire with respect to all aspects of aggregate supply.
Land-won Aggregate
Sand and Gravel
In terms of aggregates, Central and Eastern Berkshire’s geology provides both
sharp sand and gravel and soft sand. Aggregates used within Central and
Eastern Berkshire are sourced from land-won resources, recycled aggregate
and imports.
Within Central and Eastern Berkshire, there were three active quarries in 2018.
There have been no operational quarries within Slough Borough Council for 12
years.
Soft sand resources in the area are generally poor quality and are no longer
principally extracted within Central and Eastern Berkshire. This places a
reliance on imports to address the lack of local supply.
Sales of sand and gravel increased slightly in 2019 by 17,000 Tonnes. The
overall trajectory of 10-year sales is increasing and the pattern of sales is
broadly similar to the South East.
Crushed Rock
Central and Eastern Berkshire is dependent on imports of crushed rock
predominately from Somerset who have confirmed no issues with ongoing
supply.
Supply is imported via rail depots in West Berkshire. There is currently no
evidence that suggests a need to increase capacity at rail depots for imports.
3Marine Sand & Gravel
Marine-won sand and gravel is a small but growing proportion of the total
aggregate consumed in Berkshire. Marine imports are predominately from
London Wharves and Hampshire. Currently there is no evidence to increase
capacity at the rail depots and the 2018 data for Hampshire1 suggests that
there is unlikely to be headroom at their wharves to serve an increase in
demand.
Recycled & Secondary Aggregate
Sales of recycled aggregate in Central and Eastern Berkshire increased in
2019. Capacity survey information was limited but indicates that recycled
aggregate sites capacity has dropped significantly.
Future Aggregate Supply
There are a number of major infrastructure projects as well as local housing
and transport projects which indicate growth and therefore, an increase in
aggregate demand.
Reserves of sand and gravel in Central & Eastern Berkshire with planning
permission for extraction (permitted reserves) at 31st December 2019 were
7,407,000 tonnes (discounting Star Works as this is inactive).
The total landbank for all land-won aggregate based on 10-year average is 11.7
yrs. Based on three-year average sales, the landbank is 14.5 years, although
the landbank is not necessarily an accurate reflection of supply. The 2019 LAA
Rate remains unchanged from 2018 and is 0.628Mt. The LAA Rate has not
been updated to reflect the increase in the 10-average due to current recession
and uncertain economic recovery period.
The Central & Eastern Berkshire Authorities are working together to produce a
Joint Minerals & Waste Plan up to 2036.
The Proposed Submission Plan was subject to consultation during 2020. The
Plan includes proposed allocations for sharp sand and gravel, an aggregate
wharf and a recycled aggregate site. However, the proposals do not meet the
required demands for Central and Eastern Berkshire and therefore, the sites
are supported by criteria-based policies and an ‘Area of Search’ for sand and
gravel.
1
Hampshire 2019 LAA: http://www3.hants.gov.uk/mineralsandwaste/pd-facts-and-figures.htm
4It is estimated that the demand for soft sand over the Plan period will be in the
region of 1.0 million tonnes (65,000 tonnes per year). Sources will need to be
secured from elsewhere.
Conclusions
Central and Eastern Berkshire’s current local aggregate provision will impact on
the wider South East region as a whole if new development is not enabled to
meet the forecasted demand up to 2036. Central and Eastern Berkshire is
reliant on supplies from other mineral planning authority areas and as such this
will need to be given consideration in other relevant Mineral Local Plans
through the duty to cooperate and strategic cross-boundary liaison.
51. Introduction
1.1 The purpose of this Local Aggregate Assessment (LAA) is to detail the current
and predicted situation in Central and Eastern Berkshire with respect to all
aspects of aggregate supply.
1.2 The National Planning Policy Framework (NPPF)2 set out the requirement for
local authorities to produce an annual LAA, stating that ‘Minerals planning
authorities should plan for a steady and adequate supply of aggregates by
preparing an annual Local Aggregate Assessment, either individually or jointly
by agreement with other mineral planning authorities based on a rolling
average of 10 years sales data and other relevant local information, and an
assessment of all supply options (including marine dredged, secondary and
recycled sources)’.
1.3 Bracknell Forest Council, Reading Borough Council, the Royal Borough of
Windsor and Maidenhead and Wokingham Borough Council (collectively
referred to as the ‘Central & Eastern Berkshire Authorities’) are working in
partnership to produce the Central and Eastern Berkshire - Joint Minerals &
Waste Plan. The Plan will indicate what provision of minerals is required, where
these may be located; when they are to be provided and how they will be
delivered during the Plan period to 2036.
1.4 This is the Local Aggregate Assessment (LAA) for Central and Eastern
Berkshire and covers the administrative areas of the plan making partners. In
addition, information has been provided for Slough, where available. The
purpose of the LAA is to detail the current and predicted situation in Central and
Eastern Berkshire with respect to all aspects of aggregate supply, in particular
with regard to land-won aggregate provision up to 2036.
1.5 It is important to note that the data used in the preparation of this LAA
predominantly comes from the annual monitoring of aggregates sales by the
Central & Eastern Berkshire Authorities on behalf of the South East England
Aggregate Working Party (SEEAWP). The Aggregate Monitoring (AM) survey is
used to collect annual sales data from active mineral extraction sites, aggregate
wharves, aggregate rail depots and recycled aggregate processing sites.
2
National Planning Policy Framework, paragraph 207(a):
https://assets.publishing.service.gov.uk/government/uploads/system/uploads/attachment_data/file/810197/
NPPF_Feb_2019_revised.pdf
62. Land Won Aggregate
Geology of Central and Eastern Berkshire
2.1 The geology of Central and Eastern Berkshire is underlain by three main types
of minerals: sand and gravel, chalk and clay. There are no deposits of crushed
rock.
2.2 In terms of aggregates, Central and Eastern Berkshire’s geology (see Figure 1)
provides the following:
• Sharp sand and gravel; and
• Soft sand.
Figure 1: Sand and gravel resources in Central and Eastern Berkshire.
2.3 Central and Eastern Berkshire has the capability of supplying aggregates from
a number of sources including:
• Land-won extraction;
• recycled and secondary aggregate; and
• imported aggregate (via rail depots)3.
3
Estimate of imports by road can be found in the AM 2014 National Collation.
72.4 Further information regarding the detailed geology can be found in the
Minerals: Background Study (2020)4 which was produced in support of the
emerging Joint Minerals and Waste Plan.
Permitted Sites Producing Sand and Gravel in Central and Eastern
Berkshire
2.5 Figure 2 shows the location of the active quarries in Central and Eastern
Berkshire in 2019 which were predominately located in the north and east
within the Royal Borough of Windsor and Maidenhead. The last quarry in the
south of the area closed in 2017, meaning that the supply of sand and gravel is
currently produced entirely in the north east of the Plan area.
Figure 2: Location of active quarries in Central and Eastern Berkshire, 2019
2.6 The number of extraction sites has decreased in recent years, with 2017 seeing
the closure of two sites; Eversley Quarry and Kingsmead Quarry. In addition,
Star Works, Knowl Hill has permitted reserves but is an inactive site.
2.7 More recently, an application was granted for an extension at Horton Brook
Quarry, Horton5 in 2018 due to greater reserves being identified and Poyle
4
Minerals Background Study (2020): https://documents.hants.gov.uk/environment/Regulation19-
ProposedSubmissionConsultation-JCEBMineralsBackgroundStudy-ProposedSubmission.pdf
8Quarry, Horton was granted permission in January 20196. However, Poyle
Quarry is not yet operational and as such has not been included in Figure 1.
2.8 Extraction sites have not been operational within the administrative area of
Slough Borough Council for over 10 years. However, a number of sites operate
on the boundary of the area.
2.9 Soft sand resources in the area are generally poor quality with pockets of
material of economic interest in a small number of areas. This is highlighted in
Table 1 by the identification of only two quarries that have been producers of
soft sand; Star Works in the North which retains permitted reserves and
Kingsmead Quarry which had some incidental extraction in the West. However,
with the closure of Kingsmead Quarry and Star Works being inactive, there are
no sites currently producing soft sand. This places a reliance on imports to
address the lack of local supply. A Soft Sand Study7 produced to support the
emerging Joint Plan highlights that soft sand is supplied by various mineral
planning authority areas in the wider Thames Valley area.
2.10 In contrast, sharp sand and gravel is more widely distributed throughout Central
and Eastern Berkshire.
2.11 Table 1 provides details of the aggregate extracted at each permitted site.
Table 1: Permitted active quarries in Central and Eastern Berkshire, 2019
Aggregate
Status in
Site Operator Sharp Sand &
Soft Sand 2019
Gravel
Aggregate Active
Horton Brook
Quarry
Industries/Jayflex x
Aggregates Ltd
Riding Court Active
Farm
CEMEX x
Sheephouse Summerleaze Active
Farm Ltd x
2.12 Sheephouse Farm, Horton Brook, Poyle and Star Works are located within the
Green Belt.
5
Horton Brook Quarry Application http://publicaccess.rbwm.gov.uk/online-
applications/applicationDetails.do?keyVal=P0UNO2NIKKC00&activeTab=summary
6
Poyle Quarry Application: http://publicaccess.rbwm.gov.uk/online-
applications/applicationDetails.do?keyVal=OYZQ75NI0QY00&activeTab=summary
7
Soft Sand Study (2020): https://www.hants.gov.uk/berksconsult
9Sand and Gravel Production and Sales
2.13 The sales of land-won sand and gravel in Central and Eastern Berkshire are
shown in Table 2. Whilst the overall trajectory of sales of the last ten years has
been increasing, sales have fluctuated over the 10-year period, with sales
peaking in 2011 and 2014.
2.14 More recently, sales of sand and gravel have shown a small but steady
increase since 2016. The sales for 2019 are 17 thousand tonnes higher than
2018 and the sales for 2018 are 20 thousand tonnes higher than 2017.
Table 2: Land-won sand and gravel sales in Central and Eastern Berkshire, 2010-2019
(Thousand tonnes, Tt)
Last 3 Last 10
Year 2010 2011 2012 2013 2014 2015 2016 2017 2018 2019 yr yr
average average
Total 611 852 631 590 920 751 469 491 511 528 510 635
Sales
Footnotes
Soft sand (SS) sales are contained with the total soft sand/sharp sand and gravel figure. SS
sales are so small they cannot be individually revealed
Source: Aggregate Monitoring Surveys, 2010-2019
Figure 3: Sales of land-won Sand and Gravel in Central and Eastern Berkshire
1000
900
800
Thousand tonnes
700
600
500
400
300
200
100
0
2010 2011 2012 2013 2014 2015 2016 2017 2018 2019
Year
Source: Aggregate Monitoring Surveys, 2010-2019
2.15 Figure 3 shows the sales of land-won sand and gravel in Central and Eastern
Berkshire since 2008. Following a period of decline, a modest increase has
been observed since 2016.
102.16 When compared to the sales for South-East England (see Figure 4), the trends
in Central and Eastern Berkshire appear to be broadly similar and follow the
pattern between 2009 and 2019. South-East figures8 for sand and gravel sales
estimate a decline in 2019 which contrasts with an increase in sales in Central
and Eastern Berkshire.
Figure 4: Sales of land-won sand and gravel in South-East England and Central and
Eastern Berkshire
Source: South-East England Aggregates Monitoring Report 2019
*South East sales figures are estimated for 2019.
2.17 Mineral planning authority boundaries do not influence the flow of minerals. The
market dictates that sand and gravel will be obtained from the cheapest
location for that material. Where the demand in Central and Eastern Berkshire
can be satisfied most efficiently and cost effectively from locations in other
areas, then it will.
2.18 Table 3 shows the consumption of aggregate both imported from external areas
and supplied from sources within Berkshire.
8
South- East England Aggregates Working Party Annual Report 2019 (January 2021)
11Table 3: Total consumption of Primary Aggregate in Berkshire, 2009 and 2014
Land Won Marine Sand Total sand Crushed Rock Total Primary
Sand and and Gravel and gravel Aggregates
Gravel
Berkshire 2009 2014
2009 2014 2009 2014 2009 2014 2009 2014
Imports (Tt) 298 98 353
152 396 505 861 1,161 1257 1,666
Consumption*
807 601 98 152 905 753 875** 1,161 1780 1,914
(Tt)
Consumption
45.3% 31% 5.5% 8% 50.8% 39% 49.20% 61% 100% 100%
%
Imports/
Consumption 36.93% 58.7% 100% 100% 43.76% 67% 98.40% 100% 71% 87%
%
Source: Collation of the results of the 2009 and 2014 Aggregate Minerals survey for England &
Wales (Department for Communities and Local Government).
*Consumption is determined by total sold internally plus total imported.
**The difference in import and consumption amounts are due to known historic inaccuracies in
the 2009 National Collation data and is not considered significant. There is no reported evidence
of further flows of crushed rock from Berkshire to other areas.
2.19 In 2014, Berkshire was producing 1051 Thousand tonnes (Tt) with sales split by
248 Tt sold internally within Berkshire. A further 548 Tt was sold in the South
East region, the principal destinations being Surrey and Buckinghamshire
(including Milton Keynes) and 255 Tt sold to locations elsewhere
(predominantly West London).
2.20 There is no marine-won sand and gravel produced within Berkshire as it is land
locked nor is there any crushed tock due to geological constraints. In 2014,
Berkshire was also importing 353 Tt of land-won sand and gravel.
2.21 Although it is not possible to determine exactly what level of these imports
reach Central and Eastern Berkshire, the movements need to be taken into
consideration as a when forecasting future demand.
2.22 Table 3 shows an overall increase in supply of primary aggregates from
sources within Berkshire during this period but also an increasing reliance on
Primary Aggregate imports.
3. Crushed Rock
3.1 Central and Eastern Berkshire does not have any natural hard rock resources
and therefore relies on imports of crushed rock such as limestone and granite
to meet demand for this type of aggregate.
3.2 Information from the BGS shows that Somerset is the dominant source of
crushed rock for Berkshire. Somerset has some 380 million tonnes of approved
12reserves of crushed rock (equivalent to 28.4 years landbank at the most recent
sub regional apportionment rate)9. While not all the quarries in Somerset whose
reserves are included in the landbank have rail connections, those that do form
a significant proportion of the total. Provided Somerset maintains its productive
capacity it is estimated that there are sufficient reserves available to supply
ongoing market demand.
3.3 The importation and consumption of crushed rock within Berkshire is captured
within the aggregate monitoring data. Data is only available for the wider
Berkshire area which shows that all the crushed rock that is imported into
Berkshire is then consumed within Berkshire (see Table 3). Therefore, there is
no reported evidence of further flows of crushed rock from Berkshire to other
areas.
3.4 There are currently no operational rail depots to receive crushed rock imports
within Central and Eastern Berkshire. As such, it is assumed that the area is
served predominately by the rail depots in the wider Berkshire area, most
notably at Theale, West Berkshire. All crushed rock is then transported by road
within the Plan area.
3.5 The West Berkshire Local Aggregate Assessment (LAA) (April 2019)10
identifies that a large proportion of the aggregate sold from the two rail depots
at Theale is then exported out of West Berkshire by road, to the other Berkshire
Unitary Authorities or surrounding Authorities. The LAA also states that there is
sufficient capacity at the rail depots for an increase in demand should this occur
in the future.
3.6 Whilst capacity does exist at these rail depots, Central and Eastern Berkshire is
fully reliant on the continued operation of these depots and any threat to this
provision would have a significant impact.
3.7 The crushed rock sales (from rail imports) in Berkshire and Hampshire
recorded over the last 10 years are detailed in Table 4.
9
Somerset Local Aggregate Assessment (Fourth Edition):
www.somerset.gov.uk/EasySiteWeb/GatewayLink.aspx?alId=124408
10
West Berkshire 2018 Local Aggregate Assessment (April 2019):
https://info.westberks.gov.uk/CHttpHandler.ashx?id=43576&p=0
13Table 4: Crushed rock sales from rail depots and wharves in Berkshire (Berks) and
Hampshire (Hants), 2010-2019 (Thousand tonnes, Tt)
10 yr 3 yr
Year 2010 2011 2012 2013 2014 2015 2016 2017 2018 2019
average average
Berks
& 1054 1215 1222 1090 1208 1565 1517 1733 2042 N/A N/A N/A
Hants
Footnotes
Source: AM Surveys
In 2018, 91% of the aggregates sold from wharves and rail depots were crushed rock, 6% were
marine aggregate and 3% were Land won Sand and Gravel.
3.8 Sales of crushed rock fell between 2008 and 2013, decreasing by 21%. Since
2013, sales have increased with a significant increase in 2017 which is likely to
reflect that one of the rail depots at Theale in West Berkshire which previously
imported cement has started to import aggregate11, this high level of increase
continued into 2018. Published data is not yet available to determine the sales
figure for 2019 and therefore, the current 10 and 3-year averages. However,
draft figures estimate that crushed rock sales increased at the rail depots West
Berkshire and sales were static in Hampshire12.
3.9 Somerset County Council have sufficient reserves to meet current needs and
do not foresee any likely issues that would affect the future supply of crushed
rock to the South East Region which includes Berkshire. Should future demand
increase, the issue lies with the capacity of the rail depots to manage a higher
level of imports, rather than with future supply.
3.10 The safeguarding of the rail depots at Theale, West Berkshire will be important
for Central and Eastern Berkshire to ensure a supply of crushed rock, unless a
suitable rail depot is located within the Plan area.
4. Marine-won sand and gravel
4.1 Central and Eastern Berkshire has no wharves for the landing of marine-won
sand and gravel. However, the Aggregate Monitoring (AM) 2014 National
Collation data (see Table 4) highlighted that Berkshire’s level of imported
marine-won sand and gravel represented 5.5% of the total primary aggregate
consumed in 2009 and this rose to approximately 8% in 201413.
11
Information provided in the West Berkshire Council response to the Draft Joint Minerals & Waste Plan
consultation (17/09/2018).
12
As reported at SEEAWP meeting 24/11/2020
13
Collation of the results of the2014 Aggregate Minerals Survey for England and Wales -
www.gov.uk/government/uploads/system/uploads/attachment_data/file/563423/Aggregate_Minerals_Surve
y_England___Wales_2014.pdf
144.2 Imports into Berkshire in 2009 were 98 Tt which equated to nearly 8% of the
total primary aggregates. This rose to 9% in 2014 with 152 Tt of imported
marine aggregate. As such, marine-won sand and gravel forms a small but
growing proportion of the overall supply of aggregate to Berkshire. Although, it
is not possible to determine exactly what level of this supply reaches Central
and Eastern Berkshire, it needs to be taken into consideration when
considering future demand.
4.3 The AM2014 National collation data provides details on the sources of the
imported marine sand and gravel and highlights that the main source is from
Greater London which suggests that this is marine dredged material that has
been landed at London wharves, probably by rail. The second greatest source
is Hampshire. This is material that will have been landed at Hampshire’s
wharves. It is likely that this material will have travelled into Berkshire by road,
but it is also possible that the mineral was transported via the rail depots in
Hampshire to the depots at Hillingdon.
4.4 Any additional provision would preferably be by rail. As with the importation of
crushed rock, there is no current evidence to suggest a need for increased
capacity at the rail depots surrounding and servicing Central and Eastern
Berkshire, although existing capacity should be safeguarded.
5. Recycled/Secondary Aggregates
5.1 Data pertaining to sales of recycled or secondary aggregates is collected
annually as part of the AM surveys carried out by mineral planning authorities.
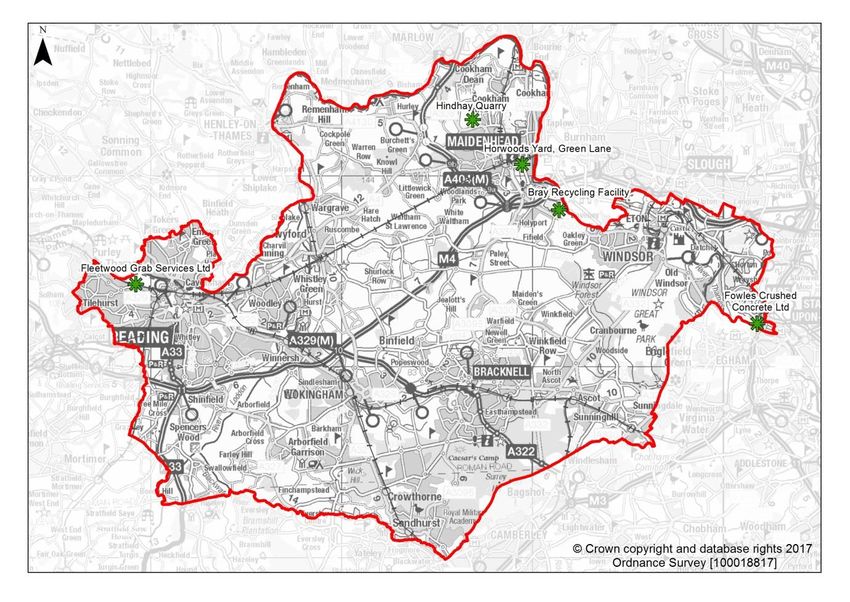
Figure 5 shows the location of all active recycled aggregate sites in operation in
Central and Eastern Berkshire during 2019 that were surveyed. It should be
noted that whilst all sites were surveyed, not all responded. As such, the results
should be treated with caution and used to only indicate a general trend of what
is happening.
5.2 There are 6 sites which have been surveyed as producers of recycled and
secondary aggregates in Central and Eastern Berkshire. Of these sites, three
responded. Where capacity information has not been made available
Environment Permit information has been used (see Table 5).
15Table 5: Recycled aggregate capacity, 2019
Facility Name Unitary Authority Recorded(1) Estimated(2)
Capacity Permanent
(tonnes) 2019 Capacity
(tonnes) 2019
Datchet/Riding Windsor & Maidenhead 30,000 0
Court Farm
Hindhay Quarry Windsor & Maidenhead 25,000 0
Bray Quarry Windsor & Maidenhead 5,000 5,000
Horwoods, Kimber Windsor & Maidenhead 4,800* 4,800*
Lane
Fowles Crushed Windsor & Maidenhead 125,000* 5,000
Concrete Ltd
Fleetwood Grab Reading 75,000* 5,000
Services
Total 264,800 19,800
Source: (1) AM2019 returns, EA Permit (*) or Planning Permission where no return
information available. (2) Permanent capacity only and likely operational capacity.
5.3 The permission at Hindhay is temporary. The operational capacity at Fleetwood
and Fowles is likely to be similar to Horwoods as the capacities provided in EA
Permits are given as ranges or are for all activities on a site. Should this be the
case, the reality of permanent aggregate recycling capacity is likely to be
approximately 20,000 tonnes (75,000 tonnes temporary capacity).
5.4 Permission was granted for aggregate recycling at Riding Court Farm/Datchet
Quarry14 in 2018 which is time limited to the life of the Quarry but is currently
yet to commence production.
5.5 Figure 5 shows the location of active recycled sites in Central and Eastern
Berkshire.
14
Riding Court Farm/Datchet Quarry Application: http://publicaccess.rbwm.gov.uk/online-
applications/applicationDetails.do?keyVal=P5ZAR3NIJW700&activeTab=summary
16Figure 5: Location map of active recycled aggregate sites in Central and Eastern
Berkshire, 2019
5.6 The sales figures of the recycled and secondary aggregate in Berkshire for the
most recent 10-year period, 2010-2019 are shown in Table 6.
Table 6: Recycled and Secondary aggregate sales in Central and Eastern Berkshire,
2010-2019 (Thousand tonnes, Tt)
2010 2011 2012 2013 2014 2015 2016 2017 2018 2019 10 yr 3 yr
Year average average
Berkshire n/a 200 320 404 587 602 498 450 459 459 442 456
Central & 85 103 128 131 138 92 121
Eastern
Berkshire
Footnotes
Source: Aggregate Monitoring Surveys, 2010-2019
5.7 Sales for Central and Eastern Berkshire dropped significantly by 33% in 2019
breaking the previous trend of increasing sales.
5.8 Sales data for the Central and Eastern Berkshire area is only available for a six-
year period and which indicates a trend of 113 Tt per year. The Central and
Eastern Berkshire sales represent an average of 23% of the Berkshire Total. If
17this average was applied to the Berkshire 10-year sales, this would suggest a
10-year trend of 101 Tt per year for Central and Eastern Berkshire.
6. Future Aggregate Supply
6.1 The Central & Eastern Berkshire Authorities are working together to produce a
Joint Minerals & Waste Plan to supersede the Replacement Minerals Local
Plan for Berkshire adopted in 1995 and subsequently adopted alterations in
1997 and 200115. The current adopted Minerals Local Plan covers the
administrative areas covered by the Central & Eastern Berkshire Authorities, as
well as Slough Borough Council and West Berkshire Council. While this plan
covers the period until 2006, the Secretary of State has directed that several
policies in them should be saved16 indefinitely until replaced by national,
regional or local minerals and waste policies. For Central and Eastern
Berkshire, these saved policies will be replaced by the Joint Minerals & Waste
Plan, when it is adopted.
Construction project demands
6.2 Infrastructure projects that are likely to place an additional demand of future
aggregate demand in Central and Eastern Berkshire relate to both housing and
transport projects. There are in the region of 55,000 remaining new homes
projected within the area over the plan period, up to 203617. Using the updated
‘Standard Method for Housing Need’18 published in February 2019, the
requirement for Central and Eastern Berkshire over the plan period is in the
region of 46,000 new homes.
6.3 Other National Infrastructure projects within 30-50 miles of Central and Eastern
Berkshire include Cross Rail, the additional runway at Heathrow19,
improvements to the M25, M3 and M4, as well as the Datchet to Teddington
flood defences. A distance of 30-50 miles is the estimated distance over which
the majority of sand and gravel produced is transported.
6.4 All these projects are of significant scale and require the future demand to be
accounted for in future aggregate supplies, over and above the annual
15
Replacement Minerals Local Plan for Berkshire (2001) - www.bracknell-forest.gov.uk/replacement-minerals-
local-plan-for-berkshire-2001.pdf
16
Mineral Local Plan Saved Policies - www.bracknell-forest.gov.uk/mineral-local-plan-saved-policies-
schedule.pdf
17
SHMA (2016) – Berkshire (including South Bucks) Strategic Housing Market Assessment
18
Housing and Economic Needs Assessment (2019) – National Planning Practice Guidance
https://www.gov.uk/guidance/housing-and-economic-development-needs-assessments
19
On 27 February 2020, the Court of Appeal ruled the decision to allow the expansion was unlawful because it
did not take climate commitments into account. The future of the proposal remains unclear.
18infrastructure delivery programme. The emerging Infrastructure Delivery
Statements contain more information on the level of future development
planned for the area, which cumulatively will place additional pressure on
aggregate supplies.
6.5 The indication is of an increase in future infrastructure delivery in the Central
and Eastern Berkshire area, leading to an increase in future aggregate
demand.
6.6 To meet future aggregate demand, including the infrastructure projects
discussed above, Central and Eastern Berkshire needs to maintain a sufficient
aggregate landbank and a greater emphasis should be placed on encouraging
recycled and secondary aggregate sites to supply future demand.
6.7 Central and Eastern Berkshire is reliant on imports of aggregates, therefore
looking at sales of aggregate in isolation does not represent current demand.
Economic Forecasts
6.8 A range of growth forecasting approached have been utilised previously to
make an assessment of future demand.
6.9 This has included the MPA growth factor of 1.1% which was applied to the
sales figures, 3-year average and 10-year average, the forecasted figures over
the plan period. In addition, the construction growth rate of 1.4% was applied to
the same set of figures.
6.10 A Population growth factor of 5.725% was applied based on ONS figures for
the Berkshire area. Finally, GDP was looked at with a 2% compound growth
rate applied.
6.11 However, current aggregate figures have outlined that there is uncertainty over
the impact of the United Kingdom leaving the European Union (‘Brexit’) on the
economy and the effect on growth.
6.12 More recently, there has been concern over the impact of the national
emergency to the Coronavirus (COVID-19) pandemic on the minerals industry.
This is expressed clearly in the Minerals Products Association Press Release20:
‘Sales volumes of ready-mixed concrete and aggregates (crushed rock and
sand & gravel), two materials that are used across most types of construction
20
MPA Press Release (05/05/2020): https://www.mineralproducts.org/20-release15.htm
19work, declined by 5.7% and 4.0% respectively over the quarter. For ready-
mixed concrete, this follows three consecutive years of market declines since
2017, as Brexit-related uncertainties put a brake on commercial construction
work, notably for offices, whilst housebuilding slowed in the capital. Housing
and the commercial sectors have also been significantly impacted by the
COVID-19 lockdown, with most major housebuilders having closed sites
throughout the last week of March and April, and office construction impacted
by the collapse in business and consumer confidence. Simultaneously, mortar
sales, which are primarily used in housebuilding, fell by a further 1.6% in the
first quarter of 2020, after a 7.9% fall at the end of last year. The trend in mortar
sales volumes has been subdued over the past 18 months, a clear indication of
the underlying weaknesses in housebuilding even before accounting for the
impact of the COVID-19 lockdown.’ The press release suggests that the impact
of Brexit was already starting to have an impact at the start of 2020 on the
construction industry which supports the OBR forecasts.
6.13 These figures have been updated for the following quarter21, suggesting
unprecedented declines with aggregate sales (crushed rock -37%, sand and
gravel -39% and mortar -61.3%). The MPA state that the ‘swift closure of
housebuilding sites as the lockdown was announced in March resulted in the
mortar market suffering an even sharper fall in demand, with sales volumes
down by 61% over the quarter. Overall, the impact of the Covid-19 lockdown
has been worse than the financial crash between 2007 and 2009’.
6.14 The sand and gravel LAA Rate in 2018 of 0.628Mt was based on the 10-year
average which also echoed the five-year average.
6.15 In light of the current economic uncertainties, the 2018 LAA Rate of 0.628Mt is
being retained. Whilst sales figures increased in 2019 which increased the
three-year average, an increase in the forecast would not account for the
unprecedented decline in 2020. It is also recognised that with the
Government’s drive for housing and infrastructure delivery, sales will recover.
However, it is not yet clear the rate and shape of the recovery. Recent
permissions at Poyle and Land south of Windsor Road will enable sales
recovery once operational.
6.16 The recycled and secondary aggregate 2018 LAA rate was consistent with 3-
year average sales. This approach has been taken in 2019 and therefore, the
LAA Rate is 0.121Mt. This is a reduction from the 2018 Rate and reflects the
change in capacity. Bray Quarry has significantly reduced the recycled
21
MPA Press Release (03/08/2020): https://www.mineralproducts.org/20-release26.htm
20aggregate capacity. However, permission was granted for aggregate recycled
at Datchet Quarry which has not yet been activated.
Landbank
6.17 The NPPF22 requires Mineral Planning Authorities to make provision for the
maintenance of a landbank of at least seven years for sand and gravel. The
seven-year landbank stipulated is the absolute minimum level of provision
required and Mineral Planning Authorities should seek to maintain a landbank
above this level.
6.18 Reserves of sand and gravel in Central & Eastern Berkshire with planning
permission for extraction (permitted reserves) at 31 December 2019 were
7,407,000 tonnes (discounting Star Works as this is inactive).
6.19 Table 7 shows that a landbank based on 2019 sales figures is 14 years. Sales
were significantly lower in 2016 and 2017 than previous years resulting in a
higher landbank figure.
6.20 The total landbank for all land-won aggregate based on 10-year average is 11.6
years which is comfortably above the 7 years required by the NPPF. Based on
3-year average sales the landbank is 14.5 years which has increased due to
the lower sales in 2016, 2017 and 2018.
6.21 Application of the 2019 LAA Rate results in a landbank of 11.8 years.
Table 7: Central and Eastern Berkshire sand and gravel reserves and landbank 2019
Landbank based Landbank based
Landbank Landbank
Permitted upon 10yr upon 3yr
based upon based on
Reserve average sales average sale
2019 sales 2019 LAA
(Tt) between 2010- between 2017-
(years) Rate
2019 (years) 2019 (years)
Total
Sand
7,407 11.6 14.5 14.0 11.8
&
Gravel
Source: Aggregate Monitoring survey data.
18
National Planning Policy Framework (Feb 2019)
https://assets.publishing.service.gov.uk/government/uploads/system/uploads/attachment_data/file/810197/
NPPF_Feb_2019_revised.pdf
21Future provision of sand and gravel
6.22 The emerging Joint Plan period is up to 2036 and outlines a requirement of
5,447,000 tonnes of sand and gravel during the life of the Plan.
6.23 Poyle Quarry (the last remaining allocation from the adopted Plan in the area)
was granted planning permission in January 201923. An application for Water
Oakley, Holyport was permitted July 202024. Permission was refused in August
2019 for the extraction of 3.6mt at land known as Bridge Farm, Arborfield25.
6.24 A Proposed Submission Plan was produced, and a Regulation 19 consultation
undertaken between September and October 2020. The Plan contains
Development Management policies and allocations. The allocations included
two sharp sand and gravel extension sites, an aggregate wharf and one
aggregate recycling site. No soft sand sites were identified for inclusion in the
Plan. The proposed allocations are not sufficient to meet the identified needs
of Central and Eastern Berkshire and therefore, the allocations are supported
by criteria-based policies and in the case of sand and gravel, an ‘Area of
Search’ to enable further development proposals to come forward. It is
anticipated that the Plan will be submitted to Government during winter 2020.
6.25 There is no available soft sand sales data to determine what the future demand
of soft sand during the Plan period will be. A study was undertaken during
2019 to identify where soft sand is supplied from. It concluded that soft sand is
supplied to Central & Eastern Berkshire from a range of neighbouring
authorities and is not reliant on any one source.
6.26 As the Plan area is reliant in imports, sources of this supply will need to be
secured from elsewhere. However, neighbouring authorities such as West
Berkshire, Hampshire and Surrey have constrained soft sand resources due to
Areas of Outstanding Natural Beauty and the South Downs National Park.
Therefore, future supply may need to be considered from alternative sources
such as marine or brought into the Plan area from greater distances. However,
it is recognised that greater distances are less sustainable due to the transport
impacts.
23
Poyle Quarry Application: http://publicaccess.rbwm.gov.uk/online-
applications/applicationDetails.do?keyVal=OYZQ75NI0QY00&activeTab=summary
24
Water Oakley Application: http://publicaccess.rbwm.gov.uk/online-
applications/applicationDetails.do?keyVal=PHF8GVNI0CV00&activeTab=summary
25
Bridge Farm Application:
https://planning.wokingham.gov.uk/FastWebPL/detail.asp?AltRef=170433&ApplicationNumber=&AddressPref
ix=&Postcode=&KeywordSearch=bridge+farm&Submit=Search
22Capacity
6.27 Site capacity is included as part of the Aggregate Monitoring 2019 survey. By
understanding current capability of sites, through capacity, it is hoped that this
information can be used to assist planning for future demand. The results of
this are shown in Table 8.
Table 8: Total sales and estimated production capacity, 2019
% Sales / Capacity 3 yr
Sales (Mt) Capacity* (Mt)
Production average (Mt)
Land-won
0.528 1.11 47% 1.1
Aggregate
Recycled
0.092 0.148 62% 0.23
Aggregate
Footnotes
Source: Aggregate Monitoring Survey, 2019. Please note collecting capacity data from
operators in this manner is still in early stages and therefore the results should be treated with
caution
6.28 Capacity for both land-won aggregate has remained consistent over the three
years with just a small increase of 0.01Mt in comparison to the 2018 capacity.
Capacity for recycled aggregate is lower in 2019 than the three years average.
Looking at the data, this change is due to a reduced reported capacity in 2019,
which has resulted in an overall decrease.
6.29 It is possible to compare sales with capacity to understand void production
capacity. Table 8 indicates that for land-won aggregate, there is the potential
for sales to be on average over 50% higher than currently recorded, with sites
currently producing at an average rate of 47% capacity. However, land-won
sales are dictated by the needs of industry. But it does suggest that there is
sufficient capacity to accommodate uplift in demand as a result of future
development.
6.30 The returns data suggests that recycled and secondary aggregate sites are
also currently operating under capacity. There has been a significant reduction
in capacity since 2018 but overall, the indication is that there is still operational
capacity.
6.31 It is worth noting that not all operators returned information on capacity, and
therefore the capacity data provided is not 100% accurate.
6.32 Data on recycled aggregate is notoriously difficult to determine due to the
temporary nature of sites and the potential for unauthorised operations. The
23proposed recycled aggregate allocation at Riding Court Farm/Datchet Quarry26
in the Draft Plan was permitted in 2018 (subject to legal agreements). The
permission (30,000 tonnes per year maximum) is limited to the life of the
quarry.
26
Riding Court Farm/Datchet Application: http://publicaccess.rbwm.gov.uk/online-
applications/applicationDetails.do?activeTab=summary&keyVal=P5ZAR3NIJW700
247. Conclusions and review of the LAA
7.1 This LAA has shown that Central and Eastern Berkshire’s current local
aggregate provision will impact on the wider South East region as a whole if
new development is not enabled to meet the forecasted demand up to 2036.
7.2 There were no site closures in 2019 and only one planning permission granted
for Poyle Quarry during this period (January 2019), although this site remains
inactive.
7.3 Following consideration of current economic climate, the 2019 LAA Rate
remains at 0.628 mtpa for sharp sand and gravel.
7.4 Due to the lack of suitable resources, Central and Eastern Berkshire is reliant
on supplies from other mineral planning authority areas and as such will need
to be given consideration in other Mineral Local Plans through strategic cross-
boundary liaison. This could be supported by Statements of Common Ground,
which take into account the current sources of minerals whilst recognising the
constraints on resources in some neighbouring areas and the potential impact
this may have on future supply.
7.5 The need for any additional infrastructure, such as the further requirement for
land-won extraction, will be identified through the Joint Minerals and Waste
Plan and will be monitored through LAAs. Where it is not possible to identify
sufficient sites to meet the identified needs of Central and Eastern Berkshire,
the Joint Plan will contain enabling policies to allow further opportunities to
arise during the life of the Plan. The sand and gravel policy will be supported by
an ‘Area of Search’ to demonstrate the distribution of resources of sand and
gravel across the plan area to encourage suitable proposals to come forward
for consideration.
25A summary of this document can be made available in large print, in Braille or audio cassette. Copies in other languages may also be obtained. Please contact Hampshire Services by email berks.consult@hants.gov.uk or by calling 0370 779 5634.
You can also read