Cape Coral-Fort Myers, Florida - COMPREHENSIVE HOUSING MARKET ANALYSIS
←
→
Page content transcription
If your browser does not render page correctly, please read the page content below
The analysis presented in this report was completed prior to the COVID-19 outbreak
in the United States and therefore the forecast estimates do not take into account
the economic and housing market impacts of the actions taken to limit contagion
of the virus. At this time, the duration and depth of the economic disruption are
unclear, as are the extent and effectiveness of countermeasures. HUD will continue
to monitor market conditions in the HMA and provide an updated report/addendum
in the future.

     COMPREHENSIVE HOUSING MARKET ANALYSIS

     Cape Coral-Fort Myers,
                   Florida
      U.S. Department of Housing and Urban Development,
      Office of Policy Development and Research
      As of January 1, 2020

      Share on: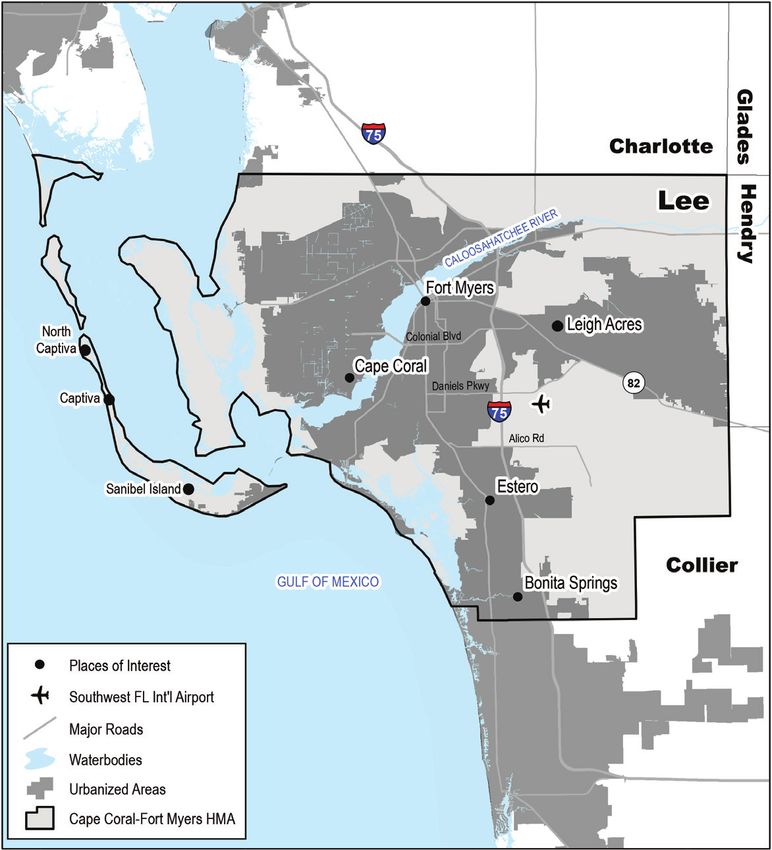
Cape Coral-Fort Myers, Florida Comprehensive Housing Market Analysis as of January 1, 2020 Executive Summary 2
Executive Summary
Housing Market Area Description
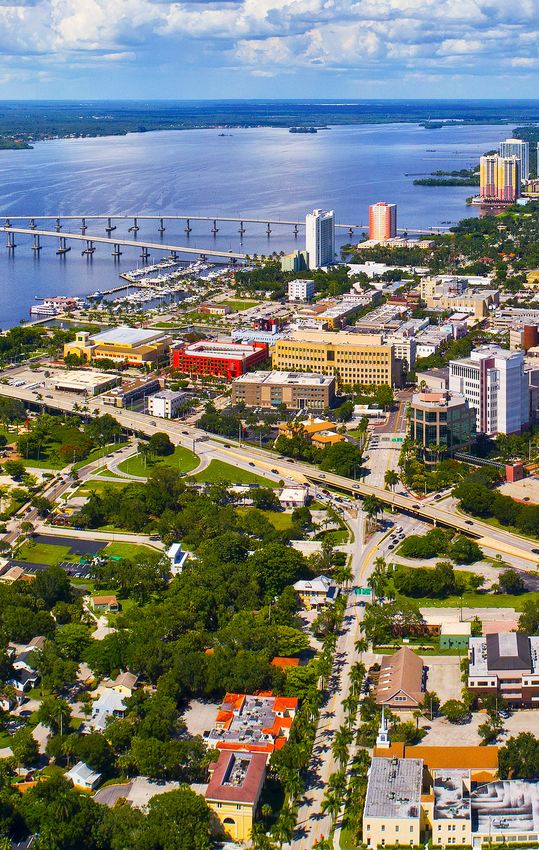
The Cape Coral-Fort Myers Housing Market Area, hereafter
the Cape Coral HMA, is coterminous with the metropolitan
statistical area of the same name and consists of Lee County
on the southwestern coast of the state of Florida, along the
Gulf of Mexico. The HMA is a popular tourist and retirement
destination. The current population is estimated at 778,300.
Tools and Resources
Find interim updates for this metropolitan area, and select geographies nationally,
at PD&R’s Market-at-a-Glance tool.
Additional data for the HMA can be found in this report’s supplemental tables.
For information on HUD-supported activity in this area, see the Community Assessment Reporting Tool.
Comprehensive Housing Market Analysis Cape Coral-Fort Myers, Florida
U.S. Department of Housing and Urban Development, Office of Policy Development and Research
Cape Coral-Fort Myers, Florida Comprehensive Housing Market Analysis as of January 1, 2020                                                                                             Executive Summary 3

Market Qualifiers
Economy                                                              Sales Market                                                                  Rental Market
             Strong: Since 2011, nonfarm                                            Balanced: The sales vacancy rate                                                Balanced: The average apartment
             payrolls have increased by an                                          is currently estimated at 2.2                                                   rent in the Cape Coral HMA was
             average of 9,300 jobs, or 4.0                                          percent, down from 6.6 percent                                                  $1,202 during the fourth quarter of
             percent, annually.                                                     in 2010.                                                                        2019, up 2 percent from a year ago.

Led by job growth in the mining, logging, and                        As of January 1, 2020, the sales market is                                    The rental market is balanced, with an overall
construction sector, nonfarm payrolls increased                      balanced, with a 4.6-month supply of for-sale                                 vacancy rate for all types of rental housing
by 10,000 jobs, or 3.7 percent, to 281,400 jobs                      housing. A total of 4,575 new homes sold                                      estimated at 10.0 percent. The apartment market
during 2019. Robust commercial and residential                       during 2019, up 9 percent from 2018. During the                               is also balanced, with a vacancy rate of 5.0
construction accounted for strong job growth                         3-year forecast period, demand is expected for                                percent as of the fourth quarter of 2019, compared
in the construction subsector, a thriving tourist                    16,550 new homes, with the 3,175 homes under                                  with 4.7 percent a year earlier. Demand for 5,125
industry contributed to gains in the leisure and                     construction satisfying a portion of demand in                                units is expected during the forecast period.
hospitality sector, and steady population growth                     the first year.                                                               The approximately 4,075 units currently under
led to job gains in the transportation and utilities                                                                                               construction will meet most of the demand.
and education and health services sectors.
Nonfarm payrolls are estimated to increase an
average of 3.4 percent annually during the
3-year forecast period.

TABLE OF CONTENTS
Economic Conditions 4                                                                                         3-Year Housing Demand Forecast
Population and Households 8                                                                                                                             Sales Units                    Rental Units
                                                                                                                 Total Demand                             16,550                           5,125
Home Sales Market 11                                            Cape Coral HMA
                                                                                                                 Under Construction                         3,175                          4,075
Rental Market 16                                              Notes: Total demand represents estimated production necessary to achieve a balanced market at the end of the forecast period. Units under
Terminology Definitions and Notes 19                          construction as of January 1, 2020. The forecast period is January 1, 2020, to January 1, 2023.
                                                              Source: Estimates by the analyst

                                                                                                                 Comprehensive Housing Market Analysis Cape Coral-Fort Myers, Florida
                                                                                                         U.S. Department of Housing and Urban Development, Office of Policy Development and Research
Cape Coral-Fort Myers, Florida Comprehensive Housing Market Analysis as of January 1, 2020 Economic Conditions 4
Economic Conditions The Cape Coral HMA is the home of a growing cluster of outsourcing, business
support, consultancy, and call center companies. The aging retired population has
Largest Sector: Wholesale and Retail Trade supported the growth of healthcare companies and hospitals in the past decade,
and this growth has given rise to a concentration of medical research and supply
During 2019, payrolls in the wholesale and retail trade sector— companies. Skyplex Commercial Park is a developing commerce area, which has
which represents 18 percent of total payrolls—increased by 1,200 become a growing employment center within the foreign trade zone at Southwest
jobs, or 2.4 percent, compared with 2018.
Florida International Airport. Since 2014, an increase in job and population growth
in the Cape Coral HMA has bolstered the construction industry as the development
Primary Economic Factors of homes, apartments, and commercial properties has increased.
The Cape Coral HMA is a popular retirement area and tourist destination. Beaches
along the shore of the mainland and the barrier islands of Sanibel and Captiva Nonfarm Payroll Trends
are known for fishing and seashell collecting. Southwest Florida International Payrolls in the Cape Coral HMA have been increasing every year since 2011,
Airport served approximately 10.2 million travelers in 2019, up 9 percent from following declines from 2007 through 2010; current payrolls are 21 percent above
the 9.4 million travelers served in 2018 (Lee County Port Authority). Visitors the pre-recessionary peak of 232,200 jobs in 2006 (Figure 2). From 2007 through
support the leisure and hospitality sector and the retail trade subsector, which 2010, nonfarm payrolls decreased by an average of 8,500 jobs, or 3.9 percent, a
together compose 30 percent of all payrolls in the Cape Coral HMA (Figure 1). year, with the greatest declines in the mining, logging, and construction sector; the
Figure 1. Share of Nonfarm Payroll Jobs in the Cape Coral HMA, by Sector Figure 2. 12-Month Average Nonfarm Payrolls in the Cape Coral HMA
Local 12% Mining, Logging, & Construction 12% National Recession Nonfarm Payrolls
State 2% 300
Nonfarm Payrolls (in Thousands)
Federal 1% Manufacturing 2%
Wholesale 3% 280
Other Services 4%
Government
15% 260
240
Total Trade 18% Retail 15%
281.4
220
Leisure & Hospitality 15%
200
Transportation & Utilities 2%
180
Information 1%
Financial Activities 5% 160
De 00
De 06
De 5
De 08
De 09
De 04
De 2
De 03
De 07
De 01
De 5
De 16
De 14
De 10
De 8
9
De 12
De 13
De 17
De 11
Education & Health Services 11%
c-0
c-0
c-1
c-1
c-1
c-
c-
c-
c-
c-
c-
c-
c-
c-
c-
c-
c-
c-
c-
c-
Professional & Business Services 14%
De
Notes: Total nonfarm payrolls are in thousands. Percentages may not add to 100 percent due to rounding. Note: 12-month moving average.
Based on 12-month averages through December 2019. Sources: U.S. Bureau of Labor Statistics; National Bureau of Economic Research
Source: U.S. Bureau of Labor Statistics
Comprehensive Housing Market Analysis Cape Coral-Fort Myers, Florida
U.S. Department of Housing and Urban Development, Office of Policy Development and ResearchCape Coral-Fort Myers, Florida Comprehensive Housing Market Analysis as of January 1, 2020 Economic Conditions 5
Table 1. 12-Month Average Nonfarm Payroll Jobs (1,000s)
wholesale and retail trade sector; and the professional and business services in the Cape Coral HMA, by Sector
sector, which posted average annual losses of 5,400, 1,500, and 1,000 jobs, 12 Months 12 Months
or 19.1, 3.5, and 3.8 percent, respectively. During the following period, from Ending Ending Absolute Percentage
December December Change Change
2011 through 2013, most sectors in the Cape Coral HMA increased, and payroll 2018 2019
gains averaged 6,800 jobs, or 3.3 percent, a year. This growth was faster than Total Nonfarm Payroll Jobs 271.4 281.4 10.0 3.7
Goods-Producing Sectors 37.0 39.6 2.6 7.0
payroll growth for the state and nation, which averaged 1.9 and 1.5 percent
Mining, Logging, & Construction 30.7 33.1 2.4 7.8
annually, respectively, from 2011 through 2013. Growth in the Cape Coral HMA Manufacturing 6.3 6.5 0.2 3.2
accelerated from 2014 through 2016, with payrolls increasing by an average Service-Providing Sectors 234.5 241.8 7.3 3.1
of 13,100 jobs, or 5.7 percent, a year, compared with growth in the state and Wholesale & Retail Trade 49.2 50.4 1.2 2.4
Transportation & Utilities 5.2 5.5 0.3 5.8
nation, which averaged 3.4 and 1.9 percent, respectively. The mining, logging,
Information 2.8 2.7 -0.1 -3.6
and construction sector and the professional and business services sector led Financial Activities 13.5 13.6 0.1 0.7
the expansion in the Cape Coral HMA, gaining an average of 2,900 and 2,200 Professional & Business Services 37.6 39.4 1.8 4.8
jobs, or 14.5 and 7.5 percent, a year, respectively from 2014 through 2016. Education & Health Services 30.2 32.1 1.9 6.3
During 2017 and 2018, job growth moderated with an average annual gain of Leisure & Hospitality 41.6 43.6 2.0 4.8
Other Services 11.6 11.8 0.2 1.7
6,900 jobs, or 2.7 percent, in the Cape Coral HMA. Government 42.7 42.7 0.0 0.0
Notes: Based on 12-month averages through December 2018 and December 2019. Numbers may not
Current Conditions—Nonfarm Payrolls add to totals due to rounding. Data are in thousands.
Source: U.S. Bureau of Labor Statistics
During 2019, nonfarm payrolls in the Cape Coral HMA increased by 10,000 jobs,
or 3.7 percent, to 281,400 jobs (Table 1), following growth of 7,900 jobs, or 3.0 Figure 3. 12-Month Average Unemployment Rate
in the Cape Coral HMA and the Nation
percent, in 2018. By comparison, during 2019, nonfarm payrolls in the state
and nation increased 2.5 and 1.6 percent, respectively, following growth of 2.4 Cape Coral HMA Nation
and 1.7 percent, respectively, during 2018. Most sectors in the Cape Coral HMA 14.0
added jobs or remained stable. The mining, logging, and construction; leisure
Unemployment Rate (%)
12.0
and hospitality; and the education and health services sectors—which increased
10.0
by 2,400, 2,000 and 1,900 jobs, or 7.8, 4.8, and 6.3 percent, respectively,
during 2019—led job growth, compared with a year earlier. 8.0
6.0
Current Conditions—Unemployment 4.0
The unemployment rate, which peaked at 12.5 percent in 2010, averaged 3.1
percent during 2019, down from 3.4 percent a year earlier. By comparison, the 2.0
national unemployment rate declined from an average of 3.9 to 3.7 percent, and
De 00
De 5
De 06
De 2
De 8
De 09
De 03
De 04
De 07
De 01
De 10
De 5
De 2
De 16
De 8
9
De 13
De 14
De 17
De 11
c-0
c-0
c-0
c-1
c-1
c-1
c-1
c-
c-
c-
c-
c-
c-
c-
c-
c-
c-
c-
c-
c-
De
the state unemployment rate declined from an average of 3.6 to 3.2 percent
during the past year (Figure 3). Note: Based on the 12-month moving average.
Source: U.S. Bureau of Labor Statistics
Comprehensive Housing Market Analysis Cape Coral-Fort Myers, Florida
U.S. Department of Housing and Urban Development, Office of Policy Development and ResearchCape Coral-Fort Myers, Florida Comprehensive Housing Market Analysis as of January 1, 2020 Economic Conditions 6
Economic Sectors of Significance In 2018, 4.8 million tourists visited the Cape Coral HMA and spent $3.1 billion,
up 1 percent from spending the previous year (Lee County Visitor and
Leisure and Hospitality Convention Bureau). Part of this revenue can be attributed to the popularity
The leisure and hospitality sector has been the fastest growing payroll sector of the spring training of the Minnesota Twins and the Boston Red Sox Major
in the Cape Coral HMA since 2001 (Figure 4). The HMA is popular for its League Baseball teams, where attendees spent an estimated $68.9 million
beaches, golfing, boating, fishing, and mild weather. Job losses in the leisure in 2018 (Lee County Sports Development).
and hospitality sector were brief during the downturn resulting from the housing Professional and Business Services
crisis; jobs declined at an average annual rate of 500 jobs, or 1.7 percent,
The professional and business services sector represents 14 percent of payrolls
during 2009 and 2010. The sector increased by an average of 1,500 jobs, or 4.4 in the Cape Coral HMA and has been the second-fastest-growing sector since
percent, annually, from the start of the economic recovery in 2011 through 2018. 2001. After losses of 900 jobs, or 3.5 percent, annually from 2006 through
Some of these jobs can be attributed to the seven hotels that have opened 2010, the professional and business services sector rebounded and grew
since 2015, adding more than 700 rooms. Those hotels include the Fairfield by by 1,700 jobs, or 5.7 percent, annually from 2011 through 2018. The Cape
Marriott, which opened in 2018 in the city of Cape Coral and created 90 new Coral HMA is home to a cluster of customer service, business system design,
jobs. During 2019, leisure and hospitality sector payrolls increased by 2,000 outsourcing, and call center companies. These firms are scattered from the
jobs, or 4.8 percent, compared with a gain of 500 jobs, or 1.2 percent, during Alico Commerce Corridor south of the airport and Skyplex Commercial Park
the previous 12 months. Bonita Springs and the islands of Sanibel, Captiva, stretching north to Colonial Boulevard along Interstate 75 (I-75). Gartner, Inc.,
and North Captiva are known for sugar sand beaches and seashell collecting. the fifth largest employer in the Cape Coral HMA (Table 2), is a research and
Figure 4. Sector Growth in the Cape Coral HMA, 2001 to Current Table 2. Major Employers in the Cape Coral HMA
Total Nonfarm Payroll Jobs Number of
Goods-Producing Sectors Name of Employer Nonfarm Payroll Sector
Employees
Mining, Logging, & Construction
Manufacturing Lee Memorial Health System Foundation, Inc. Education & Health Services 13,595
Service-Providing Sectors
Wholesale & Retail Trade Lee County Government 9,038
Transportation & Utilities
Information Florida Gulf Coast University Government 3,430
Financial Activities
Professional & Business Services Florida SouthWestern State College Government 1,441
Education & Health Services
Leisure & Hospitality Gartner, Inc. Professional & Business Services 1,200
Other Services
Government Chico’s FAS, Inc. Wholesale & Retail Trade 1,147
-60 -40 -20 0 20 40 60 80 100 120 The Hertz Corporation Financial Activities 1,110
Change in Jobs (%) Shell Point Retirement Community Education & Health Services 1,011
Note: The current date is January 1, 2020. Note: Excludes local school districts.
Source: U.S. Bureau of Labor Statistics Source: Lee County Economic Development
Comprehensive Housing Market Analysis Cape Coral-Fort Myers, Florida
U.S. Department of Housing and Urban Development, Office of Policy Development and ResearchCape Coral-Fort Myers, Florida Comprehensive Housing Market Analysis as of January 1, 2020 Economic Conditions 7
consultancy firm that had a staff of 350 in 2012 but grew to currently employ 1,200 Mining, Logging, and Construction
people. In 2018, Ace Hardware added 110 jobs with the opening of a call center, The Great Recession affected the mining, logging, and construction sector
and Alta Resources, a business outsourcing company, expanded operations, severely, which declined by an average of 5,400 jobs, or 19.1 percent, a year in
adding 65 jobs. The professional and business services sector grew by 1,800 jobs, the Cape Coral HMA from 2007 through 2010. The HMA economy expanded from
or 4.8 percent during 2019, compared with a gain of 2,000 jobs, or 5.6 percent, 2011 through 2013; however, growth in the mining, logging, and construction
during 2018. Growth in this sector is expected to continue in the forecast period. sector lagged other sectors in the HMA partly because builders and developers
Education and Health Services that survived the housing crisis were cautious after the severe losses incurred in
the late 2000s. Jobs increased by an average of 400 jobs, or 2.3 percent, in the
The education and health services sector has been the third fastest-growing
sector, slower than the overall nonfarm payroll growth in the HMA of 6,800 jobs,
sector since 2001 and currently accounts for 32,100 jobs, or 11 percent of total
or 3.3 percent, annually, from 2011 through 2013. Subsequent mining, logging,
nonfarm payrolls. This sector added an average of 700 jobs, or 3.2 percent,
annually from 2001 through 2018. Gains are credited to increased demand and construction sector growth averaging 2,900 jobs, or 14.5 percent, annually
for health services as the population continues to grow and age; from 2010 from 2014 through 2016 far outpaced the rate of growth of total nonfarm payrolls,
to 2018, the population of residents age 65 years and older was the fastest which increased by 13,100 jobs, or 5.7 percent annually. During 2019, the mining,
growing cohort in the Cape Coral HMA. In addition, in 2018, Lee Health, the logging, and construction sector accounted for 24 percent of job growth that
largest employer in the Cape Coral HMA, opened a new $140 million medical occurred in the Cape Coral HMA and gained 2,400 jobs, or 7.8 percent, to 33,100
complex in the city of Estero, and a new 41,000-square-foot NCH Healthcare jobs. Contributing to growth in the sector, Gulf Coast Regional Medical Center
Bonita emergency facility in the city of Bonita Springs. A cluster of medical is undergoing a $315 million renovation and expansion, and Southwest Florida
research and supply companies augments healthcare facilities in the HMA. International Airport broke ground in August 2019 on an $80 million traffic control
During 2019, education and health services sector payrolls increased by 1,900 tower. During construction, the airport project has added 600 construction jobs.
jobs, or 6.3 percent, compared with a gain of 1,000 jobs, or 3.4 percent, during The 12-story, 243-room Luminary Hotel & Co. is currently under construction
2018. This sector is expected to continue to expand during the forecast period in downtown Fort Myers and is expected to be complete in August 2020. In
as strong population growth and an aging population continue to grow the addition, several multifamily and single-family home developments are underway,
need for health services. which have also added jobs to the construction subsector.
Employment Forecast near the Alico Commerce Corridor and add 295 jobs upon completion by 2021.
During the 3-year forecast period, nonfarm payroll growth in the Cape Coral HMA Conditioned Air has announced plans to build an operations center along the I-75
is expected to continue at a slightly slower pace than the past year. Nonfarm corridor, which will add 150 jobs when complete. In the Skyplex Commercial Park,
payrolls are estimated to increase an average of 3.4 percent, annually, and Intrepid Aerospace Inc. recently announced plans to open a new maintenance,
payroll growth is anticipated to be relatively steady during all 3 years. Gains are overhaul, and repair facility that is expected to add approximately 500 new jobs to
expected across most sectors of the economy. NeoGenomics Laboratories, Inc., the other services sector. Alta Resources will add a $21 million facility that will
a clinical laboratory, announced plans to build its new $25 million headquarters create 480 jobs in the professional and business services sector.
Comprehensive Housing Market Analysis Cape Coral-Fort Myers, Florida
U.S. Department of Housing and Urban Development, Office of Policy Development and ResearchCape Coral-Fort Myers, Florida Comprehensive Housing Market Analysis as of January 1, 2020 Population and Households 8
Population and Households Figure 5. Components of Population Change in the Cape Coral HMA,
2000 Through the Forecast
Current Population: 778,300 Net Natural Change Net Migration Population Growth
30,000
From 2010 to 2018, the share of the population age 65 and older
25,000
increased, whereas the share of all other age cohorts declined.
Population Change
20,000
15,000
Population Trends 10,000
Despite relatively steady in-migration during periods of job growth, population
5,000
growth in the Cape Coral HMA has slowed during the current decade partly
because of a decline in net natural change (resident births minus resident 0
deaths). Since 2010, population growth has averaged 16,350, or 2.4 percent, -5,000
annually (Table 3); that growth consists of net in-migration of approximately
nt
t
7
0
4
8
6
as
00
01
01
01
01
re
ec
ur
-2
-2
-2
-2
-2
16,650 people, partly offset by negative net natural change of 300. Total
or
07
-C
03
10
16
14
-F
18
20
20
20
20
20
nt
population growth was higher from 2003 to 2007, with an average increase
20
rre
Cu
of 26,750, or 5.0 percent, annually (Figure 5; U.S. Census Bureau population
estimates as of July 1) because of job growth that occurred in the Cape Coral Notes: Net natural change and net migration totals are average annual totals over the time period. The
forecast period is from the current date (January 1, 2020), to January 1, 2023.
HMA. Average net in-migration was 25,800 people a year, and net natural Sources: U.S. Census Bureau; current to forecast—estimates by the analyst
change averaged 950 people a year. Population growth was lowest from
2007 to 2010, a period of payroll decline, and averaged 5,250; that lower
growth was partially because of lower net in-migration, which averaged 3,800
Table 3. Cape Coral HMA Population and Household Quick Facts people annually. As the economy began to expand after the Great Recession,
2010 Current Forecast from 2010 to 2014, migration into the HMA increased to an average of 14,050,
Population Population 618,754 778,300 827,300 annually; however, net natural change averaged only 180 people annually.
Quick Facts Average Annual Change 17,800 16,350 16,350 Payroll increases were strong, then a period of higher net in-migration of
Percentage Change 3.4 2.4 2.1 19,800 per year from 2014 to 2018 followed. Net natural change began to
2010 Current Forecast decline in 2010 and has been negative since 2016.
Household
Age Cohort Trends
Households 259,818 322,700 343,200
Quick Facts Average Annual Change 7,125 6,450 6,825
Percentage Change 3.3 2.2 2.1 The fastest growing cohort in the Cape Coral HMA is people ages 65 and older
Notes: Average annual changes and percentages changes are based on averages from 2000 to 2010, (Figure 6). Like the nation as a whole, the population in the HMA aged during
2010 to current, and current to forecast. The forecast period is from the current date (January 1, 2020), the 2010s. The share of residents ages 65 and older grew from 23 percent of
to January 1, 2023.
Sources: 2000 and 2010—2000 Census and 2010 Census; current and forecast—estimates by the analyst the HMA population in 2010 to 26 percent in 2018 and was the only age cohort
Comprehensive Housing Market Analysis Cape Coral-Fort Myers, Florida
U.S. Department of Housing and Urban Development, Office of Policy Development and ResearchCape Coral-Fort Myers, Florida Comprehensive Housing Market Analysis as of January 1, 2020 Population and Households 9
Figure 6. Population by Age Range in the Cape Coral HMA
Household Trends
2010 2018 Household growth has also slowed during the current decade. Currently,
40 approximately 322,700 households are in the Cape Coral HMA, an average
Portion of Total Population (%)
35 annual increase of 6,450, or 2.2 percent, since 2010; that number is down
30 from an average increase of 7,125 households, or 3.3 percent, annually from
25 2000 to 2010. The homeownership rate in the Cape Coral HMA decreased
20 from 76.5 percent in 2000 to 71.0 percent in 2010. The current homeownership
15 rate is estimated at 70.5 percent (Figure 7). Student households represent less
10 than 1 percent of all households in the HMA; however, the share is expected
5 to be greater in the neighborhoods closest to Florida Gulf Coast University.
0
Student enrollment at Florida Gulf Coast University was 15,000 during the fall
19 Years Age 20 Age 35 Age 65 of 2018, with approximately one-third of students living on campus and the rest
and Younger to 34 to 64 and Older commuting from neighboring areas, both within and outside the HMA.
Source: U.S. Census Bureau
Figure 7. Households by Tenure and Homeownership Rate
to increase as a share of the total population during this period (American
in the Cape Coral HMA
Community Survey [ACS] 1-year estimates). By comparison, at the national level,
this age cohort grew from 13 percent of the population in 2010 to 16 percent Owner Renter Homeownership Rate
in 2018. The largest decrease was in the portion of the population ages 35 to 350,000 76.5 77.0
64, which declined from 40 percent in 2010 to 36 percent in 2018 in the Cape
76.0
Coral HMA, compared with the national decline from 40 to 38 percent of the 300,000
Homeownership Rate (%)
population during the same period. The median age in the Cape Coral HMA has 75.0
increased from 44.6 in 2010 to 48.8 in 2018, compared with 37.2 in 2010 and 250,000 74.0
Households
38.2 in 2018 for the nation. The rising share of older residents contributed to 200,000 73.0
the decline in net natural change during the current decade. 71.0 72.0
150,000 70.5
Population Forecast 71.0
Population growth is expected to continue at a slower rate during the 3-year 100,000 70.0
forecast period. The low unemployment rate throughout the nation may limit 69.0
50,000
the number of people moving to the HMA for jobs. Net natural change is likely 68.0
to stay negative because of the relatively large share of residents aged 65 0 67.0
and older, further slowing population growth. During the next 3 years, the 2000 2010 Current
population is expected to increase by an average of 16,350, or 2.1 percent, Note: The current date is January 1, 2020.
annually, to 827,300 by the end of the forecast period. Sources: 2000 and 2010—2000 Census and 2010 Census; current—estimates by the analyst
Comprehensive Housing Market Analysis Cape Coral-Fort Myers, Florida
U.S. Department of Housing and Urban Development, Office of Policy Development and ResearchCape Coral-Fort Myers, Florida Comprehensive Housing Market Analysis as of January 1, 2020 Population and Households 10
Household Forecast
Household growth is expected to continue to mirror population growth in the
Cape Coral HMA. Households are expected to grow an average of 6,825, or 2.1
percent, annually—the same percentage growth as population growth. By the
end of the forecast period, 343,200 households are expected to be in the HMA.
Comprehensive Housing Market Analysis Cape Coral-Fort Myers, Florida
U.S. Department of Housing and Urban Development, Office of Policy Development and ResearchCape Coral-Fort Myers, Florida Comprehensive Housing Market Analysis as of January 1, 2020 Home Sales Market 11
Home Sales Market New Home Sales
New home sales, which include new single-family homes, townhomes, and
Market Conditions: Balanced condominiums, have increased since 2013 but remain below the levels of the
The average existing home sales price increased 4 percent early 2000s. Approximately 4,575 new homes sold in the Cape Coral HMA during
during 2019, while the average new home sales price remained 2019, up 9 percent from the 4,200 homes sold during the previous 12 months
relatively unchanged. (CoreLogic, Inc., with adjustments by the analyst). New home sales averaged
12,500 from 2003 through 2006—a period of strong economic growth—but
Current Conditions declined at an average annual rate of 28 percent from 2007 through 2012; sales
then reached a low of 1,825 because of the housing market collapse. From
The sales housing market in the Cape Coral HMA is currently balanced because
2013 through 2018, sales increased as jobs were added to the local economy,
low levels of new home construction, strong job growth, and increased net in-
increasing at an average annual rate of 15 percent. Condominiums have
migration contributed to the absorption of the excess inventory created during
represented a smaller portion of new home sales compared with the mid-2000s.
the construction boom before the Great Recession. As of January 1, 2020, the
In 2006, condominiums composed 31 percent of all new home sales. By 2012,
sales vacancy rate is estimated at 2.2 percent (Table 4), down from 6.6 percent
condominiums had declined to 14 percent of new home sales and continued to
in 2010 when the market was extremely soft. The average home sales price
decline to 6 percent in 2019.
increased during 2019, furthering a 10-year trend; however, total home sales
declined because the inventory of existing homes for sale is slightly low. In Existing Home Sales
December 2019, 4.6 months of supply was available, down from 5.7 months in
After steep declines in the mid-2000s, existing home sales in the Cape Coral
December 2018 (Royal Palm Coast Realtor® Association).
HMA have stabilized in recent years. Existing home sales (including regular resale
and real estate owned [REO] home sales) totaled 25,650 in the HMA during
Table 4. Home Sales Quick Facts in the Cape Coral HMA 2019, down 6 percent from 2018, and REO properties accounted for less than 2
Cape Coral HMA Nation percent of existing home sales (CoreLogic, Inc., with adjustments by the analyst).
Vacancy Rate 2.2% NA Existing home sales peaked from 2003 through 2005, averaging 52,950 a year
Months of Inventory 4.6 3.2 when lending practices were less stringent. During 2006 and 2007, home sales
Total Home Sales 30,250 6,209,000 declined at an average annual rate of 52 percent, to a low of 14,550 in 2007; 2
Home Sales 1-Year Change -4% -3% percent of these were REO properties (Figure 8). Existing homes sales increased
Quick Facts New Home Sales Price $322,100 $386,400
36 percent from 2007 through 2009; however, the portion of homes that were
1-Year Change 0% 2%
Existing Home Sales Price $267,900 $296,400
REO properties increased almost five-fold annually and represented 43 percent
1-Year Change 4% 4% of all existing homes sold in 2009. During the economic expansion that followed,
Mortgage Delinquency Rate 1.0% 1.4% population and household growth began to accelerate. From 2013 through 2018,
NA = data not available. existing home sales increased at an average annual rate of 2 percent and the
Notes: The vacancy rate is as of the current date; home sales and prices are for the 12 months ending
December 2019; and months of inventory and mortgage delinquency data are as of December 2019. The
number of existing sales attributed to REO home sales declined by an average
current date is January 1, 2020. annual rate of 27 percent.
Sources: CoreLogic, Inc.; Metrostudy, A Hanley Wood Company
Comprehensive Housing Market Analysis Cape Coral-Fort Myers, Florida
U.S. Department of Housing and Urban Development, Office of Policy Development and ResearchCape Coral-Fort Myers, Florida Comprehensive Housing Market Analysis as of January 1, 2020 Home Sales Market 12
Figure 8. 12-Month Sales Totals by Type in the Cape Coral HMA Figure 9. 12-Month Average Sales Price by Type of Sale in the Cape Coral HMA
New Home Sales REO Home Sales Resale Home Sales New Home Sales Price REO Sales Price Resale Sales Price
90,000 400,000
80,000 350,000
Average Sales Price ($)
70,000 300,000
60,000
Sales Totals
250,000
50,000
200,000
40,000
150,000
30,000
20,000 100,000
10,000 50,000
0 0
De -00
De 5
De 2
De -06
De 8
De -09
De -03
De -04
De -07
De -01
De -10
De -15
De 2
De -16
De 8
9
De -13
De 4
De -17
De 00
De 06
De 5
De 08
De 09
De 04
De -11
De 02
De 03
De -07
De -01
De 10
De 15
De 16
De 8
9
De 2
De 4
De 13
De 17
De -11
c-0
c-0
c-0
c-1
c-1
c-1
c-1
c-0
c-1
c-1
c-1
c-1
c-
c-
c-
c-
c-
c
c
c
c-
c-
c
c
c
c
c-
c-
c-
c-
c-
c
c
c
c
c
c
c
c
c
De
De
REO = real estate owned. REO = real estate owned.
Source: CoreLogic, Inc., with adjustments by the analyst Source: CoreLogic, Inc., with adjustments by the analyst
Delinquent Mortgages grew, and the average price of a new home increased 5 percent annually from
The impact of the foreclosure crisis was significant in the Cape Coral HMA, 2011 through 2018. The average sales price of a new home was $322,100 during
and the rate of seriously delinquent mortgages peaked in January 2010 at 22.9 2019, relatively unchanged from a year earlier. The average sales price of a
percent, much higher than the national peak of 8.6 percent during the same new condominium was 5 percent higher than the average price of a new home
month. The rate of seriously delinquent mortgages declined rapidly, and as of in 2007, whereas the average sales price of a new condominium was 9 percent
December 2019, the rate of seriously delinquent mortgages was 1.0 percent, lower than the overall price for new homes during 2019. During 2019, sales were
down from 1.4 percent during December 2018. By comparison, the rate for the greatest among new homes priced from $200,000 through $249,000 (Figure 10).
nation was 1.4 percent during December 2019, down from 1.7 percent a year ago.
Existing Home Sales Prices
New Home Sales Prices The average price of an existing home in the Cape Coral HMA increased at
New home sales prices, which include new single-family homes, townhomes, an average annual rate of 20 percent from 2003 through 2007, in the build-
and condominiums, in the HMA have trended upward since 2010. New home up to the foreclosure crisis. When the economy contracted and the volume
prices increased at an average annual rate of 17 percent from 2005 through of lower priced REO home sales increased, the average existing home sales
2007 in the wake of economic expansion. The average new home sales price price declined at an average rate of 21 percent annually from 2008 through
peaked at $355,200 in 2007. The 2007-to-2009 national recession caused new 2010. In 2006 before the widespread foreclosure crisis, REO properties sold
home prices to fall an average of 31 percent a year from 2008 through 2010, to at an average price of $288,000, higher than the overall average price of
a low of $216,000 (Figure 9). As the economy expanded, the demand for homes $261,200 for regular (non-distressed) resale homes. This price indicates that
Comprehensive Housing Market Analysis Cape Coral-Fort Myers, Florida
U.S. Department of Housing and Urban Development, Office of Policy Development and ResearchCape Coral-Fort Myers, Florida Comprehensive Housing Market Analysis as of January 1, 2020 Home Sales Market 13
Figure 10. Share of Sales by Price Range During the 12 Months Figure 11. Average Annual Sales Permitting Activity in the Cape Coral HMA
Ending December 2019 in the Cape Coral HMA
Single-Family Homes/Townhomes Condominiums
Existing Sales New Sales 30,000
50
25,000
40
Share of Sales (%)
20,000
30
15,000
20
10,000
10 5,000
0 0
$0 to $150k to $200k to $250k to $300k to $350k to $400k to $450k to $500k and
00
06
05
08
04
09
02
03
07
01
10
15
16
18
19
12
13
14
17
$149k $199k $249k $299k $349k $399k $449k $499k More
11
20
20
20
20
20
20
20
20
20
20
20
20
20
20
20
20
20
20
20
20
Note: New and existing sales include single-family homes, townhomes, and condominium units. Note: Includes single-family homes, townhomes, and condominiums.
Source: Metrostudy, A Hanley Wood Company Sources: U.S. Census Bureau, Building Permits Survey; 2000 through 2018—final data and estimates by the
analyst; 2019—preliminary data and estimates by the analyst
many foreclosures were higher priced homes that brought up the average sales from 2007 through 2009, when the economy was weak. For-sale home
price. By comparison, in 2010 when foreclosures were flooding the market, the permitting increased an average of 24 percent each year from 2010 through
average sales price of an REO property was $89,450, compared with a regular 2018 as existing inventory had been absorbed and the economy expanded.
resale price of $178,900. The inventory of available REO properties was cleared During 2019, 6,100 homes were permitted in the Cape Coral HMA, a 3-percent
from 2011 through 2018 and the average existing home sales price increased at decline from the 6,300 homes permitted during the previous 12 months
an average annual rate of 8 percent. The average sales price of an existing home (preliminary data, with adjustments by the analyst).
was $267,900 during 2019, up 4 percent from 2018. The largest concentration Recent new home construction, about 7 percent of which were condominiums,
of existing home sales during the past 12 months has been for homes priced has occurred throughout the HMA. The city of Cape Coral, where about one-
below $150,000. third of new single-family homes has been built since 2014, was an early
master-planned community divided into buildable lots, so additions there are
Sales Construction Activity mostly infill of single-family homes that are scattered throughout the city. The
Sales construction activity in the HMA, as measured by the number of homes 1818 Parkway Condominiums community underway in the city of Cape Coral will
permitted, increased from 2010 through 2018, but declined during 2019 and is consist of 52 two- and three-bedroom units, with one-car garages. The price
well below the historically high levels of the early 2000s (Figure 11). An average for a 1,500-square-foot, two-bedroom, two-bathroom unit is $209,900 and a
of 21,550 homes were permitted annually during the boom period from 2004 1,925-square-foot, three-bedroom, two-bathroom unit is $219,900. New homes
through 2006; however, this figure fell to an average of 2,750 homes, annually in the city of Fort Myers have accounted for about 20 percent of all homebuilding
Comprehensive Housing Market Analysis Cape Coral-Fort Myers, Florida
U.S. Department of Housing and Urban Development, Office of Policy Development and ResearchCape Coral-Fort Myers, Florida Comprehensive Housing Market Analysis as of January 1, 2020 Home Sales Market 14
in the HMA since 2014; that homebuilding includes concentrated development sold at Tidewater by Del Webb, an active adult community for those ages 55 and
along Treeline Avenue, east of I-75 near Skyplex Commercial Park and the Alico over in the city of Estero. Those homes range from two- to five-bedrooms, with
Commerce Corridor. Bridgetown is a gated community of single-family homes that two- to four-bathrooms, priced from $287,000 to $445,000.
is currently under construction in this area, with approximately three-fourths of
the planned 1,300 homes either complete or underway. Prices start at $240,990 Housing Affordability—Sales
for a two-bedroom, two-bathroom home and $419,990 for a three- or four- The affordability of owning a home in the Cape Coral HMA has declined overall
bedroom, three- or four-and-one-half-bathroom home, respectively. Marblebrook since the early 2010s. Homeownership is still considered affordable in the HMA,
is a community of villas and single-family homes currently under construction in although affordability has declined because increasing home prices outpaced
the Lehigh Acres area, east of the city of Fort Myers with easy access to I-75 and income growth. The National Association of Home Builders’ (NAHB) Housing
employment centers via state route 82. The community will have 151 villas and Opportunity Index (HOI) for the HMA, which represents the share of homes sold
225 single-family homes on completion of the first phase in 2020. Villas start at that would have been affordable to a family earning the local median income,
$154,990 for a two-bedroom, two-bathroom unit and single-family homes start at was 66.3 during the fourth quarter of 2019, up from 60.3 during the fourth
$194,915 for a three-bedroom, two-bathroom home. Nearly all 385 homes have quarter of 2018 (Figure 12). The HOI peaked at 79.0 during the third quarter of
Figure 12. Cape Coral HMA Housing Opportunity Index
80
75
NAHB Opportunity Index
70
65
60
55
50
12
15
12
12
16
13
14
15
15
16
16
18
19
13
13
14
14
18
18
19
19
17
17
17
12
15
16
13
14
18
19
17
Q2
Q3
Q4
Q2
Q2
Q2
Q3
Q4
Q3
Q4
Q3
Q4
Q2
Q2
Q2
Q3
Q4
Q3
Q4
Q2
Q3
Q4
Q3
Q4
Q1
Q1
Q1
Q1
Q1
Q1
Q1
Q1
NAHB = National Association of Home Builders. Q1 = first quarter. Q2 = second quarter. Q3 = third quarter. Q4 = fourth quarter.
Sources: NAHB; Wells Fargo
Comprehensive Housing Market Analysis Cape Coral-Fort Myers, Florida
U.S. Department of Housing and Urban Development, Office of Policy Development and ResearchCape Coral-Fort Myers, Florida Comprehensive Housing Market Analysis as of January 1, 2020 Home Sales Market 15
2012 because a significant inventory of distressed homes suppressed home homes during the next 3 years, with demand evenly distributed each year of the
prices, but the HOI has since trended downward as existing inventory was forecast (Table 5). The 3,175 homes currently under construction are expected to
absorbed. The HOI hit a low point of 57.6 during the second quarter of 2017 meet a portion of demand during the first year of the forecast.
and has begun to trend upward again as wage growth has been faster than
house price growth. According to the HOI, the HMA was more affordable than Table 5. Demand for New Sales Units in the Cape Coral HMA
148, or 62 percent, of the 238 ranked metropolitan areas in the nation during During the Forecast Period
the fourth quarter of 2019 as compared with 169, or 73 percent, of the 233 ranked Sales Units
metropolitan areas during the second quarter of 2017.
Demand 16,550 Units
Forecast Under Construction 3,175 Units
Based on current and anticipated economic and household growth and sales Note: The forecast period is from January 1, 2020, to January 1, 2023.
market conditions in the Cape Coral HMA, demand is estimated for 16,550 new Source: Estimates by the analyst
Comprehensive Housing Market Analysis Cape Coral-Fort Myers, Florida
U.S. Department of Housing and Urban Development, Office of Policy Development and ResearchCape Coral-Fort Myers, Florida Comprehensive Housing Market Analysis as of January 1, 2020 Rental Market 16
Rental Market Apartment Market Conditions
Market Conditions: Balanced The apartment market in the Cape Coral HMA is also balanced. During the
fourth quarter of 2019, the apartment vacancy rate was 5.0 percent, up from
Increasing rental demand from strong population and job growth has
contributed to rising rents in the Cape Coral HMA since the early 2010s. 4.7 percent a year ago and well below the high point of 12.4 percent during
the fourth quarter of 2009 (RealPage, Inc.). Following the Great Recession,
Rental Market Conditions and Recent Trends limited apartment construction through 2014 allowed for the absorption
The overall rental market in the Cape Coral HMA is currently balanced. As of of excess vacant units and improvement from soft market conditions. Rent
January 1, 2020, the overall rental vacancy rate is estimated at 10.0 percent, growth has been strong since 2014, averaging 7 percent a year from the fourth
down from 17.4 percent in April 2010 (Table 6). Like other HMAs with a large quarter of 2014 through the fourth quarter of 2018. This strong rent growth is
supply of vacation homes, the balanced rental vacancy rate in the Cape Coral because of strong job growth and net in-migration, which increased demand
HMA is higher than in areas of the country with less short-term and vacation for apartments, and the completion of new luxury apartments, which raised
rentals. Although these types of rental units are not considered a part of the average prices. The average apartment rent in the Cape Coral HMA was $1,202
housing supply, they can easily move into the available supply of rental housing during the fourth quarter of 2019, up 3 percent from a year ago, and 58 percent
if the owners decide to rent the properties long-term. higher than the average rent during the fourth quarter of 2012 (Figure 13).
Table 6. Rental and Apartment Market Quick Facts in the Cape Coral HMA Figure 13. Apartment Rents and Vacancy Rates in the Cape Coral HMA
2010 Current Average Monthly Rent Vacancy Rate
(%) (%)
1,250 14
Rental Vacancy Rate 17.4 10.0
1,200 13
Rental Market Occupied Rental Units by Structure
1,150 12
Average Monthly Rent ($)
Quick Facts Single-Family Attached & Detached 41.0 44.0
1,100 11
Vacancy Rate (%)
Multifamily (2–4 Units) 18.0 12.0 10
1,050
Multifamily (5+ Units) 35.0 39.0 9
1,000
Other (Including Mobile Homes) 5.0 4.0 8
950
7
Current YoY Change 900 6
Apartment Vacancy Rate 5.0 0.3 850 5
Apartment 800
Average Rent $1,202 2.7 4
Market Studio $1,131 5.1 750 3
Quick Facts One-Bedroom $1,053 2.6 700 2
Two-Bedroom $1,255 1.8
09
10
4Q 5
4Q 6
4Q 8
19
4Q 2
4Q 4
4Q 3
4Q 7
4Q 1
1
1
1
1
1
1
1
1
20
20
20
20
20
20
20
20
20
20
20
Three-Bedroom $1,419 2.8 4Q
4Q
4Q
YoY= year-over-year.
Notes: The current date is January 1, 2020. Percentages may not add to 100 due to rounding. 4Q = fourth quarter.
Sources: 2010 and 2018 American Community Survey, 1-year data; RealPage, Inc. Source: RealPage, Inc.
Comprehensive Housing Market Analysis Cape Coral-Fort Myers, Florida
U.S. Department of Housing and Urban Development, Office of Policy Development and ResearchCape Coral-Fort Myers, Florida Comprehensive Housing Market Analysis as of January 1, 2020 Rental Market 17
Rental Construction Activity Nearly one-half of the rental units permitted in the Cape Coral HMA since
2014 were in the city of Fort Myers, with many rental options located close to
Multifamily construction, as measured by the number of units permitted, has
employment centers and adjacent to parks and natural features. Amavida, a
trended upward in the past 5 years after almost a decade of limited building
460-unit mixed-use age-restricted community next to Lakes Park opened in
activity. An average of only 290 units were permitted each year from 2006
December 2018 and has restaurants, services, and a clubhouse that doubles
through 2014 because building slowed in the years surrounding the Great as a Category 5 hurricane shelter. Designed to allow aging in place in a luxury
Recession (Figure 14). A decline in apartment vacancy rates caused developers setting, the independent-living, assisted-living, and memory care residences
to increase apartment construction after migration into the Cape Coral HMA range from 500 to 1,700-square feet, with monthly prices, which include
increased, and as a result 2,950 multifamily units were permitted in 2015. An some meals, housekeeping, valet and other services, ranging from $2,500 to
average of 2,350 rental units were permitted annually from 2016 through 2018, $5,500. Apartment construction has been prevalent in the area to the west of
which is slightly below the average of 2,775 units a year from 2000 through 2003. I-75 near the Colonial Boulevard interchange. The Edison, a 327-unit apartment
The average from 2016 through 2018, however, was higher than the average of community, recently began lease-up and is located across from Calusa Nature
1,775 units annually during 2004 and 2005 when less stringent lending standards Center & Planetarium and less than 1 mile from I-75. Rents for the one-bedroom
made homeownership an option for many renters. Based on preliminary data, units currently range from $1,350 to $1,815, two-bedroom units range from
3,325 rental units were permitted in the Cape Coral HMA during 2019, down $1,555 to $1,870, and three-bedroom units range from $1,970 to $2,025. Legacy
slightly from 3,425 units during 2018, the highest annual figure since 2003. Gateway Apartments—which is across from Skyplex Commercial Park, adjacent
to Flag Pond Preserve, and less than 1.5 miles from the Red Sox spring training
fitness center—is currently under construction and is expected to begin leasing
Figure 14. Average Annual Rental Permitting Activity in the Cape Coral HMA in April 2020. The community will include one-bedroom units with rents ranging
from $1,431 to $1,632, two-bedroom units with rents ranging from $1,758 to
3,500
$2,040, and three-bedroom units with rents ranging from $2,090 to $2,260.
3,000
2,500
Housing Affordability: Rental
Although the affordability of owning a home has been declining, rental units
2,000 have remained generally affordable in the HMA. Average income growth for
1,500
renters has kept pace overall with average rental growth in the Cape Coral HMA
since 2010. After a decline from 2008 through 2010, the median gross monthly
1,000 rent in the Cape Coral HMA increased an average of 4 percent, annually, during
500 the subsequent 8 years, to $1,190 in 2018 (ACS 1-year data). From 2011 to 2018,
the median income for renter households in the Cape Coral HMA rose an
0 average of 4 percent a year to $43,347. The HUD Rental Affordability Index,
a measure of median renter household income relative to qualifying income for
00
06
05
08
04
09
02
03
07
01
10
15
16
18
19
12
13
14
17
11
20
20
20
20
20
20
20
20
20
20
20
20
20
20
20
20
20
20
20
20
a median-priced rental unit, has fluctuated with rent and income changes and
Note: Includes apartments and units intended for rental occupancy. was 86.6 during 2018 (the latest data available); this figure is down from 99.3
Sources: U.S. Census Bureau, Building Permits Survey; 2000–2018 final data and estimates by the analyst;
2019 preliminary data and estimates by the analyst in 2017 but above a low of 81.7 in 2010 (Figure 15).
Comprehensive Housing Market Analysis Cape Coral-Fort Myers, Florida
U.S. Department of Housing and Urban Development, Office of Policy Development and ResearchCape Coral-Fort Myers, Florida Comprehensive Housing Market Analysis as of January 1, 2020 Rental Market 18
Figure 15. Cape Coral HMA Rental Affordability Forecast
Gross Rent Change Median Income Change Renter Affordability Index During the 3-year forecast period, demand is expected for an estimated 5,125
market-rate rental units in the Cape Coral HMA (Table 7). Demand for new rental
Median Gross Rent and Income Growth (%)
20 120 units is expected to be relatively constant during the forecast period. The 4,075
HUD Renter Affordability Index
15 units currently under construction will satisfy most of the rental demand in the
100
10 Cape Coral HMA during the next 3 years.
80
5
0 60
Table 7. Demand for New Rental Units in the Cape Coral HMA
-5 During the Forecast Period
40
-10 Rental Units
20
-15
Demand 5,125 Units
-20 0
Under Construction 4,075 Units
05
06
08
09
07
10
15
16
18
12
13
14
17
11
20
20
20
20
20
20
20
20
20
20
20
20
20
20
Note: The forecast period is January 1, 2020, to January 1, 2023.
Source: Estimates by the analyst
Source: American Community Survey, 1-year data
Comprehensive Housing Market Analysis Cape Coral-Fort Myers, Florida
U.S. Department of Housing and Urban Development, Office of Policy Development and ResearchCape Coral-Fort Myers, Florida Comprehensive Housing Market Analysis as of January 1, 2020 Terminology Definitions and Notes 19
Terminology Definitions and Notes
A. Definitions
Building permits do not necessarily reflect all residential building activity that occurs in an HMA. Some units are constructed or created without a building
permit or are issued a different type of building permit. For example, some units classified as commercial structures are not reflected in the residential building
Building Permits
permits. As a result, the analyst, through diligent fieldwork, makes an estimate of this additional construction activity. Some of these estimates are included in
the discussions of single-family and multifamily building permits.
The demand estimates in the analysis are not a forecast of building activity. They are the estimates of the total housing production needed to achieve a
Demand balanced market at the end of the 3-year forecast period given conditions on the as-of date of the analysis, growth, losses, and excess vacancies. The
estimates do not account for units currently under construction or units in the development pipeline.
Distressed Sales Short sales and real estate owned (REO) sales.
Forecast Period 1/1/2020–1/1/2023—Estimates by the analyst.
Home Sales/
Home Sales Includes single-family home, townhome, and condominium sales.
Prices
In this analysis conducted by the U.S. Department of Housing and Urban Development (HUD), other vacant units include all vacant units that are not available
Other Vacant
for sale or for rent. The term therefore includes units rented or sold but not occupied; held for seasonal, recreational, or occasional use; used by migrant
Units
workers; and the category specified as “other” vacant by the U.S. Census Bureau.
Comprehensive Housing Market Analysis Cape Coral-Fort Myers, Florida
U.S. Department of Housing and Urban Development, Office of Policy Development and ResearchCape Coral-Fort Myers, Florida Comprehensive Housing Market Analysis as of January 1, 2020 Terminology Definitions and Notes 20
Rental Market/
Rental Vacancy Includes apartments and other rental units such as single-family, multifamily, and mobile homes.
Rate
Seriously
Delinquent Mortgages 90+ days delinquent or in foreclosure.
Mortgages
B. Notes on Geography
The metropolitan statistical area definition noted in this report is based on the delineations established by the Office of Management and Budget (OMB) in the
1.
OMB Bulletin dated February 28, 2018.
2. Urbanized areas are defined using the U.S. Census Bureau 2010 Census Urban and Rural Classification and the Urban Area Criteria.
3. The census tracts referenced in this report are from the 2010 Census.
C. Additional Notes
The NAHB Housing Opportunity Index represents the share of homes sold in the HMA that would have been affordable to a family earning the local median
1.
income, based on standard mortgage underwriting criteria.
This analysis has been prepared for the assistance and guidance of HUD in its operations. The factual information, findings, and conclusions may also be
2. useful to builders, mortgagees, and others concerned with local housing market conditions and trends. The analysis does not purport to make determinations
regarding the acceptability of any mortgage insurance proposals that may be under consideration by the Department.
Comprehensive Housing Market Analysis Cape Coral-Fort Myers, Florida
U.S. Department of Housing and Urban Development, Office of Policy Development and ResearchCape Coral-Fort Myers, Florida Comprehensive Housing Market Analysis as of January 1, 2020 Terminology Definitions and Notes 21
The factual framework for this analysis follows the guidelines and methods developed by the Economic and Market Analysis Division within HUD. The analysis
and findings are as thorough and current as possible based on information available on the as-of date from local and national sources. As such, findings or
3.
conclusions may be modified by subsequent developments. HUD expresses its appreciation to those industry sources and state and local government officials
who provided data and information on local economic and housing market conditions.
In this analysis conducted by the U.S. Department of Housing and Urban Development (HUD), other vacant units include all vacant units that are not available
4. for sale or for rent. The term therefore includes units rented or sold but not occupied; held for seasonal, recreational, or occasional use; used by migrant
workers; and the category specified as “other” vacant by the Census Bureau.
Cover Photo iStock
Contact Information
Karen M. Ostrye, Economist
Atlanta HUD Regional Office
678–732–2233
karen.m.ostrye@hud.gov
Comprehensive Housing Market Analysis Cape Coral-Fort Myers, Florida
U.S. Department of Housing and Urban Development, Office of Policy Development and ResearchYou can also read