Proposed Richmond Countdown Supermarket - Retail Impact Assessment Prepared for: Progressive Enterprises Ltd - Tasman ...
←
→
Page content transcription
If your browser does not render page correctly, please read the page content below
Proposed Richmond
Countdown Supermarket
Retail Impact Assessment

Prepared for: Progressive Enterprises Ltd

Date: February 2016
Status: Final

Proposed Richmond Countdown
   Supermarket
   Retail Impact Assessment

  Progressive Enterprises Ltd

  Document reference: PEL135.14
  Date of this version: February 2016
  Report author(s): Derek Foy, Douglas Fairgray

  Disclaimer
  Although every effort has been made to ensure accuracy and reliability of the information contained in this report,
  neither Market Economics Limited nor any of its employees shall be held liable for the information, opinions and
  forecasts expressed in this report.

                                                                                              Market Economics Limited
                                                                                                 Level 5, 507 Lake Road
www.me.co.nz                                                                                  PO Box 331 297, Takapuna
                                                                                                     Auckland 0740, NZ
                                                                                                          P 09 915 5510
Contents
1     INTRODUCTION ..................................................................................... 3

1.1   KEY ISSUES .................................................................................................... 3

1.2   OBJECTIVE .................................................................................................... 3

1.3   METHODOLOGY ............................................................................................. 3

2     CURRENT ENVIRONMENT OVERVIEW .................................................... 5

2.1   NELSON-TASMAN GEOGRAPHY .......................................................................... 5

2.2   RETAIL AND SUPERMARKET ACTIVITY ................................................................... 5

2.3   CATCHMENTS ................................................................................................ 7

2.4   HOUSEHOLD PROJECTIONS ................................................................................ 8

2.5   DEMAND PROJECTIONS .................................................................................... 9

3     PERFORMANCE OF PROPOSED STORE .................................................. 11

3.1   THE PROPOSED STORE ................................................................................... 11

3.2   SALES PERFORMANCE .................................................................................... 11

4     IMPACT ASSESSMENT .......................................................................... 13

4.1   IMPACT TYPES .............................................................................................. 13

4.2   DIRECT RETAIL IMPACTS ................................................................................. 13

4.3   INDIRECT CENTRE IMPACTS ............................................................................. 18

5     IMPACTS ON STOKE CENTRE ................................................................ 21

5.1   STOKE SUPERMARKET PERFORMANCE ................................................................ 21

5.2   CUSTOMER ORIGINS AND MARKET SHARE .......................................................... 21

5.3   IMPACT SCENARIOS AND VIABILITY .................................................................... 23

5.4   CONCLUSION RE IMPACTS ON STOKE CENTRE....................................................... 24
6            TASMAN RM PLAN OBJECTIVES ........................................................... 25

6.1         TASMAN RESOURCE MANAGEMENT PLAN OVERVIEW ........................................... 25

6.2         RICHMOND COUNTDOWN............................................................................... 26

7            ECONOMIC AND OTHER BENEFITS ....................................................... 28

7.1         TRAVEL EFFICIENCY AND ACCESSIBILITY .............................................................. 28

7.2         SHORT TERM CONSTRUCTION EFFECTS............................................................... 28

7.3         CONSUMER CHOICE....................................................................................... 28

7.4         EMPLOYMENT EFFECTS .................................................................................. 29

8            CONCLUSION ....................................................................................... 30

Figures
FIGURE 2.1: NELSON-TASMAN RETAIL EMPLOYMENT DISTRIBUTION ............................................................. 6

FIGURE 2.2: NELSON, STOKE AND RICHMOND SUPERMARKET GFA ............................................................... 7

FIGURE 2.3: STUDY AREA CATCHMENTS ................................................................................................... 8

FIGURE 2.4: NELSON-TASMAN HOUSEHOLD PROJECTIONS .......................................................................... 9

FIGURE 2.5: NELSON-TASMAN SUPERMARKET AND GROCERY DEMAND PROJECTIONS ($M) ............................ 10

FIGURE 3.1: RICHMOND COUNTDOWN SALES POTENTIAL (2016)............................................................... 12

FIGURE 4.1: SCENARIO 1 DIRECT RETAIL IMPACTS ON CENTRE SALES (IN 2016) ............................................ 15

FIGURE 4.2: SCENARIO 2 DIRECT RETAIL IMPACTS ON CENTRE SALES (IN 2016) ............................................ 16

FIGURE 4.3: SCENARIO 3 DIRECT RETAIL IMPACTS ON CENTRE SALES (IN 2016) ............................................ 16

FIGURE 5.1: STOKE COUNTDOWN CUSTOMER ORIGINS ............................................................................. 22
1 Introduction
Market Economics Ltd (M.E) has been commissioned by Progressive Enterprises Ltd to assess
the potential economic and retail impacts of a proposed Countdown supermarket at
Richmond, in Tasman District. A draft final version of this report was provided in October 2014,
and has now been updated to take into account recently released Statistics NZ growth
projections and changes in the retail demand and supply environments in the last six months.
1.1 Key Issues
The proposed Countdown store would represent an increase of supermarket supply in Nelson-
Tasman, and therefore change how consumers in the area access supermarket goods. That
change is likely to result in some of the spending that is currently directed to existing
supermarkets in the area being diverted away from those existing stores to instead be directed
to the new Countdown store. This diversion will be likely to result in some decrease in sales of
existing supermarkets, with potential flow-on effects for the retail centres those supermarkets
are in.
1.2 Objective
The specific objectives of this report are to:
Examine current and future demand (to 2031) for supermarket capacity in the study
area (Tasman District and Nelson City).
Determine current supermarket supply in the study area, and identify any likely
changes to that supply that is currently in the pipeline.
Assess the likely direct retail effects of the proposed supermarket on existing retail
centres in the study area.
Assess the likely cumulative direct retail effects of the proposed supermarket and any
other identified new supermarket supply on existing retail centres in the study area.
Consider the likely flow-on, indirect effects of the proposed supermarket that will
occur as a result of the direct retail effects.
Consider other positive and negative economic effects of the proposed supermarket.
1.3 Methodology
This section describes the methodology applied to estimate the direct and indirect retail
impacts of the proposed Countdown Richmond supermarket. The key to the assessment is the
M.E Nelson-Tasman Supermarket Model 2014. That Model analyses consumer demand (in
dollar terms) directed to supermarkets and food and grocery stores in Nelson-Tasman, and is
3built on an understanding of consumer origin-destination patterns. Although the proposed
development is located within Tasman District, it is important to understand that the
development site is close to the boundary with Nelson City, and that any retail and economic
effects created by the Richmond Countdown would be expected to be experienced in both
Nelson City and Tasman District. For that reason, both territorial authorities form the study
area for this assessment.
The Model is calibrated to describe the current demand-supply situation which serves as the
basis to quantify the effect of changes (such as through the creation of new supply in the
market or market growth) to that situation. The Model’s engine identifies $ spending power
from households (according to socio-demography), tourists and businesses, and includes
demand projections based on household (and other growth). Modelled demand projections
take into account projected changes in retail spend per household, actual store sales for
existing Progressive stores and estimated store sales for non-Progressive stores.
To assess the expected retail and economic effects of the proposed supermarket, the key steps
have been:
Quantify market size and growth.
Assess how supermarkets in Tasman and Nelson currently meet consumers’ demand.
Assess how supermarket sales will change from current levels given expected market
growth, assuming no change in the competitive environment (number or size of
supermarkets). This becomes the assessment baseline against the ‘with impacts’
scenarios are compared.
Estimate sales performance of the proposed Richmond Countdown.
Identify any other expected changes in supermarket supply in the study area, and
estimate the sales performance of that increased supply.
Assess changes in the sales of existing supermarkets with the addition of Richmond
Countdown to the Nelson-Tasman supermarket supply environment, to produce
trade competition impact estimates.
Assess the cumulative effects of changes in the sales of existing supermarkets with
the addition of both the Richmond Countdown and any additional new supply to the
Nelson-Tasman supermarket supply environment, to produce trade competition
impact estimates.
Assess the likely flow-on effects of the trade competition impacts, to produce
estimates of the indirect impacts of the proposed supermarket. It is these indirect
impacts that are relevant in RMA terms.
Summarise the implications and significance of these indirect impacts in RMA terms,
considering the distinction between trade competition and effects that are of
importance to urban form and sustainability.
42 Current Environment Overview
This section describes how the supermarket marketplace currently operates in Nelson-Tasman
to place the proposed supermarket in context. The assessment covers the current (2014)
demand situation, and examines future growth projections for household growth and
supermarket demand.
2.1 Nelson-Tasman Geography
The geography of the study area is important because it is a strong determinant on the area’s
retail patterns. Although split across two territorial authorities, the Nelson-Stoke-Richmond
urban area forms one nearly continuous built-up area stretching more than 15km from SH60
in the south to north of Port Nelson in the north. This urban area is relatively narrow, in most
places less than 3km, being constrained by the coastline to the west and hills to the east.
There are three main supermarket locations in this urban area: Nelson’s CBD and the Stoke
and Richmond town centres. These three centres are laid out along a south-west to north-east
alignment following the coastal edge. There are also a number of other smaller retail areas,
ranging from small convenience retail centres to stand-alone retail destinations (such as the
Mitre 10 Mega on Quarantine Rd).
There are two main roads between Richmond and Stoke: SH6 along the coast and Salisbury Rd
less than 200m inland. This configuration is effectively a narrow neck through which all north-
south traffic passes, and will have some influence on the likely catchment of the proposed
Countdown Richmond.
Outside of this Nelson-Stoke-Richmond urban area, the large rural areas and rural towns of
Tasman District are quite broadly spaced, and the towns function as service centres for their
large rural catchments. It is this Nelson-Stoke-Richmond urban area that forms the study area
for this assessment.
2.2 Retail and Supermarket Activity
The Nelson CBD and Richmond and Stoke town centres are the focus for food and grocery
retail in the urban area, and contain a significant quantum of other retail and service activity
as well. Some 88% of Nelson City’s supermarket and grocery employment (702 out of 770
MECs1) is located in either the Nelson CBD (dominated by the four supermarkets) or the Stoke
town centre (a Countdown and a New World), with less than 70 MECs recorded in all other
locations, spread across a large number of small stores (dairies, superettes etc.) (Figure 2.1).
1 Modified Employment Count, a measure of employment that includes all paid employees and all working
proprietors
5That concentration is not so evident in Tasman District because there is a significant
supermarket presence in outlying rural towns, especially Motueka. Within Richmond the two
existing supermarkets (Pak’n Save and Fresh Choice) are both located in the town centre.
Figure 2.1: Nelson-Tasman Retail Employment Distribution
Supermarket
Other Food Total Food Comparison Total Core
and Grocery
and Liquor and Liquor Retail Retail
Stores
Employment (MECs)
Nelson CBD 469 80 549 1,029 1,578
Stoke town centre 233 9 242 35 277
Other Nelson 68 29 97 248 344
Nelson City Total 770 118 887 1,312 2,199
Richmond town centre 383 96 479 655 1,134
Other Tasman 452 95 547 305 852
Tasman District Total 835 191 1,026 960 1,986
Share of TA
Nelson CBD 61% 68% 62% 78% 72%
Stoke town centre 30% 8% 27% 3% 13%
Other Nelson 9% 25% 11% 19% 16%
Nelson City Total 100% 100% 100% 100% 100%
Richmond town centre 46% 50% 47% 68% 57%
Other Tasman 54% 50% 53% 32% 43%
Tasman District Total 100% 100% 100% 100% 100%
The Nelson CBD is the largest centre in Nelson-Tasman and has the broadest range of retail
supply. Nelson CBD’s total core retail employment is nearly 1,600 MECs, of which 1,029 MECs
(65%) are engaged in comparison retail. Stoke’s town centre is dominated by the two
supermarkets, with 84% of its employment supermarket-based, and only 35 comparison retail
MECs.
Richmond’s retail employment is also dominated by the two supermarkets, although 58% of
its 1,134 MECs are engaged in comparison retail across a wide range of storetypes. In total
there are around 100 retail stores located in the Richmond town centre, and a further 41
hospitality businesses (cafes, restaurants and bars). Total core retail employment in Richmond
has increased by 30% since 2011 (260 MECs), including the recent openings of The Warehouse
(July 2014) and K Mart (November 2013). The Richmond centre is well supplied with large
retail anchors, and appears to have low vacancy levels.
The largest supermarkets in the study area are the Richmond Pak’n Save and the Trafalgar
Park (4,240m2) and Nelson (3,620m2) Countdowns. For this assessment the Richmond Pak’n
Save is modelled as being 6,500m2, which is the size we understand it will be by the end of
2015 after the recently started expansion of the store has finished. After that expansion,
nearly half of the total supermarket gross floor area (GFA) in the study area will be located in
the Nelson CBD, 33% in Richmond, and 20% in the two Stoke stores (Figure 2.2).
6Figure 2.2: Nelson, Stoke and Richmond Supermarket GFA
Share of Share of
Supermarket GFA (sqm)
Group GFA Total GFA
Nelson City Fresh Choice 1,500 12% 6%
Trafalgar Park Countdown 4,240 34% 16%
Nelson CIty New World 3,400 28% 13%
Nelson Countdown 3,200 26% 12%
Nelson CBD 12,340 100% 47%
Stoke Countdown 2,700 50% 10%
Stoke New World 2,700 50% 10%
Stoke town centre 5,400 100% 20%
Richmond Pak'n Save 6,500 74% 25%
Richmond Fresh Choice 2,280 26% 9%
Richmond town centre 8,780 100% 33%
Total Nelson, Stoke and Richmond 26,520 100%
2.3 Catchments
The location of the supermarket supply and the topography of the relatively narrow coastal
plain are the key influences on the study area’s supermarket catchments. Because
supermarkets are visited frequently by most consumers, consumers are typically not prepared
to travel large distances to supermarkets, unless they have limited choice available (e.g.
consumers in rural areas). This means that supermarket catchments are highly influenced by
consumers’ proximity to stores, and in Nelson-Tasman means that most Nelson residents do
their supermarket shopping in Nelson, and most Richmond residents shop in Richmond, with
Stoke an intermediate destination serving a smaller market base.
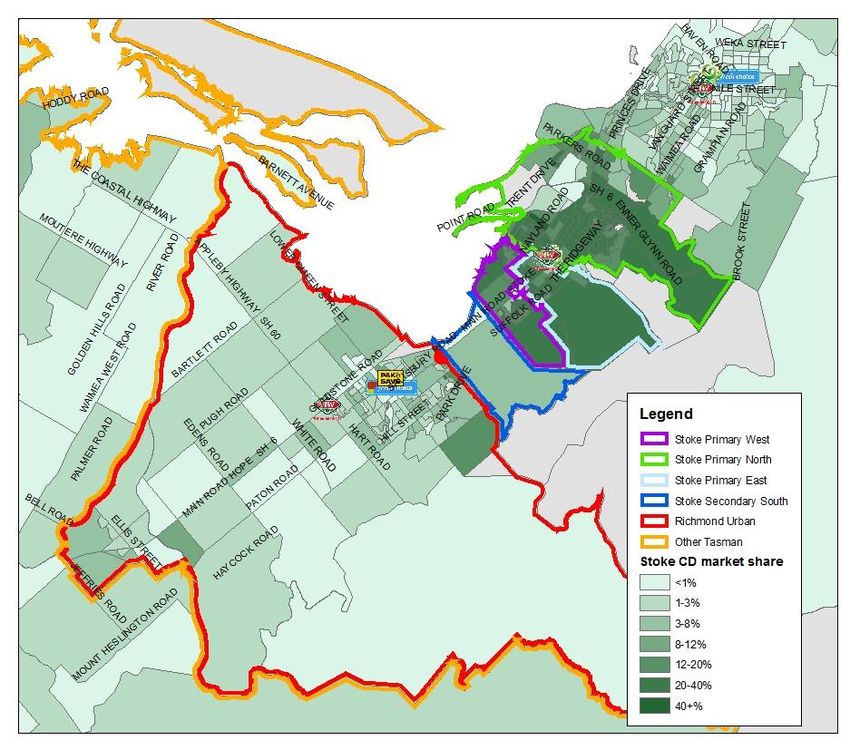
A number of sub-catchments have been defined for the purposes of this study, and these are
then used as the basis for applying market penetration rates into each area. These catchments
are shown in Figure 2.3. The market penetration rates have been calculated based on distance
decay relationships derived from Progressive Onecard data and BNZ Marketview data in a
number of jurisdictions around New Zealand. These data indicate predictable and consistent
distance decay relationships in the supermarket sector. These relationships indicate that the
highest penetration rates are expected to come from the catchments nearest the proposed
store (Richmond central, south, west and south east), and together these sub-catchments
form the Primary catchment of the proposed Countdown.
Lower penetration is expected in other sub-catchments, with the next area out (Stoke south,
Rural south) forming the Secondary catchment. Residents from these areas are most likely to
use the proposed Richmond Countdown as a secondary choice of supermarket, with most of
their supermarket spend directed to stores closer to where they live. The Stoke south sub-
catchment is not expected to form part of the Primary catchment because the relatively small
population resident there are grouped in the northern parts of the sub-catchment, which are
closer to the two Stoke town centre supermarkets.
7Figure 2.3: Study Area Catchments
Some additional custom for the Richmond Countdown would also be expected from
consumers living outside the study area, although only very low shares of the total
supermarket and grocery spend of those consumers would be expected to be directed to the
Richmond Countdown.
2.4 Household Projections
Statistics NZ recently (February 2015) released 2013-base population projections to a local
Council level, which take into account the results of the 2013 Census and the best current
understanding of growth expectations in each Territorial Authority (TA). More geographically
detailed projections will be released near the end of 2015, along with household projections.
We have applied the February TA-level projections for this assessment, and used them to
rebase our household projections, which are the base demographic demand unit in our
assessment. The resulting household projections then apply the TA-level quantum of
household growth (from relationships between population and household numbers) and a
distribution of growth from the most recent sub-TA projections (2012). The projections used
in this assessment are therefore the most up-to-date available.
The main source of customers for the proposed Richmond Countdown will be the Primary
catchment, as described above, which is currently home to nearly 6,900 households (Figure
2.4). The slightly smaller Secondary catchment is home to 5,900 households, predominantly
8located in the rural area to the south of Richmond. These Secondary catchment households
will not direct as much of their spend to the Richmond store as will Primary catchment
households. Together the Primary and Secondary catchments will form the store’s MTA, which
is currently some 12,800 households.
Figure 2.4: Nelson-Tasman Household Projections
Change 2014-31
2014 2016 2021 2026 2031
n % Av an. %
Primary Catchment
Richmond central 2,440 2,470 2,550 2,610 2,670 230 9% 0.5%
Richmond south 2,620 2,670 2,810 2,940 3,070 450 17% 0.9%
Richmond west 1,550 1,630 1,840 2,090 2,330 780 50% 2.4%
Richmond south east 250 260 290 310 340 90 36% 1.8%
Total Primary Catchment 6,860 7,030 7,490 7,950 8,410 1,550 23% 1.2%
Secondary Catchment
Stoke south 1,600 1,680 1,820 1,950 2,050 450 28% 1.5%
Rural south 4,330 4,410 4,650 4,910 5,150 820 19% 1.0%
Total Secondary Catchment 5,930 6,090 6,470 6,860 7,200 1,270 21% 1.1%
Other Nelson-Tasman
Stoke central 5,950 6,110 6,420 6,730 6,970 1,020 17% 0.9%
Nelson 12,370 12,660 13,210 13,660 13,990 1,620 13% 0.7%
Other Tasman 8,060 8,150 8,420 8,670 8,870 810 10% 0.6%
Total Nelson-Tasman 39,170 40,040 42,010 43,870 45,440 6,270 16% 0.9%
Growth in Nelson-Tasman is expected to be slowest in the established urban area, and slightly
faster in the greenfields areas (including Richmond west and south-east and Stoke south).
Household numbers in the Primary catchment are projected to increase by 23% out to 2031
(1,600 households), with similar growth projected for the Secondary catchment, with 1,300
additional households expected there by 2031 (an increase from 5,900 households in 2013 to
7,200 households in 2031). Growth in the rest of the District, which takes in most of Nelson
City including Stoke central and the large rural parts of Tasman District, is projected to be in
the order of 16% to 2031.
2.5 Demand Projections
Projections of supermarket and grocery store spending by study area households show similar
patterns to household projections. Household growth in the Primary catchment is expected
to drive an increase in demand for supermarket and grocery store products of $32m to 2031
(43%) (Figure 2.5). These growth rates take into account historically observed trends for
households to spend more on retail goods over time, which is why the demand projections in
Figure 2.5 exceed the household growth rates in Figure 2.4.
9Figure 2.5: Nelson-Tasman Supermarket and Grocery Demand Projections ($m)
Change 2014-31
2014 2016 2021 2026 2031
n % Av an. %
Primary Catchment
Richmond central $ 27 $ 27 $ 30 $ 32 $ 34 $ 8 28% 1.5%
Richmond south $ 27 $ 28 $ 31 $ 34 $ 37 $ 10 37% 1.9%
Richmond west $ 17 $ 19 $ 22 $ 26 $ 30 $ 13 74% 3.3%
Richmond south east $ 3 $ 3 $ 4 $ 4 $ 5 $ 2 59% 2.8%
Total Primary Catchment $ 74 $ 77 $ 86 $ 95 $ 106 $ 32 43% 2.1%
Secondary Catchment
Stoke south $ 18 $ 20 $ 22 $ 25 $ 27 $ 9 48% 2.3%
Rural south $ 48 $ 49 $ 54 $ 60 $ 66 $ 18 39% 2.0%
Total Secondary Catchment $ 66 $ 69 $ 76 $ 85 $ 93 $ 27 42% 2.1%
Other Nelson-Tasman
Stoke central $ 57 $ 59 $ 65 $ 71 $ 78 $ 21 37% 1.9%
Nelson $ 130 $ 135 $ 148 $ 160 $ 172 $ 42 32% 1.7%
Other Tasman $ 85 $ 87 $ 94 $ 102 $ 109 $ 25 29% 1.5%
Total Nelson-Tasman $ 411 $ 425 $ 469 $ 513 $ 558 $ 147 36% 1.8%
Growth in the Secondary catchment will drive a $27m increase in supermarket and grocery
demand from that area, a 42% increase. Together then the total growth in demand for
supermarket and grocery store space to 2031 from households in the MTA is projected to be
$59m, resulting in 2013 base demand increasing from $140m to reach $199m by 2031.
It is important to remember that not all of the spend resident in these areas would be directed
to a Countdown in Richmond, even if it is the closest store to consumers. The presence of
existing supermarkets and proximity to a wide range of other retail and services in Richmond
will continue to make the Richmond town centre a popular retail destination for supermarket
trips.
103 Performance of Proposed Store
3.1 The Proposed Store
Progressive Enterprises’ proposal is to develop a new Countdown supermarket on a site on
the corner of Salisbury and Champion Roads in Richmond, which is about 11km south of the
Nelson CBD, 4km south of the Stoke town centre and 1.5km north of the Richmond town
centre. The proposed development is called the Richmond Countdown in this assessment. The
store will be 3,200m2 GFA.
In addition to the supermarket, the proposal is to develop 200m2 of non-supermarket retail
space abutting part of the northern wall of the store. Our understanding is that tenants have
not been confirmed for that space yet, but we would anticipate that that amount of space
might be occupied by either one or two small tenancies. From similar tenancies attached to
other supermarket developments we anticipate that retail space might attract businesses such
as prepared food retailers (e.g. a bakery or sushi shop), a small pharmacy, a lotto shop or a
florist.
3.2 Sales Performance
3.2.1 Supermarket Component
To assess the potential sales of the proposed Richmond Countdown, we have used the
catchments described earlier in this report as the base for estimating likely market share
capture of demand across the study area. The capture rates we have assumed are consistent
with what we know about how Countdowns attract consumers (the distance decay
relationship with demand) in various markets around NZ, being highest close by the store and
much lower when there is another store (of any brand) closer to consumers than the new
store is. Capture rates for different parts of a supermarket’s primary catchment can be as high
as 30% close by (within 2km) a supermarket, depending on the competitive environment, ease
of access to other stores and the existence of other types of retail that might keep visitors
from leaving the primary catchment to do their shopping.
We anticipate that the Primary catchment (Richmond) will be the largest source of customers
for the Countdown, and that 21% of supermarket spend resident in this catchment will go to
the store (Figure 3.1). The remaining spend resident in the Primary catchment is expected to
continue to go mostly to the existing supermarkets in the Richmond town centre, and to a
much lesser extent north to Stoke or Nelson.
In total this would mean that 57% of the Richmond Countdown’s sales would be made to
Primary catchment households. The Richmond Countdown would have slightly lower market
shares from the secondary catchment, as many residents in that catchment would be
expected to continue to direct their supermarket spending to the stores in central Richmond
or Stoke.
11Figure 3.1: Richmond Countdown Sales Potential (2016)
Total Richmond CD
Catchment Market Market Origin of
Sales
Demand Share Sales
Primary $ 76.5 21% $ 16.3 57%
Secondary $ 68.4 12% $ 8.4 29%
MTA $ 144.8 17% $ 24.6 86%
Other Nelson-Tasman $ 277.7 0% $ 0.7 3%
Total Nelson-Tasman $ 422.6 6% $ 25.3 88%
All Other Locations n/a $ 3.5 12%
Total All Locations $ 28.8 100%
In total then, on opening (assumed for the purposes of this assessment to be in 2016) some
$16.3m in spending is projected to be directed to the Richmond Countdown from consumers
resident in the Primary catchment, which would equate to 57% of the store’s sales. Sales to
consumers resident in the Secondary catchment would be around $8.4m (29% of store sales),
while sales to all other Nelson-Tasman residents would be around $0.7m.
As with all supermarkets, there would also be expected to be a share of sales made to non-
local consumers, and these are expected to be around 12% of Richmond Countdown sales
($3.5m). This level of spend from all other locations is consistent with how Countdowns tend
to draw their sales, as there is always some proportion of their sales made to non-local
consumers, such as people on holiday or passing by the store on long vehicle trips.
This assessment is therefore based on a very strong focus on the Primary and Secondary
catchments, a fact which is influenced by the geography of the Nelson-Stoke-Richmond
coastal area and the large supermarket presence in the Nelson CBD.
In total, we expect that a Countdown supermarket on the site being investigated would make
sales of around $28.8m in 2016, which is the opening year assumed for the purposes of this
assessment.
3.2.2 Non-Supermarket Component
In addition to the supermarket component of the proposed Richmond Countdown, the
proposal also includes provision for 200m2 of non-supermarket retail space. As outlined
above, that space might yield two tenancies, and sales of around $3,500-5,000/m2, or say
$750,000-$1m in annual turnover, although this is difficult to assess without knowing the type
of tenants that might locate there.
124 Impact Assessment
This section summarises the results of the impact assessment.
4.1 Impact Types
There are two main types of potential effects of the proposed development relevant to this
assessment:
Direct Impacts: These arise when a new store opens and causes a redistribution of
retail spending among existing stores, and a decrease in sales at some existing stores.
Impacts of this type are the effects of trade competition, and cannot be considered
under the RMA.
Indirect Impacts: These arise as the flow-on consequence of direct impacts, and are
relevant under the RMA. As consumer travel patterns change, patronage of the
centres that those stores are in could also change. A decrease in patronage could have
adverse impacts on centres’ amenity, vitality or vibrancy, making them less attractive
places to visit. Indirect impacts may not occur if centre patronage does not change,
such as when trips to a new development are additional to, and not a replacement for
an existing centre visit.
4.2 Direct Retail Impacts
4.2.1 Approach
By applying the expected market shares that the Countdown Richmond will capture from each
catchment to the total demand from that catchment, we have, in section 3.2, estimated the
sales potential of the proposed store. We have then used the Nelson-Tasman Supermarket
Model 2014 to apply the current origin-destination pattern (where people from each part of
the study area spend at supermarkets), to the amount of spend that we expect the Countdown
Richmond to capture from each catchment. That process yields an estimate of the amount of
spend that will be diverted from each existing supermarket, based on the assumption that
spend will be diverted from existing stores pro rata to their draw from each catchment. In our
opinion that is a sound assumption to make, and it is likely to represent the patterns of
diverted spend, and therefore be a robust basis for assessing direct sales impacts.
We have assessed the trade competition impacts on grocery stores and dairies in the MTA in
aggregate. These stores play a much different retail role than supermarkets, having a smaller
range of products, more of a convenience role and a typically very localised customer base.
Further, grocery stores and dairies are much smaller stores than supermarkets, are often
located outside of centres, and tend to be of relatively small importance to the overall amenity
of the centre if they are inside one, given their small size and low customer drawing power.
We note that the Raewards Fresh store (which sells fruit and vegetables and meat) falls into
the “Richmond Grocery stores” category.
13The impacts presented describe the difference in store sales with the Countdown Richmond
in operation in 2016 compared to their expected sales if the Countdown Richmond was not to
open.
4.2.2 Scenarios
Tasman District Council has accepted a private plan change request lodged by Foodstuffs
which would enable a New World supermarket to be constructed at Richmond South. We have
taken this into account in our assessment to show the cumulative effects of both of the
potential new Richmond supermarkets (the Countdown and New World) on the existing
environment. All of the scenarios include the cumulative effects of the proposed Coman
Holdings Ltd development at 149 Salisbury Rd, across Salisbury Rd from the proposed
Countdown site)2, and all assume that the Richmond Pak’n Save (currently undergoing
expansion, scheduled to be completed in 2015) is operating at its new, expanded size.
The Richmond Pak’n Save is therefore part of the existing environment, while the scenarios
describe alternative existing environments, depending on whether the Richmond Countdown
and the Richmond New World open or not. To do this we present three scenarios:
i) The Richmond Countdown opens, but the Richmond South New World does not.
Sales impacts under this scenario are compared against the 2016 sales that would be
expected if neither the Countdown nor the New World were to open.
ii) Both the Richmond South New World and the Richmond Countdown open. Sales
impacts under this scenario are compared against the 2016 sales that would be
expected if neither the Countdown nor the New World were to open. This scenario
shows the cumulative effects on existing stores if both of these new stores were to
open.
iii) As for scenario 2, but compared to a consented baseline in which the Richmond
South New World is operating. The impacts under this scenario are lower, because
impacts by the new New World have already been absorbed into the new (i.e.
including the Richmond South New World) baseline environment.
The Richmond South New World is expected to be 3,800m2 GFA, and from our assessment
would be likely to turnover around $34.2m on opening (again assumed to be 2016) (if the
Richmond Countdown was not then operating). If both the Richmond South New World and
the Richmond Countdown were to open by 2016, their respective sales would be somewhat
lower than the base estimates which assume that only one of the two is open. If both are
open, the New World sales would be around $29.1m, and the Countdown sales would be
$25m.
2 Consented activities include one 200m2 dairy, one specialty retail shop maximum 400m2 GFA, and retailing
activities with a GFA of 500-1800m2 that will principally involve the sale of outdoor sporting equipment and/or
recreational goods with a tourism focus.
144.2.3 Results
Scenario 1: Countdown Richmond Opens, New World Richmond South Doesn’t
If the Countdown Richmond supermarket opens but the Richmond South store does not, the
former is projected to generate $28.8m in sales in its opening year (assumed for this
assessment to be 2016). Our assessment indicates that that level of sales would be expected
to divert around $15.4m in sales away from the Richmond Pak’n Save, $4.0m away from the
Richmond Fresh Choice, and $2.0m away from Richmond’s grocery stores (Figure 4.1).
Based on our understanding of how the supermarkets in these areas attract their customers,
we would expect similar impacts in percentage terms on each store within the same area, so
the two existing Richmond supermarkets would each experience impacts of -18% as a result
of the proposed Countdown opening. If the proposed dairy in the Coman Holdings
development also opens, the cumulative effects of both the dairy and the Countdown would
be slightly (-18%).
Figure 4.1: Scenario 1 Direct Retail Impacts on Centre Sales (in 2016)
Without CD With CD Impact of CD Richmond
Richmond Richmond $m % % incl. dairy
Richmond Pak'n Save $ 89.2 $ 73.7 -$ 15.4 -17% -18%
Richmond Fresh Choice $ 22.9 $ 18.9 -$ 4.0 -17% -18%
Richmond Countdown $ - $ 28.8 $ 28.8 0% 0%
Richmond South New World $ - $ - $ - 0% 0%
Richmond grocery stores $ 11.8 $ 9.8 -$ 2.0 -17% -18%
Stoke Countdown $ 33.7 $ 31.5 -$ 2.2 -6% -7%
Stoke New World $ 23.4 $ 21.9 -$ 1.5 -6% -7%
Stoke grocery stores $ 11.8 $ 11.1 -$ 0.7 -6% -6%
Nelson CBD supermarkets $ 111.5 $ 109.2 -$ 2.3 -2% -2%
Nelson grocery stores $ 10.4 $ 10.3 -$ 0.1 -1% -1%
Grocery stores would be expected to experience sales impacts of a similar magnitude to
impacts on supermarket sales, although grocery store sales are estimated to be much smaller
than those made by supermarkets. The percentage impacts on individual stores’ turnover will
vary depending on their location relative to the proposed store and the role they play within
their catchment. For example, the trade competition impacts on the Raewards Fresh store
across the road from the proposed Countdown would be likely to be higher than on grocery
stores that are further away. Impacts on the stores in Stoke would be lower, at around -6% (or
-7% including the Coman Holdings dairy), which reflects their greater distance from the
proposed store, and the fact that their customer base is less likely to be induced to shop at
the Richmond Countdown. The balance of sales ($0.6m) would come from all other locations
combined.
Scenario 2: Both Countdown and New World Richmond Open, New World in Baseline
If both the Richmond Countdown and South Richmond New World were to open the impacts
on existing centres would be somewhat higher than if only the Countdown opened (the case
in scenario 1). If both stores opened, trade competition impacts on the existing Richmond
15supermarkets and grocery stores would be expected to see sales there around 32% lower than
they would be if neither store opened (or 33% including the cumulative effects of the Coman
Holdings dairy), and impacts on the stores in Stoke would be around 11-12% (Figure 4.2).
Figure 4.2: Scenario 2 Direct Retail Impacts on Centre Sales (in 2016)
Without CD With CD Impact of CD Richmond
and NW and NW
Richmond Richmond $m % % incl. dairy
Richmond Pak'n Save $ 89.2 $ 60.3 -$ 28.8 -32% -33%
Richmond Fresh Choice $ 22.9 $ 15.5 -$ 7.4 -32% -33%
Richmond Countdown $ - $ 25.0 $ 25.0 0% 0%
Richmond South New World $ - $ 29.1 $ 29.1 0% 0%
Richmond grocery stores $ 11.8 $ 7.9 -$ 3.9 -33% -34%
Stoke Countdown $ 33.7 $ 29.7 -$ 4.0 -12% -12%
Stoke New World $ 23.4 $ 20.6 -$ 2.8 -12% -12%
Stoke grocery stores $ 11.8 $ 10.5 -$ 1.3 -11% -11%
Nelson CBD supermarkets $ 111.5 $ 106.9 -$ 4.5 -4% -4%
Nelson grocery stores $ 10.4 $ 10.1 -$ 0.3 -3% -3%
Scenario 3: Both Countdown and New World Richmond Open, New World not in Baseline
This scenario reflects a lower starting level of sales for the existing stores because stores have
already been impacted by the opening of the Richmond South New World. This then reflects
a different baseline compared to the current 2014 actual supply quantum which is applied in
scenario 2, so the impacts summarised in this scenario are lower than those assessed in
scenario 2. Further, the expected sales of the Richmond Countdown would be lower than they
would be in the absence of the Richmond South New World, so the impacts assessed would
also be lower than scenario 1.
Under this scenario 3, the opening of the proposed Richmond South New World would result
in impacts on the Richmond supermarket and grocery stores of -15%, and impacts on the Stoke
stores would be around -5%.
Figure 4.3: Scenario 3 Direct Retail Impacts on Centre Sales (in 2016)
Without CD, With CD Impact of CD Richmond
With NW and NW
Richmond Richmond $m % % incl. dairy
Richmond Pak'n Save $ 70.7 $ 60.3 -$ 10.3 -15% -15%
Richmond Fresh Choice $ 18.1 $ 15.5 -$ 2.7 -15% -15%
Richmond Countdown $ - $ 25.0 $ 25.0 0% 0%
Richmond South New World $ 34.2 $ 29.1 -$ 5.1 -15% -15%
Richmond grocery stores $ 9.3 $ 7.9 -$ 1.4 -15% -15%
Stoke Countdown $ 31.3 $ 29.7 -$ 1.6 -5% -5%
Stoke New World $ 21.7 $ 20.6 -$ 1.1 -5% -5%
Stoke grocery stores $ 10.9 $ 10.5 -$ 0.5 -4% -5%
Nelson CBD supermarkets $ 108.7 $ 106.9 -$ 1.8 -2% -2%
Nelson grocery stores $ 10.1 $ 10.1 -$ 0.1 -1% -1%
164.2.4 Interpretation of Direct Retail Impacts
These impacts are the direct retail impacts, and would be classified as trade competition
impacts under the RMA. In our opinion the impacts assessed would not be significant enough
to result in the closure of any supermarket, given:
Some of the loss in sales by existing stores will be mitigated by market growth
between now and the time the impacts occur (i.e. on opening in 2016). This market
growth effect will equate to around 4% over the course of two years for the Richmond
stores, given population growth and the ongoing increase in average household spend
over time.
The strategic importance of existing supermarkets in contributing to market share for
both Foodstuffs and Progressive.
The Richmond Pak’n Save is the only Pak’n Save in all of Nelson and Tasman and is
currently estimated to be trading strongly and is currently undergoing a significant
expansion.
The low impacts likely for stores outside Richmond.
There are currently a number of dairies and grocery stores in Richmond, including an On the
Spot in Richmond South and the Richmond Bin Inn, and the Raewards Fresh food store
opposite the proposed development. Given the impacts assessed on these stores, we do not
anticipate that any of these stores would close given the convenience role they play for
typically quite localised catchments and pass-by traffic.
4.2.5 Non-Supermarket Retail Component
The non-retail component of the development is 200m2, which as we have discussed in section
3.2.2 might yield $750,000-$1m in annual turnover. The total non-supermarket retail sales of
the Richmond town centre are estimated to be $144m3. If all of the sales made by the non-
retail part of the Richmond Countdown development were diverted away from existing
Richmond town centre businesses, that diversion would equate to direct retail impacts of 0.5-
0.7%.
In reality the actual impacts on the Richmond town centre would be likely to be lower than
that, given not all sales would be diverted from town centre businesses because:
The 200m2 of space might generate some small increase in total Tasman retail
spending by providing new retail supply in a different (convenient) location, and;
Of sales that are diverted away from existing businesses, not all would be expected to
be diverted away from the Richmond town centre.
3From M.E’s Retail Demand and Supply Model 2013, which estimates retail turnover based on retail employment
and regional productivity variations.
17In our opinion even the maximum (0.5-0.7%) level of sales impact on the Richmond town
centre would not be noticeable. Further, we do not expect that one or two small retail stores
opening in this location would create any noticeable impacts on any other retail centre either,
and any impacts would be limited to trade competition impacts.
We note that those impacts would be in addition to any direct retail impacts on the Richmond
town centre that might be created by the consented retail development at 149 Salisbury Rd
(the ‘Coman Holdings development’). That proposed development was consented by TDC in
June 2014, and is proposed to contain one dairy, a specialty shop selling locally produced
goods and up to 1,800m2 of GFA, principally for the sale of outdoor sporting and recreational
goods with a tourism focus. We would anticipate the Coman development to have very low
impacts on the Richmond town centre given the limited class of activities described in the
consent, the small amount of GFA relative to the total town centre GFA and the target market
(“tourism focus” from the consent) of the development.
For these reasons the cumulative effects of this development and the non-supermarket space
in the Countdown development on the Richmond town centre will be only very slightly higher
than the 0.5-0.7% impacts of the non-supermarket space in the Countdown development. In
our opinion even those cumulative effects on the town centre would still not be noticeable.
4.3 Indirect Centre Impacts
4.3.1 Background
Related to the direct (trade competition) effects are the potential flow-on effects on other
types of retail and service activity, and the centres those activities are in. Those effects can
arise where changes in supermarket travel patterns induced by a new supermarket lead to
changes in the other outlets visited in conjunction with the supermarket trip. Those changes
for other outlets, and the centres those outlets are in, are the indirect effects of the new retail
development, and it is these effects that can be relevant under the RMA.
However, for effects to be able to be considered under the RMA, they must go beyond direct
(trade competition) effects and result in a serious decline in the viability of the centre as a
whole, or the loss of employment on a significant scale. By way of indication, although
notwithstanding that each case must be assessed depending on the specific factual context,
indirect (not direct) impacts of as high as 26-31% have not been considered to be significant4.
For these reasons we have not assessed the indirect impacts on the Raewards Fresh store
opposite the proposed development. Raewards Fresh is a stand-alone store that offers very
limited amenity to the community other than providing access to fresh food. Given the
similarity in product offer between it and the proposed Countdown, even if it were to close
the community’s ability to access the goods they sell would not change, and therefore there
would be no indirect effects as a result of the trade competition impacts.
4 Bilimag Holdings v Waipa District Council, 8 June 2008, Whiting J, A72/08, Auckland.
184.3.2 Results
A position seeking to prevent the proposed Countdown Richmond on the grounds of indirect
impacts will therefore only be valid if such a level of decline was likely for any impacted centre.
This report finds that the maximum direct effects on existing supermarkets would be 33% (on
the two Richmond town centre supermarkets) if both the proposed Richmond South New
World and the Countdown open, and the dairy in the Coman development opens. The indirect
impacts would be significantly less than this, as explained below.
The indirect effects would be significantly less than the direct effects on supermarkets because
not all visits to a supermarket include visits to other outlets as well, and people who currently
shop at non-supermarket stores are still likely to visit those centres with the same, or not
much reduced, frequency as they previously have after the Countdown Richmond is open.
The total sales generated within the Richmond town centre (including supermarket sales) are
currently estimated to be around $273m. A decrease in Richmond supermarket sales of
$36.2m ($m impact on Richmond Pak’n Save and Richmond Fresh Choice, assessed under
scenario 2, Figure 4.2) would equate to a decrease in total centre sales of around 13%. It is
possible that non-supermarket spend could also be diverted away from the town centre, but
this is in our opinion unlikely given the very small amount of non-supermarket retail space
proposed for either the Richmond South New World or Richmond Countdown, and the limited
alternative retail destinations in the southern part of the Nelson-Stoke-Richmond area.
This indicates that total Richmond town centre sales might decrease by around 13% if both of
the proposed new Richmond supermarkets and the Coman dairy open. However, not all of
that decrease in sales will translate into a decrease in people activity in the Richmond town
centre, because the Richmond town centre will remain the best way for consumers to meet
most of their retail and service needs, and they will be able to meet only a very small part of
their non-supermarket retail needs at Countdown Richmond, given the proposed 200m2 of
non-supermarket retail space.
From detailed modelling we have undertaken in other studies, the relationship of direct to
indirect impact on centres is usually within the range of 1:0.5-0.75 (i.e. indirect impacts are
50-75% as great as direct impacts). In this case then, a 13% direct impact on the Richmond
centre (decrease in centre sales) might then translate into indirect impacts on the Richmond
town centre of around 7-10%.
A similar concept can be applied to the direct impacts calculated for the next most impacted
supermarkets (in Stoke). The direct impacts on Stoke’s supermarkets are projected to be much
lower (12% under scenario 2) than they are on Richmond’s supermarkets, although the Stoke
town centre is much more dominated by supermarket sales than is the case in Richmond. This
indicates that the indirect impacts on Stoke’s town centre might be closer to the direct impacts
at around 9%.
These impacts on both the Stoke and Richmond town centres fall far short of a level of
significance that means they are able to be considered under the RMA, and the impacts
expected will be limited to a trade competition impact, which is not a relevant consideration
19under the RMA. The magnitude of any indirect effects is expected to be much below a level of
significance due to:
the fact that the impacts will be predominantly spread across four supermarkets in
Stoke and Richmond;
the fact that no existing supermarkets or grocery stores are likely to close as a result
of the proposed Countdown Richmond;
the very small amount of other retail in the proposed Countdown development;
the role of the existing supermarkets alongside a range of other activities in Richmond
(other retail stores, offices, community services etc.);
the current ‘health’ of the Richmond town centre, with seemingly low vacancy rates
and recent developments of new retail supply including The Warehouse, K Mart and
the current expansion of the Pak’n Save supermarket;
the retail dominance of the Richmond town centre within the southern part of the
study area. This role as the preeminent retail destinations in the area insulates the
Richmond town centre to some extent from flow-on effects from the loss of a
relatively small amount of supermarket sales.
For these reasons we do not expect that the proposed development would result in significant
adverse effects on any centre that would go beyond trade competition effects, and there
would be no grounds for seeking to prevent the proposed development due to indirect
impacts on centres in the study area.
205 Impacts on Stoke Centre
An earlier version of this report was peer reviewed by Property Economics Ltd, as a result of
which TDC made a Request for Further Information. The key issue that Property Economics
felt required more detailed assessment was the potential impacts on the Stoke town centre,
and in particular on the two Stoke supermarkets. This section provides that assessment,
including the current performance of Stoke’s two supermarkets, the origin of supermarket
customers, and supermarket market share and viability.
5.1 Stoke Supermarket Performance
Progressive Enterprises provided store sales and customer origin data for its Stoke Countdown
store (one of the two Stoke supermarkets, the other being New World Stoke). We have used
the Progressive data for this assessment of impacts on the Stoke centre. The data provided
shows that the Stoke Countdown is performing strongly, and could withstand a significant
decrease in sales without compromising the viability of the store.
Neither Progressive nor M.E have any definite knowledge of the sales of the Stoke New World,
however it is likely to be performing at a similar level to the Stoke Countdown, given they are
in the same market, nearby each other and almost identical in size. Due to the similarity of the
stores and their likely performance, we would assume that Foodstuffs would have a similar
view of the viability of the Stoke New World to Progressive’s view of the viability of the Stoke
Countdown. That is, it is likely that the Stoke New World could also withstand a significant
decrease in sales without compromising the viability of the store.
5.2 Customer Origins and Market Share
Progressive have provided us with data from their Onecard loyalty card. That data records the
meshblock origin and store destination of Onecard transactions, and is a representative
sample of all customers’ spend at Countdowns.
The Onecard data shows that there is a very well defined catchment for the Stoke Countdown
which is limited to the Stoke urban area, and does not include the rural area between Stoke
and Richmond (see Figure 5.1). The map shows total sales from each meshblock to Stoke
Countdown as a share of total supermarket sales to all locations (i.e. Stoke CD’s market share
by meshblock). Total supermarket sales are estimated from our retail models.
21Figure 5.1: Stoke Countdown Customer Origins
I have defined subcatchments and used Onecard data to look at the share of Stoke Countdown
sales that come from each area. The data shows that:
Sales made to consumers living in the Stoke Primary North catchment are the highest
proportion of sales by a significant margin. Sales to consumers living in this area are
unlikely to be diverted to the new Richmond Countdown because there are already
two Countdowns, and several other brands (including in Nelson), that are closer to
those consumers than the new store will be.
The next largest share of sales are made to consumers living in the Primary East and
West subcatchments (the area of Stoke immediately south of the store). The Stoke
supermarkets will be closer than the new store for these consumers, nevertheless
some of these sales would likely be diverted to the Richmond Countdown.
Only a very small share comes from the rural area between Stoke and Richmond
(‘Stoke Secondary South’).
The Richmond Urban Area, and rural Tasman catchments contribute small proportions
of the store’s sales. The new store will be the closest Countdown for these shoppers,
however there will be three other supermarkets closer for almost all of those
shoppers.
22 A small share also comes from parts of Nelson outside Stoke, and from consumers not
living in Nelson or Tasman. These consumers are unlikely to change their current
shopping patterns if the Richmond Countdown opens.
5.3 Impact Scenarios and Viability
We have used that customer origin data as the basis for modelling to assess the expected
impacts of the proposed Richmond Countdown on the existing Stoke supermarkets. A key
issue for the assessment is establishing the likelihood of one or both of the Stoke supermarkets
closing as a result of trade competition impacts that would be created by the opening of the
proposed Richmond Countdown.
A supermarket store closure would be relevant in RMA terms because it would alter the
functional amenity (access to supermarket supply) for Stoke residents, and therefore go
beyond trade competition. However, we note that if one of the two supermarkets closed and
the other remained open, residents will still have access to broadly the same range of
supermarket goods and so the impact on the Stoke centre’s amenity would not be significant
in RMA terms.
From the Onecard catchments in section 5.2 we have looked at several different scenarios of
the quantum of spend that is currently directed to the Stoke Countdown but which might be
diverted to go to the new Richmond CD.
If 25% of the spend currently coming from the Primary East, West, Richmond Urban and Other
Tasman areas to the Stoke Countdown shifts to the Richmond Countdown, along with 50% of
spend in the Secondary South, impacts on Stoke Countdown would be 9%. I consider this to
be a reasonable representation of what might happen, and again it is similar to the impacts
assessed in section 4.2.2.
Even if twice as much spend is diverted from the Stoke Countdown and New World (requiring
the new store to have a 50% market share across Stoke and Richmond), impacts on those
stores would be 19%, which would not threaten their viability, based on current sales
performance.
From our assessment it is highly unlikely that half of the spend from all of those areas would
be diverted from its current destination to go instead to the new Richmond Countdown, for a
number of reasons:
In a market with multiple supermarkets to choose from, it is very unlikely that any
single store wold obtain a 50% market share of broad areas such as those assessed in
the scenario above.
Existing stores in both Richmond (especially the Pak’n Save) and Stoke are very
popular stores (as shown by the Stoke Countdown’s high $/m2 sales and Pak’n Saves
current store expansion), so a 50% flight to go to a new Countdown is unlikely.
23 More than half of the Stoke catchment is located to the north of the Stoke
supermarkets, and so those shoppers would have to pass by both of the existing Stoke
supermarkets to visit the Richmond Countdown, which is unlikely based on patterns
of supermarket access that are observed around the country. This also applies to the
Richmond catchment and supermarkets.
Most of the customer base of the existing Stoke and Richmond supermarkets will be
closer to the existing stores than to the new Richmond Countdown, which will limit
the number of shoppers that will patronise the new store in preference to existing
ones, given shoppers’ proclivity to visit nearer stores rather than more distant ones.
5.4 Conclusion re Impacts on Stoke Centre
The assessment in this report, is consistent with that in earlier sections, and indicates that the
trade competition impacts on the Stoke supermarkets are likely to be somewhere around 10%.
At this level of direct impacts, there will in our opinion be no noticeable difference on the
amenity of the Stoke centre as a whole.
Supermarket sales at that level will still be healthy, neither supermarket will close, and non-
supermarket retail stores will continue to play a strong convenience role for their local
consumers. Those non-supermarket stores serve predominantly locals, and will remain the
most convenient stores of their type for Stoke residents to visit, whether or not they choose
to shop at the new Countdown. That role will not change because the Stoke catchment is a
very localised one, and the Richmond Countdown will not be replacing that convenience
function, having only 200m2 of retail space. All that means that Stoke’s non-supermarket
stores are likely to be resilient to flow on effects from any changes in supermarket shopping
patterns.
From our understanding there are very few, if any vacancies in Stoke’s retail stores at present.
Overall this all indicates that although Stoke is a small centre with a limited range of retail, it
is in good health and can easily absorb a 10-20% decrease in supermarket sales. That level of
impacts would be far short of any level of significant per RMA case law, and confirms our
conclusions in section 4.
24You can also read