Objective Diamond Clarity Grading - Michael D. Cowing
←
→
Page content transcription
If your browser does not render page correctly, please read the page content below
Feature Article

          Objective Diamond Clarity Grading
                                              Michael D. Cowing

        The diamond clarity grading scale used worldwide today was introduced by
        the Gemological Institute of America (GIA) in 1953. To help address varying
        interpretations and inconsistencies in clarity grading between laboratories
        (and even within some labs), this article introduces an objective system for
        diamond clarity grading. The determination of the clarity grade is influenced
        by up to five factors: size, number, contrast (colour and relief), position and
        nature of the inclusions. The proposed system assesses these factors (with
        emphasis on the first four) by using an objective metric that emulates the
        intuitive analysis done by experienced diamond graders. Using high-quality
        photographs of more than 100 randomly selected diamond examples, this
        article demonstrates a high degree of agreement between clarity grades
        obtained using this system and those determined by GIA and the American
        Gem Society Laboratories (AGSL). The system’s objective methodology may
        offer a means for improving inter- and intra-laboratory grading consistency.

        The Journal of Gemmology, 34(4), 2014, pp. 316–332, http://dx.doi.org/10.15506/JoG.2014.34.4.316
        © 2014 The Gemmological Association of Great Britain

Introduction                                                      (1916) described diamond imperfection with
Diamond grading by gem laboratories,                              terms such as ‘v. v. s., or very very slight’, ‘slightly
gemmologists, and valuers/appraisers consists of                  imperfect’ and ‘imperfect’. GIA’s expansion of
an evaluation of the four diamond characteristics                 clarity grading such terminology was necessary,
of cut, colour, clarity and carat weight. These ‘4                as Liddicoat noted, because “There weren’t a large
Cs’ are the criteria upon which cut and polished                  enough number of grades to fit the market….We
diamonds (e.g. Figure 1) are valued and marketed.                 had to have more” (Shuster, 2003).
    Clarity grading is a judgement of the degree                     GIA’s clarity grading scale, like its diamond
to which a diamond is free of inclusions                          grading system, has become the model for
and imperfections when viewed with the                            laboratories throughout the world. The terminology
10× magnification of a jeweller’s loupe or                        and definitions of this scale are universally used to
gemmological microscope. In April 1953, GIA                       communicate to the gem trade and consumers the
under then-president Richard T. Liddicoat                         purity aspect of diamond quality.
introduced systems for both the colour and                           Today, non-GIA laboratories commonly
clarity grading of diamonds (Shuster, 2003). GIA’s                employ clarity scales and terminology that largely
clarity grading scale expanded upon terms and                     retain the nomenclature and definitions of the
definitions that had evolved through trade usage                  original GIA system, although these systems
over more than a century. For example, Wade                       have evolved and their implementations vary to

316                                                                                          The Journal of Gemmology, 34(4), 2014
Feature Article
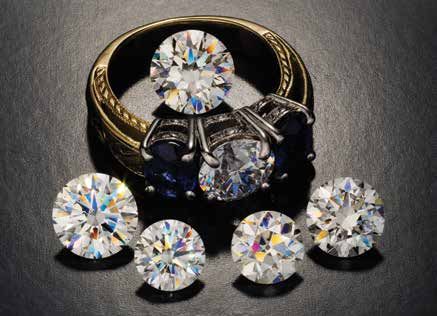
Figure 1: Faceted diamonds such as
these are graded according to the ‘4 Cs’
of cut, colour, clarity and carat weight.
The round brilliants shown here have
clarity grades ranging from VS1 to SI1 and
weigh 1.12–1.83 ct. Photo by M. Cowing.
differing extents from GIA and from one another. such as small extra crown facets, surface graining
This evolution has resulted in inconsistent and certain naturals. They affect determinations
grading from lab to lab and even within labs. between the top two clarity grades of Fl and IF.
Standardized clarity grading remains an elusive Below IF, inclusions are the principal determiners
goal that, due to its subjective nature, many of a diamond’s clarity grade. Surface scratches,
believe is unattainable. which have depth, are graded as inclusions. In
This article introduces a new method of practice, no distinction is made between a shallow
clarity grading that challenges this belief. It is feather and a deep scratch. What counts most is
comprised of objective metrics that are used to inclusion noticeability, which is strongly weighted
model the techniques of expert graders whose toward the face-up view (P. Yantzer, pers. comm.,
proficiency results from extensive experience and 2014). Although inclusions are three-dimensional
practice. Photographic examples that use GIA- in nature, it is their two-dimensional appearance
graded diamonds demonstrate the accuracy and mainly observed face-up that is assessed for
consistency of this system. First, a review of the noticeability.
GIA definitions of each clarity grade will show A diamond’s clarity characteristics are plotted
the subjective nature of existing methodology. using darkfield illumination (side lighting against
Then the new objective system will be introduced a dark background), but the final judgement
and illustrated by various examples from several of clarity is made with the diamond held face-
clarity categories. up using overhead (above-diamond) lighting.
The latter arrangement reveals the noticeability
of inclusions as seen under typical viewing
The Diamond Clarity Grading Scale circumstances.
GIA’s clarity grading scale consists of 11 grades The following clarity grade definitions (GIA,
(Figure 2a): Flawless (Fl), Internally Flawless (IF), 1994; GIA, 2004, 2006) assume a skilled grader
two grades of Very Very Slightly Included (VVS1, working with 10× fully corrected magnification
VVS2), two grades of Very Slightly Included (VS1, (loupe or microscope) and effective illumination
VS2), two grades of Slightly Included (SI1, SI2), (diffused horizontal lighting with a loupe or
and three grades of Included (formerly Imperfect; darkfield illumination with a microscope):
I1, I2, I3).
Diamond imperfections are classified as either • Flawless (Fl): No inclusions or blemishes of
external surface features called blemishes or any kind.
internal features called inclusions (which may also • Internally Flawless (IF): No inclusions and only
extend to the surface). Blemishes include features insignificant blemishes.
Diamond Clarity Grading 317
Feature Article

a

b

c
    Flawless
    VVS1
    VVS2

               VS1     VS2                     SI1                                           SI2

Figure 2: (a) GIA’s clarity grading scale consists of 11 grades, ranging from Flawless to Included (formerly Imperfect). (b)
This early representation of GIA’s clarity scale (GIA, 1969) shows an increase in spacing from higher to lower grades. (c) This
diagram shows the actual increase in spacing (and in inclusion dimensions) of a portion of the grading scale, corresponding to
a doubling in dimensions of grade-setting inclusions from one grade to the next lower grade.

• Very Very Slightly Included: Minute inclusions                  the case for the beginning grader, as it is difficult
  that range from extremely difficult (VVS1) to                   to comprehend what an experienced observer
  very difficult (VVS2) to see.                                   sees as ‘extremely difficult’, ‘very difficult’,
• Very Slightly Included: Minor inclusions that                   ‘difficult’ or ‘somewhat easy’ to locate under
  range from difficult (VS1) to somewhat easy                     10× magnification. In addition, GIA’s diamond
  (VS2) to see.                                                   grading course notes that “It is important to
• Slightly Included: Noticeable inclusions that                   remember...that it is impossible to develop a
  are easy (SI1) or very easy (SI2) to see with                   precise description of any clarity grade except
  10× magnification, but usually are not easily                   flawless….Clarity grading is like appraising a
  noticeable to the unaided eye.                                  painting...: It is the overall picture that sets the
• Included (formerly Imperfect): Obvious                          clarity grade. Clarity grading is as much an art as
  inclusions under 10× magnification that are                     an objective science; becoming really proficient
  easily eye-visible face-up (I1, I2 and I3); for                 at it takes time, experience, and practice” (GIA,
  I3, they severely affect transparency and                       1994, p. 2).
  brightness, and may threaten durability.                            Observations like these may seem daunting.
                                                                  However, GIA does offer this encouragement:
                                                                  “...most people learn to ‘sense’ the grade
Attaining Accuracy and                                            immediately. With a little practice, you will know
                                                                  by a sort of educated gut instinct what grade
Consistency in a Subjective                                       category a stone falls into, almost at first glance”
Clarity Grading System                                            (GIA, 1994, p. 15).
The subjective definitions of the clarity grades                      Developing a ‘sense’ for the clarity grade is
make it challenging to attain accuracy and                        subjective and open to variability in interpretation
consistency with this system. This is particularly                from grader to grader and from lab to lab. How

318                                                                                        The Journal of Gemmology, 34(4), 2014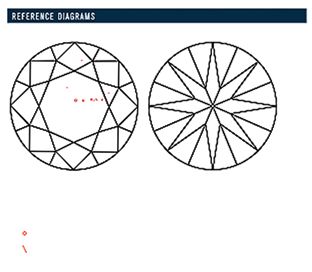
Feature Article

is it possible that experienced graders can most        (in what is called the ‘heart’ of the diamond) are
often agree on a diamond’s clarity grade, at least      most noticeable and are graded most severely.
within a particular lab’s system? The not very          Inclusions touching or near the girdle are least
satisfying answer given in diamond courses is           noticeable and are often graded more leniently.
that consistency is only gained over time, through      Features that are deep enough in the ‘heart’ often
observation of diamonds of all clarities, sizes and     reflect in multiple positions, which may result
shapes with their myriad inclusion variations.          in a lower grade. Early GIA instruction was to
                                                        penalize by one grade an inclusion that had a lot
                                                        of reflections (P. Yantzer, pers. comm., 2014).
Inclusion Characteristics that Impact                       To arrive at a clarity grade, the new objective
Diamond Clarity Grades                                  system evaluates the four clarity characteristics
Determination of the overall impact that inclusions     together, combining them in a manner that
have on the clarity grade is influenced by up           emulates the practice of experienced graders.
to five factors: size, number, contrast (colour         This is done by utilizing aspects of human
and relief), position and nature. “The nature of        perception concerning the noticeability of
a clarity characteristic is based on two general        inclusions. An analysis of early efforts at
distinctions. Whether it is internal or external is     objective clarity grading (discussed below) leads
one: Below IF, the clarity grade is almost always       to two key observations:
set by inclusions; blemishes generally have
little or no effect on it. The second is whether        1. The grade-defining property of inclusion
a particular characteristic poses any risk to the          noticeability is directly related to inclusion
stone. Most do not” (GIA, 1994, p. 12). Below IF,          area. If inclusion ‘grade-makers’ have the same
this most often leaves the combined judgement              area and only differ in their length and width,
of the first four of these factors as the determiner       they are perceived to have similar noticeability
of the clarity grade.                                      and most often will receive the same grade.
     The clarity grade of most diamonds is              2. The increase in inclusion size from one grade
correctly established by assessing the single              to the next is not constant, but approximately
largest inclusion or a small number of similar             follows a doubling of the inclusion’s
major inclusions. Such factors are referred to as          dimensions. That rough dimension doubling,
the ‘grade-makers’. The four main clarity factors          which is a quadrupling in area, is surprisingly
(size, number, contrast and position), judged              consistent from grade to grade across the
together for the largest grade-maker inclusion(s),         entire clarity scale.
most often determine a diamond’s clarity grade.
     A salient feature among the four clarity factors      From Figure 2b it is clear that the range
is size which, along with the degree of contrast        or distances on the GIA clarity grading scale
between the inclusion and the surrounding               between the lower grades is significantly
diamond, determines the visibility of a given           larger than the distances between the higher
inclusion. The larger the inclusion and the greater     grades. However, based on the inclusion size
its contrast, the more it stands out and the lower      factor indicated in the second key observation
the grade. Number comes into consideration              mentioned above, the actual increase in distance
when the largest ‘grade-maker’ inclusions are           from grade to grade is even more pronounced,
more numerous than one. Three or four similar           as shown partially in Figure 2c. Surprisingly,
grade-maker inclusions are likely to lower the          an approximate doubling in dimensions of
clarity one grade more than would a single similar      grade-setting inclusions occurs from grade
feature. Multiple grade-maker–size inclusions are       to grade across the entire scale. Because of
effectively handled in most cases by grading them       this doubling in dimension (and therefore an
the same as an equivalent inclusion with similar        increase in area by about a factor of four), each
total area. Lastly, consideration is given to the       decrease in clarity grade corresponds to a large
position of the grade-maker inclusions within the       multiplicative escalation in inclusion size and
diamond. Viewed face-up, those under the table          noticeability. Figure 3 provides an example of

Diamond Clarity Grading                                                                                319
Feature Article
Figure 3: Illustrating the relative increase in inclusion size Figure 4: This 1.11 ct diamond (6.66–6.63 × 4.11 mm)
from grade to grade are these seven inclusions that have contains four SI1-size inclusions that have different
been digitally inserted in a 1.11 ct diamond (6.66–6.63 dimensions, but the same area and contrast, and thus
× 4.11 mm). The inclusions are sized according to clarity similar noticeability. Each has an area determined to be
grades that range from VVS1 to I1. approximately 35,000 µm2.
Figure 5: This 0.70 ct diamond (5.74–5.71 × 3.52 mm) Figure 6: The same 0.70 ct diamond as in Figure 5 is shown
contains four VS2-size inclusions between the 10 and 11 here containing four VS1-size inclusions at 5 o’clock inside
o’clock positions near the table edge. All of these inclusions the table. Each one has one-quarter the area of the VS2-
have the same area and noticeability, despite their varying size inclusion seen at 10 o’clock. Taken together, the VS1
dimensions. inclusions would receive one lower grade of VS2.
this increase in inclusion size from clarities of In Figure 4, four SI1-size inclusions in a 1.11 ct
VVS1 to I1.* To provide visual support for the diamond have different dimensions but nearly
two key observations listed above, carefully identical area and contrast, and therefore each
sized inclusions also have been inserted into the one has similar noticeability. Individually, each
darkfield diamond images in Figures 4–6. inclusion would be graded identically as SI1
because each has the same area (roughly 35,000
µm2) and the same contrast (relief).
* Unless otherwise noted, all of the diamond images from In Figure 5, the four inclusions between
Figure 3 onward were taken by Jonathan Weingarten and the 10 and 11 o’clock positions in the 0.70 ct
are scaled to show 10× magnification. The original colour
diamond are the ‘crystals’ in Figure 4 reduced to
photographs were converted by the author to black-and-
white images after it was determined that the colours half their dimensions and a quarter of their area
resulting from diamond’s high dispersion distracted from (8,800 µm2). This reduces their noticeability and
finding and judging the noticeability of inclusions. improves the clarity by one grade to VS2 when
320 The Journal of Gemmology, 34(4), 2014Feature Article Figure 7: This 1.11 ct SI2-graded diamond (6.66–6.63 × 4.11 Figure 8: Contrast the stone in Figure 7 with this 1.05 ct mm) contains a white crystal and a string of five smaller diamond (6.57–6.59 × 4.03 mm), which received the same dark-appearing inclusions, for a combined clarity grade of SI2 clarity grade despite having a much larger reflecting high SI2. crystal inclusion. they are considered individually. Again, despite the same factor. For example, an inclusion in their differing dimensions, all four inclusions are a low-borderline SI2 can be almost twice the individually graded the same because each has dimensions (and about four times the area) of the same area and amount of contrast. All four a high borderline SI2 of similar nature. Compare together have the same area as the single SI1 the large differences in size and noticeability inclusion seen at the 2 o’clock position in Figure between the identically GIA-graded (SI2) ~1 ct 5. Thus, with similar overall area and impact on diamonds in Figures 7 and 8. The SI2 in Figure noticeability, four VS2-size grade-maker inclusions 7 should bring a large premium over the SI2 in evaluated together most often receive the same Figure 8, but price guides and the market in clarity grade as a single SI1 grade-maker. general currently value them the same. Shouldn’t Reducing those four crystals by another a clarity grading system account for what should factor of two in dimension (and factor of four be a significant value difference between these in area) results in the group of four tiny crystals two widely different clarity appearances? The that are seen at the 5 o’clock position in the current scale lacks sufficient definition for the 0.70 ct diamond in Figure 6. Individually each market in the grades of SI2 and below. These two of these inclusions is graded VS1. Evaluated identically graded SI2 diamonds bring to mind together as a group, they have similar total Liddicoat’s statement “There weren’t a large area and noticeability as the VS2 inclusion at enough number of grades to fit the market.... the 10 o’clock position in Figure 6. Therefore We had to have more.” collectively these inclusions would receive one With more lower-clarity diamonds entering the clarity grade lower (VS2) than when they are market, the relatively large range of SI2 and the considered individually. much greater range of I1 created market demand An additional example is provided by this for an intermediate grade for stones containing diamond’s original string of three VS1-size crystals inclusions with a combined area that is close to under the crown main facet at 10 o’clock in both I1 but that have too good an appearance to be Figures 5 and 6. Considered together, GIA graded lumped together with typical I1 diamonds. That these inclusions VS2. need prompted the introduction of an SI3 grade Since for each successive grade a particular in 1992, initially by Tom Tashey, then owner of inclusion type increases in dimension by about a EGL Los Angeles (T. Tashey, pers. comm., 2014). factor of two, the range of inclusion dimensions However, attempts to meet this market need within each successive grade also increases by have largely been frustrated by misuse. The lack Diamond Clarity Grading 321
Feature Article

Figure 9: An identical VS2-size crystal inclusion is shown in these diamond images that have been rescaled to the equivalent
of 1/3, 1 and 6 ct. The inclusion has similar noticeability in all three images, and would result in the same grade over this large
range of diamond sizes.

of objective grading standards has led to wide                      well, an inclusion in a large diamond may be less
discrepancies and an increase in inclusion sizes                    noticeable and for that reason may be graded less
that are assigned SI3 grades. In fact, diamonds                     severely. In general, the system presented here
graded SI3 often extend well into the GIA I1                        has been found to be accurate independent of
grade. (Note that although many in the diamond                      diamond size over roughly the range of round
trade and some laboratories have adopted the SI3                    diamond diameters from 4.5 mm (1/3 ct) to 11.8
designation, it is not recognized by GIA.)                          mm (6 ct). This is particularly the case for clarities
                                                                    ranging from VVS1 to VS2, as well as most SI1
                                                                    diamonds. To illustrate this, the image of a VS2-size
The Relationship of Inclusion                                       inclusion in a 1.00 ct diamond was copied and
Size to Diamond Size                                                pasted into the same location in two images of
Thus far absolute inclusion size has been addressed,                the same diamond scaled to 1/3 ct and 6 ct (Figure
but not inclusion dimension relative to diamond                     9). The inclusion in all three diamonds is seen to
size. In very small diamonds, inclusions that                       be of the same category: a ‘minor inclusion that is
occupy a significant percentage of the diamond’s                    somewhat easy to see under 10× magnification’,
dimensions may be graded more severely. As                          corresponding to VS2 over this range of sizes.

322                                                                                            The Journal of Gemmology, 34(4), 2014
Feature Article
area.) If the inclusion is rectangular, the area
measurement is exact. Irregular or circular features
have slightly less area than the product of length
and width, but with a little ingenuity they are
adequately characterized by this technique. For
instance, a tapering inclusion’s area is accurately
approximated by adding the Porton circle number
for its length to that for its average width.
In DGL’s system, the total area score, which
was obtained in this manner for each significant
inclusion, was converted to a ‘primary point
count’ (Burr et al., 1981) that was then adjusted
for ‘brightness’ (the equivalent of contrast or
relief) and ‘its position in the stone’ to arrive at
a final point count establishing the clarity grade.
Contributions by Kazumi Okuda
Okuda incorporated his version of the circle
Figure 10: The Porton graticule consists of circle diameters graticule into his diamond grading microscope.
—
increasing by the factor √2 . Drawing by M. Cowing. Having been introduced to DGL’s system by
Roy Huddlestone (R. Huddlestone, pers. comm.,
Previous Objective Clarity 2014), he used a circle graticule to measure
Grading Systems inclusion area in a manner similar to DGL. An
In the 1970s, there were two notable attempts to important difference is that Okuda’s circles
–
reduce the subjectivity of diamond clarity grading increased in diameter not by the factor √2 but by
through objective measurements of inclusion a factor of 2. Table I shows Okuda’s conversion
size combined with refinements in the factors of from micrometre measurement to his circle
inclusion contrast, number, and location within numbers. As seen in an excerpt of the instruction
the stone. manual (Figure 11), a representation of inclusion
area is obtained by adding the circle numbers
Contributions by Roy Huddlestone and that just enclose the inclusion’s length and width.
DGL, London Okuda’s most important contribution to
Huddlestone introduced at the Diamond Grading objective clarity grading was his clarity conversion
Laboratories (DGL) the use of a Porton graticule table (Figure 12), which converts the area score to
to measure diamond inclusions. As mentioned by a clarity grade. For cases in which no adjustment
Bruton (1978), this graticule, a version of which is is needed for contrast or position, such as a grade-
shown in Figure 10, consists of circles numbered
0 to 9 that increase in diameter by the factor Table I: Okuda’s conversion from micrometres to circle number.
–
√2 (a doubling in area). By fitting an inclusion’s Size (μm) Circle number
length and width to the nearest Porton circles 10 1
that just enclose each dimension, a measure of 20 2
inclusion size in Porton numbers is obtained. This 40 3
transformation from dimensions to circle numbers 80 4
is a useful and ultimately instructive process. An
160 5
approximate representation of an inclusion’s area
320 6
(multiplication of length by width) is obtained by
640 7
simply adding the corresponding circle numbers
for its length and width. (Addition in the ‘Porton 1,280 8
domain’ equates to multiplication of length 2,560 9
times width, yielding a measure of an inclusion’s 5,120 10
Diamond Clarity Grading 323Feature Article
maker crystal or feather inclusions of medium
contrast located under the diamond’s table,
the clarity grade is obtained directly from the
conversion table using the area score obtained
from the sum of the circle numbers for length
and width. However, Okuda’s grading system
had two shortcomings:
1. It lacked an adjustment for variations in
inclusion contrast.
2. Although there was an adjustment for
position, it was applied to the area score as
a multiplicative factor. As will be seen, this
adjustment must be applied additively in the
circle number domain in order to mirror GIA
grading practice correctly in a uniform fashion
throughout the clarity scale.
The New Clarity Grading System
The first step in the new clarity grading system
Figure 11: This excerpt from Okuda (1978) illustrates how
is to measure the inclusion dimensions using
a measure of inclusion area is obtained by the addition of
circle numbers corresponding to their length and width.
32× to 45× microscope magnification, employing
either a vernier caliper or a reticule capable of
approximately ±10 µm accuracy. The author
Figure 12: The Okuda clarity conversion table shown here recommends today’s version of the 6-inch Mitutoyo
converts the area score obtained from the sum of the circle Digimatic digital calipers that he has employed for
numbers for length and width to a clarity grade. From Okuda over 30 years. The ±10 µm accuracy suffices for
(1978).
typical inclusion sizes of VS1 and larger. VVS1- and
VVS2-size inclusions are more easily and accurately
measured (using the same digital calipers) from an
enlarged photograph.
With insights from the transformation from
inclusion dimensions to Porton circle numbers
and Okuda’s clarity table, the author has
developed a new continuous grading scale
consisting of a graph with a curve increasing
–
with a √2 relationship; it will be included in the
author’s upcoming ebook (Cowing, in press).
The graph is used to provide a transformation
of inclusion dimensions to the exponential
domain. The sum of the transformed length and
width provides an inclusion area score like that
obtained using the discrete circles of the Porton
graticule. However, the advantage of using this
graph over the discrete circles is its continuous
nature. It does not require the nonlinear
interpolation necessary when measuring an
inclusion’s length or width that falls between
circle sizes.
324 The Journal of Gemmology, 34(4), 2014Feature Article
Table II. Adjustment guidelines due to inclusion contrast.
Scale 1 2 3 4 5
Description Low-contrast Inclusion with Typical contrast A more solid white High contrast with
inclusion difficult contrast in of a clear or white or darker than overhead lighting,
to observe with between a cloud crystal or feather usual crystal or either black on a
overhead lighting; and typical crystals as seen with feather between light background or a
a ‘cloud’ is a good and feathers overhead lighting typical and high bright reflector on a
example contrast dark background
Adjustment −2e to −4e −1e to −2e No adjustment +0.5e to +1e (one- +1e to +2e
to clarity (one to two grades (one-half to one quarter to one-half (one-half to one
grade higher) grade higher) grade lower) grade lower)
Adjustments to the Area Score due to adjustments (Table II). Any adjustment is applied
Inclusion Number, Contrast and Position additively in the exponential domain. A one-
After finding the starting clarity grade from the grade-lower clarity adjustment corresponds to
combined total inclusion area score of the grade- an addition of +2e (the ‘e’ notation refers to an
maker inclusions, adjustments are made according exponential scale).
to inclusion number, contrast and position. Needing no adjustment is a medium-
contrast crystal or white feather, which would
Number: Instances where there are a number of be designated a 3 on the contrast scale. A very
similar grade-maker–size inclusions are effectively high contrast inclusion is 5 on the scale, and
handled by summing them to the approximate most often requires an adjustment of one grade
dimensions of a similar inclusion having the same downward (i.e. a +2e adjustment). For example,
total area. This commonly results in an adjustment a black crystal that obviously stands out against
of one grade lower when there are multiple (i.e. the surrounding diamond with overhead lighting
about four) similar grade-maker–size inclusions would receive a +2e adjustment to the clarity
(four times the area of one of them). Note that grade. In the other direction, a very low contrast
near-borderline inclusion sizes may drop into inclusion that barely stands out, such as a cloud,
the next lower grade with as few as two grade- is designated a 1 on the contrast scale and adjusts
maker–size inclusions. the initial clarity grade upward by 1–2 grades
(a –2e to –4e change). Inclusions requiring
Contrast: As taught by GIA, inclusion contrast, intermediate adjustments (i.e. designated 2 or 4
which is referred to as ‘colour and relief’, on the contrast scale) may not change the clarity
“can affect visibility as much as size….Relief grade if the diamond falls near the middle of a
is the contrast between the inclusion and the particular grade. However, a borderline grade
[surrounding field of the] stone; the greater the will probably change.
relief, the more it will affect the clarity grade”
(GIA, 1994, p. 12). Position: Adjustments for position are based on
To address the influence of contrast or relief observation of GIA practice and are described in
on the clarity grade, the new system employs a Table III. No adjustment is needed for the easiest-
simple 1-to-5 scale along with their corresponding to-locate inclusions under the table or just outside
Table III. Adjustment guidelines due to inclusion position.
Position Inside table or VS2 size or VS2 size or SI1 size, near or SI2 or larger,
just outside it smaller, touching smaller, near touching girdle anywhere in
or very near girdle diamond
girdle
Adjustment No adjustment −1e to −2e (one- −0.5e to −1e −0.5e to −1e (one- No adjustment
to clarity half to one grade (one-quarter to quarter to one-half
grade higher) one-half grade grade higher in a
higher) large diamond)
Diamond Clarity Grading 325Feature Article
microscope; diamond traders more commonly
use a fluorescent desk lamp.
Objective Clarity Grading Example
Figure 13 provides an example of a single grade-
maker crystal inclusion of medium contrast (3 on
the contrast scale) located under the table:
1. Measure inclusion length and width (in
microns): 90 × 42 µm.
2. Convert length and width from microns to the
exponential domain (see Table I): 4.2e + 3.1e.
3. Sum the exponent numbers to obtain the
inclusion area score: 7.3e.
Figure 13: This 1.20 ct VS1-graded diamond (6.83–6.85 ×
4.17 mm) contains a crystal inclusion measuring 90 × 42
4. Make adjustments for contrast and position: In
µm (under the table at 9 o’clock), which corresponds to a this case there are none, since the inclusion
clarity grade of VS1 using the new system. has typical contrast (3) and its position is
under the table.
5. Look up the total adjusted clarity grade for
it. An adjustment is made for as much as a one
7.3e (see, e.g., Figure 12): VS1.
grade upward (−1e to −2e) for VS2 and smaller
inclusions that touch the girdle or are just inside it.
A position adjustment of one-quarter to one-half Comparison with Clarity Grades
grade upward may apply to inclusions outside
the table but not very near the girdle. This would
Determined by Gem Laboratories
only change the clarity grade in borderline cases. To evaluate numerous laboratory-graded
Larger inclusions (SI2 and greater) are unlikely to diamonds in conjunction with this study, it
be adjusted for position because of their obvious was expedient to experiment with grading of
nature anywhere in the diamond from girdle to inclusions using high-quality photographs.
table. Without the actual diamonds in hand, the question
was: Can inclusions, their sizes and their contrast/
Final Grading Call Considerations relief be measured and adequately judged from
It is important to point out that these inclusion diamond photographs? With good photographs
measurements and judgements are all made from where the grade-maker inclusions are in
a face-up two-dimensional perspective. However, focus, the answer is yes. An initial experiment
if a grade-maker inclusion extends deeper into involved grading the diamonds photographed
the stone than the dimensions of its face-up in Roskin (1994). From the darkfield diamond
measurement (so that it appears significantly images in that book, a vernier caliper was used
larger when viewed from the side), consideration to measure the dimensions of each diamond’s
must be given to lowering the grade obtained grade-maker inclusions along with the stone’s
by face-up observation. In most instances, such dimensions. The actual inclusion dimensions
an adjustment is not more than one grade lower were then obtained by scaling according to the
than the face-up call. ratio of actual diamond diameter divided by
It is also important to note that the final clarity the diamond image diameter. Objective grading
grade is made by observation of the overall using inclusion measurements from the images
inclusion visibility in the face-up position under resulted in near-perfect agreement with the
overhead lighting (not darkfield illumination). stated clarity grades of all the diamonds pictured
This is usually accomplished in the laboratory by in the book.
viewing the diamond with a 10× loupe under the The majority of images in the author’s database,
small 7-inch fluorescent-tube light attached to the and all of those used in this article, were obtained
326 The Journal of Gemmology, 34(4), 2014Feature Article
darkfield and overhead lighting) and then graded
with this new system.
The following examples were selected to
show the application of the new system to GIA-
graded diamonds with a range of clarities.
VVS1 Example
The VVS1 clarity grade is defined by the presence
of minute inclusions that are extremely difficult
to see with 10× magnification. The question
of when an inclusion becomes visible to the
experienced observer at 10× magnification is
important, as it defines the boundary between
Figure 14: This 0.92 ct VVS1-graded diamond (6.22–6.23 × Fl or IF and VVS1. According to Bruton (1978),
3.85 mm) contains a VVS2-size pinpoint. The position of this a possible example of such an inclusion is a
inclusion near the girdle at 6 o’clock calls for a half-grade white pinpoint of approximately 5 µm that
adjustment, making the clarity grade a low VVS1.
appears bright with very high contrast against
a dark background. However, if the pinpoint
from the website for the diamond and jewellery has medium contrast, then the threshold of 10×
retailer Good Old Gold (www.goodoldgold. visibility doubles to 10 µm. This inclusion area
com), which lists the company’s diamond of 10 × 10 µm corresponds to a clarity score of
inventory, commonly with corresponding 1e + 1e = 2e, which is the boundary between IF
grading reports from GIA or AGSL. Also available (0e–1.999e) and VVS1 (2.0e–3.999e).
are darkfield images pointing out the grade- The 0.92 ct diamond in Figure 14 has a single
maker inclusions, and for some diamonds there pinpoint at 6 o’clock near the girdle under
are images taken with overhead lighting. Owner a crown half. The inclusion has a diameter of
Jonathan Weingarten graciously granted the 24 µm for a clarity score of 2.3e + 2.3e = 4.6e,
author access to this ready-made database. The corresponding to an initial grade of VVS2. The
inclusion dimensions and other noticeability pinpoint’s position outside the table near the
factors were measured and judged from the girdle calls for a half-grade adjustment of 4.6e –
available darkfield and overhead lighting images 1e = 3.6e, for a final clarity grade of a low VVS1.
in a manner similar to that employed for ‘grading’
Roskin’s (1994) diamond images. The clarity VVS2 Example
grades obtained with the new objective system The VVS2 clarity grade is defined by the presence
were compared to laboratory-determined grades of minute inclusions that are very difficult to
for more than 100 randomly selected diamonds see with 10× magnification. Earlier it was stated
in Good Old Gold’s inventory, over a range of that a number of grade-maker–size inclusions
sizes from 1/3 to 6 ct and clarities from VVS1 to are effectively handled by grading them as an
I2. The grades obtained with the new system equivalent inclusion with similar total area. The
accurately reflected laboratory grading in over presence of about four similar grade-maker
90% of the examples. ‘Solid’ clarity grades (those inclusions is likely to lower the clarity one grade
in the middle half of a grade range) almost always more than would a single similar feature by
matched those determined by the laboratory. In itself. An evaluation of the 1.55 ct VVS2-graded
fact, the author has been employing this objective diamond in Figure 15a provides a practical
system’s methodology since the early 1980s, and example illustrating both principles. The stone
has found throughout this time period a close contains five pinpoints (see plot in Figure 15b),
agreement with the clarity grading calls of both but the largest and only one visible at 10×
GIA and AGSL. The author continues to augment magnification measures 23 × 21 µm = 2.1 + 2.1e
the current database with GIA-graded diamonds = 4.2e, which corresponds to a high borderline
he has examined and photographed (both with VVS2. Two of the additional pinpoints (visible in
Diamond Clarity Grading 327Feature Article
a
b
Key to Symbols
Pinpoint
c
Figure 15: (a) This 1.55 ct VVS2-graded diamond (7.46–7.42
× 4.58 mm) provides an example where multiple VVS1-size
pinpoints result in a one-grade-lower clarity of VVS2. The plot
from its GIA report (b) shows the location of all the pinpoints,
and some of them are visible in the enlarged photo
(c, magnified 20×).
Figure 15c) are each 18 × 18 µm = 1.9 + 1.9e = with the two additional tiny VVS1 pinpoints that
3.8e (low VVS1 pinpoints individually) and the are not visible in the photos, the group has the
other two are even smaller. An inclusion having equivalent noticeability of four low-VVS1 grade-
the combined total area of all five pinpoints makers, bringing the call down one grade from a
would be approximately 70 × 20 µm = 3.8e + low VVS1 to a low VVS2.
2.0e = 5.8e, which would have a final clarity
grade of low VVS2. VS2 Examples
There is an additional way to arrive at the The VS2 clarity grade is defined by the presence
clarity grade for this example. The three pinpoints of minor inclusions that are somewhat easy to
mentioned above are low-VVS1 in size, and along see with 10× magnification. The 0.90 ct VS2-
a b
Figure 16: A 0.90 ct VS2-graded diamond (6.26–6.24 × 3.76 mm) containing an arrowhead-shaped feather located at 7 o’clock
is shown with darkfield illumination (a) and overhead lighting (b). This example illustrates how inclusions typically appear less
distinct with overhead lighting (where the final clarity grade call is made) than with darkfield.
328 The Journal of Gemmology, 34(4), 2014Feature Article
a Figure 17: (a) This large VS2-graded
diamond (5.70 ct, 11.48–11.53 ×
7.13 mm) contains a string of five
tiny crystals that taken together
have the combined area of a
VS2. The plot from its GIA report
(b) shows the location of all the
inclusions, most of which are
visible in the enlarged photo (c,
magnified 20×).
b c
Key to Symbols
Crystal
Needle
graded round brilliant in Figure 16 contains an × 65 µm = 5.2e + 3.8e = 9e, which corresponds
arrowhead-shaped feather of medium contrast to an initial call of a solid VS2. An adjustment
(3) located under a crown main facet at 7 o’clock. is needed due to the feather’s location near the
The two images of Figure 16 illustrate the fact girdle; about –0.7e is appropriate, making the
that with overhead illumination (where the final final score 8.3e, and the clarity grade a high VS2.
clarity grade call is made), inclusions of medium The 5.70 ct VS2-graded round brilliant in
contrast are typically less distinct than they are with Figure 17 contains a string of five tiny crystals
darkfield. This is because darkfield illumination under the table around 3 o’clock. Together they
is designed to illuminate inclusions by making add up to an equivalent inclusion size of 167 ×
them appear bright against a dark background. 83 µm that translates to 5.2e + 4.1e = 9.3e, for a
The feather has approximate dimensions of 162 clarity grade of VS2.
Diamond Clarity Grading 329Feature Article
a b
Figure 18: This 1.70 ct SI1-graded diamond (6.82–6.78 × c
4.74 mm) contains a low SI1-size crystal/cloud combination
with low contrast that adjusts the clarity grade to a solid
SI1. It is shown with darkfield illumination (a) and overhead
lighting (b), along with a plot of the inclusions from its GIA
report (c).
SI1 Example
The SI1 clarity grade is defined by the presence of
noticeable inclusions that are easy to see with 10×
magnification, but usually not easily noticeable to
Key to Symbols
the unaided eye. The 1.70 ct SI1-graded diamond
Cloud
in Figure 18 contains a grade-maker inclusion Crystal
group consisting of a crystal/cloud combination Needle
under the table at about 3 o’clock. The group
of inclusions is of low contrast (2) and has a are not apparent with darkfield illumination but
combined area equivalent to 649 × 130 µm, which are noticeable with overhead lighting (numerous
translates to 7.1e + 4.6e = 11.7e. After a half- feather reflections located outside the table). It
grade adjustment (–1e) for the low contrast of the is challenging to speculate from the photo how
inclusions, the score is 10.7e, which corresponds apparent these reflections were to the grader.
to a clarity grade of SI1. They appear to warrant an adjustment of one-
half to one full grade downward (+1e to +2e),
SI2 Example yielding a score of 13.2e to 14.2e, corresponding
The SI2 clarity grade is defined by the presence to a low SI2 bordering on a high I1. The SI2 clarity
of noticeable inclusions that are very easy to see grade received at the laboratory was probably
with 10× magnification, but typically not easily due to the fact that these additional features are
noticeable to the unaided eye. The 0.74 ct SI2- reflections that were not very noticeable.
graded diamond in Figure 19 contains a grade-
maker cluster of low-contrast (2) feathers extending I1 Example
deep under the table. Summing the area of each The I clarity grades are defined by the presence
feather yields an approximate inclusion area of of obvious inclusions with 10× magnification
685 × 372 µm = 7e + 6.2e = 13.2e, corresponding that are eye-visible face-up. The 1.01 ct I1-graded
to a middle SI2. An adjustment of one-half grade cushion brilliant cut in Figure 20 contains a large
upward (–1e) for the low inclusion contrast yields grade-maker inclusion under the table edge at
a clarity score of 12.2e. However, this diamond 7 o’clock that shows moderately high relief (4)
provides an unusual case of having features that with overhead illumination. The approximate
330 The Journal of Gemmology, 34(4), 2014Feature Article
a b
Figure 19: Shown with darkfield illumination (a) and overhead lighting (b), this 0.74 ct SI2-graded diamond (5.80–5.82 × 3.60
mm) has a grade-maker cluster of feathers with a combined area that sums to SI2 size. An adjustment for their low contrast is
more than offset by the fact that they reflect outside the table. With overhead illumination the reflections outside the table are
apparent, leading to a low-borderline SI2 clarity grade.
a b
Figure 20: Shown with darkfield illumination (a) and overhead lighting (b), this 1.01 ct I1-graded diamond (5.85–5.89 × 3.85
mm) contains a large I1-size inclusion. The high contrast seen with overhead lighting adjusts the grade downward to a low I1.
a b
Figure 21: This 0.35 ct I2-graded diamond (4.55–4.54 × 2.78 mm) contains a large I1-size fracture that is best seen with
darkfield illumination (a). Viewed with overhead lighting (b), a reflection of the fracture causes a doubling of its apparent area,
which combined with the relatively small size of the diamond leads to a solid I2 clarity grade.
dimensions are 1026 × 545 µm = 7.7e + 6.8e = I2 Example
14.5e, for a clarity grade of high-medium I1. After The 0.35 ct I2-graded round brilliant in Figure
adjusting one-half grade downward (+1e) for the 21 contains a large fracture that is best seen and
moderately high contrast, the final score is 15.5e, measured using darkfield illumination. It is 1165
corresponding to a low I1. × 757 µm = 7.8e + 7.3e = 15.1e, for an initial
Diamond Clarity Grading 331Feature Article
clarity grade of middle I1. When the stone is GIA, 1969. Diamond Grading Assignment 20.
examined with overhead lighting, the reflection Gemological Institute of America, cover page.
of this fracture requires an adjustment of one- GIA, 1994. Diamond Grading Assignment 4.
Gemological Institute of America.
half to one grade downward (+1e to +2e), for a GIA, 2004, 2006. Diamond Grading Lab Manual.
score of 16.1e to 17.1e, corresponding to a high- Gemological Institute of America, pp. 109–120.
to-middle I2. In addition, since the inclusion’s Okuda K., 1978. Okuda Diamond Grading Microscope
appearance constitutes a significant percentage Reference Manual. Okuda Jewelry Technical Institute
of this rather small diamond, the +2e adjustment Co. Ltd., New York, New York, USA, 16 pp.
is appropriate for a final grade of a solid I2. Roskin G., 1994. Photo Masters for Diamond Grading.
Gemworld International Inc., Northbrook, Illinois,
USA, 94 pp.
Shuster W.G., 2003. Legacy of Leadership. Gemological
Conclusions Institute of America, Carlsbad, California, USA, p.
This article introduces a new objective form of 121.
clarity grading based on metrics that model the Wade F.B., 1916. Diamonds—A Study of the Factors
that Govern Their Value. G. P. Putnam’s Sons,
techniques of experienced graders. The system
New York, New York, USA, 150 pp.
emulates the analysis performed by these graders,
who assess the combined factors of inclusion
characteristics (size, number, contrast, position The Author
and nature) to arrive at the clarity grade. Michael D. Cowing, FGA
A small sampling of grading examples are AGA Certified Gem Laboratory
discussed here that compare the results obtained 1035 St. Stephens Church Rd.
from this new system to photographs of GIA-graded Crownsville, Maryland 21032 USA
diamonds. They were selected from more than 100 Email: michaelgem@gmail.com
recently documented photographic examples that
support the success of this system in matching Acknowledgements
clarity grades obtained by gem laboratories. The author is grateful to Jonathan Weingarten
A particularly notable outcome of this study is of Good Old Gold (Massapequa Park, New
the approximate but consistent four times increase York, USA) for supplying the raw diamond
in inclusion area from grade to grade across photographs in this article. He is grateful to the
the entire GIA clarity scale. This multiplicative following individuals for discussions and review:
relationship resulted from the natural evolution • Peter Yantzer, executive director of the
and expansion of the clarity grades and terms AGSL in Las Vegas, Nevada, USA, and
used in the diamond trade well before GIA’s former director of GIA’s diamond grading
formalization of the grading scale. It speaks to laboratory in Santa Monica, California,
human perception of the relative noticeability of USA, concerning aspects of GIA and AGSL
diamond inclusions. clarity grading.
With the success of this objective system in • Phil Yantzer, vice president of laboratory
matching GIA grading, its accuracy and consistency services at GIA in Carlsbad, concerning
suggests the possibility of its use for improving aspects of GIA clarity grading.
inter- and intra-laboratory grading consistency. • Gary Roskin, former GIA assistant lab
director in Santa Monica, concerning
aspects of GIA clarity grading.
References • Roy Huddlestone, former director of DGL
Bruton E., 1978. Diamonds. N.A.G. Press Ltd., in London, concerning aspects of DGL’s
London, p. 517. clarity grading system.
Burr K.F., Brightman R.F., Chandler R. and
• Thomas Tashey, owner of Professional
Huddlestone R.V., 1981. The D.G.L. Clarity
Grading System for Polished Diamonds. Diamond Gem Sciences Laboratory in Chicago,
Grading Laboratories Ltd., London, 81 pp. Illinois, USA, concerning aspects of GIA
Cowing M.D., in press. Grading Diamond Clarity clarity grading and the SI3 grade.
Objectively. To be self-published.
332 The Journal of Gemmology, 34(4), 2014You can also read