DEX NG - www.datataker.com - A complete guide to
←
→
Page content transcription
If your browser does not render page correctly, please read the page content below
Intelligent Data Logging Products
dEX NG
A complete guide to:
Program creation
Chart display
Data download
Multi loggers
www.datataker.com
© 2017 ThermoFisher Scientific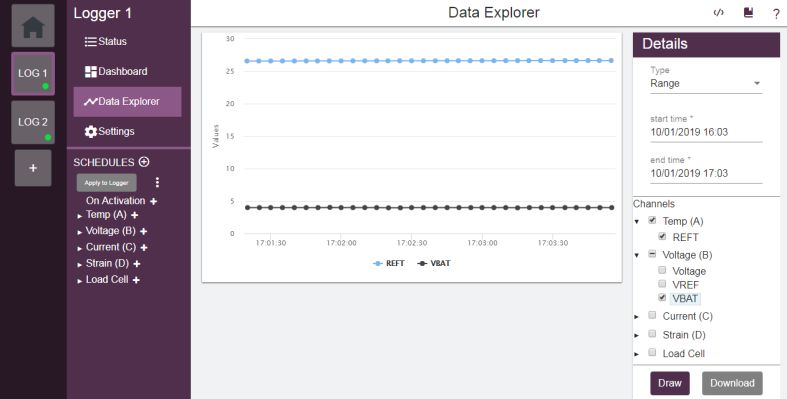
Contents

Part A. dEX Application ......................................................................4
             Overview........................................................................................................................................... 4
             dEX NG vs dEX ................................................................................................................................ 4
             Installation ........................................................................................................................................ 5

Part B. dEX NG Pages ........................................................................6
             Page Structure .................................................................................................................................. 6

      Home Page ....................................................................................................... 6
             Overview........................................................................................................................................... 6
             Information........................................................................................................................................ 7
             Dashboard ........................................................................................................................................ 7
             Data Explorer .................................................................................................................................... 8
             Preferences ...................................................................................................................................... 8
             Adding New Logger .......................................................................................................................... 8

      Logger Page(s) ................................................................................................. 9
             Overview........................................................................................................................................... 9
             Status ............................................................................................................................................... 9
             Dashboard ........................................................................................................................................ 9
             Data Explorer .................................................................................................................................... 9
             Settings........................................................................................................................................... 10
             Job Builder...................................................................................................................................... 14
             Extra Menu ..................................................................................................................................... 15

      Template Page ............................................................................................... 16
             Overview......................................................................................................................................... 16
             Status ............................................................................................................................................. 16
             Settings........................................................................................................................................... 17
             Job Builder...................................................................................................................................... 17

      Top Menu ........................................................................................................ 18
             Application ...................................................................................................................................... 18
             Edit ................................................................................................................................................. 18
             Development .................................................................................................................................. 18

Part C. Data Monitoring ....................................................................19
      Dashboard ...................................................................................................... 19
             Overview......................................................................................................................................... 19

      Data Explorer ................................................................................................. 21
             Overview......................................................................................................................................... 21
             Sections of the Page....................................................................................................................... 21

Part D. Job Builder............................................................................25
      Overview ......................................................................................................... 25
             Program Tree View ......................................................................................................................... 25
             Properties Pane .............................................................................................................................. 26

      Schedules ....................................................................................................... 28
             General Options ............................................................................................................................. 29
             Advanced Options .......................................................................................................................... 29

UM-dEX-001EN                                                      dEX User Manual                                                                    P a g e |2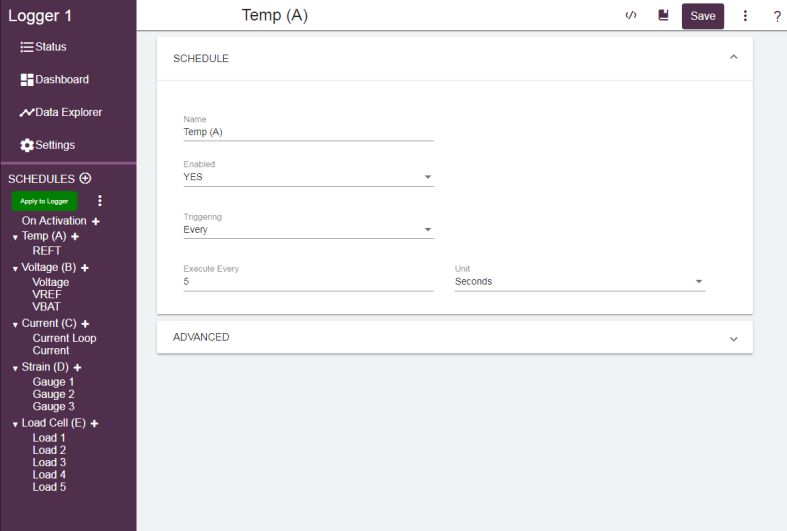
Managing Schedules ...................................................................................................................... 30

     Channels......................................................................................................... 30
            Overview......................................................................................................................................... 30
            Analog ............................................................................................................................................ 30
            Digital.............................................................................................................................................. 31
            Action.............................................................................................................................................. 31
            Serial .............................................................................................................................................. 32
            Others ............................................................................................................................................. 32

UM-dEX-001EN                                                     dEX User Manual                                                                    P a g e |3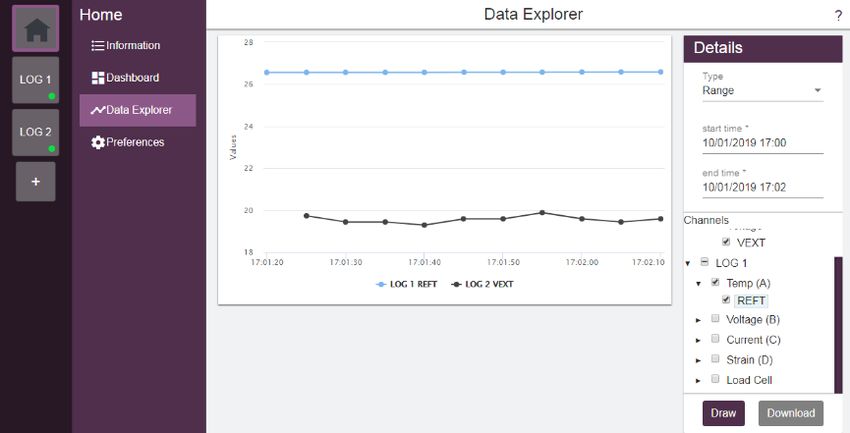
Part A. dEX Application
Overview
  Currently there are 3 version of dEX:

 dEX Web Interface
  The DT80 provides an embedded web interface (dEX) that provides simple, intuitive access to the logger’s
  operations using a standard web browser. You can view current sensor readings, job status and access data and
  other files stored in the file system.
  The standard web interface is built into the logger’s firmware. It does not need to be installed on the logger or on
  your PC. Simply use your existing browser to browse to the logger’s IP address and the home page will be
  displayed.
  This application rely on flash player script and due to a constant changes of flash player version this application
  may lose compatibility and behave unexpectedly.
  Notes: dEX version 1.85.030 is covered in this manual

 dEX for desktop
  dEX for desktop is a small modification of dEX Web Interface which move the platform from dataTaker to a PC.
  The core script is still using flash player in which client will need to install Adobe Air Application in order to run
  dEX.
  With the rise of dEX NG, we can leave dEX for desktop for good. The last release version is 4.16

 dEX NG
  dEX NG is the next development of dataTaker programming interface, it maintain visual programming interface
  which give easiness for the user with a lot of improvement on template and data display. This dEX NG is built on
  PC platform to minimise processor usage with low payload on data request. Furthermore the absent of flash
  player core give the client freedom to run this application without compatibility risk as before.
  Programming template have been expanded further to cover flexible channels such as SERIAL, MODBUS and
  SDI12. There are also new templates for calculation and alarm setup which can be used to create complex
  conditional statement. With this improvement, client is expected to minimise their access to manual channel
  which also reduce the difficulty to program dataTaker.
  Notes: dEX NG version 0.1.37 is covered in this manual

dEX NG vs dEX
  The original dEX still remain as part of dataTaker firmware, dEX NG will serve as an addition to the existing dEX.
  The following table summarises between two dEX applications:

  Feature                                                                                   dEX NG               dEX
  Embedded to firmware                                                                         -                  yes
  Running via web browser                                                                      -                  yes
  Display basic logger information (serial number, firmware version etc.)                     yes                 yes
  Graphically configure the logger                                                            yes                 yes
  Display selected channels in a configurable single value displays                           yes                 yes
  Unload data and save to CSV file                                                            yes                 yes
  Text command window (similar to DeTransfer)                                                 yes                 yes
  Display current job's program text                                                          yes                 yes
  Display TEST, EVENT and SERVICE logs                                                        yes                 yes
  Display user manual, release notes, etc.                                                    yes                 yes
  Display full data charts                                                                    yes                  -
  Display scatter charts                                                                      yes                  -
  Multi logger display                                                                        yes                  -
  Program template creation                                                                   yes                  -

  UM-dEX-001EN                                            dEX User Manual                                      P a g e |4
Mobile phone compatible                                               yes      -
   Installation to PC                                                    yes      -
   Low payload – better to handle mimic on fast sampling                 yes      -
   Flash free                                                            yes      -

Installation
  dEX NG installation file can be downloaded from this link:

 System Requirement
  dEX NG requires Windows operating system.

  UM-dEX-001EN                                         dEX User Manual         P a g e |5
Part B. dEX NG Pages
Page Structure
dEX NG has a single display page with 3 segments:
The left part is Home/ Logger Segment.
It has the tab selection between Home page and Logger page(s). See Home Page (P6) and Logger
Page(s) (P9) for more details.
The middle part is Menu Segment.
Menu selection will be available after making selection of the first part.
The right part is Display Segment.
It has the biggest portion of the page which will show
1 2 3
Figure 1: Page Structure (1 – Home/ Logger Segment; 2 – Menu Segment; 3 – Display Segment)
At the top of Display Segment, there are a couple of additional menu (Function Menu) depending on selection of
Menu Segment. And at the very top, there are Application Menu.
1
2
Figure 2: Menu (1 – Application Menu; 2 – Function Menu)
Home Page
Overview
dEX NG Home Page serves as data viewer from several connected logger also serve as general setting to dEX
NG application. Users will be able to make comparison between data from different loggers.
Because this page serve as general viewer for data from all connected logger, it is not possible to make
personalised changes to each logger.
UM-dEX-001EN dEX User Manual P a g e |6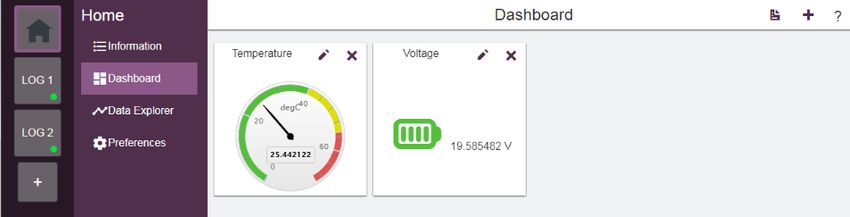
Information
This menu is currently unused.
Figure 3: Information Pane
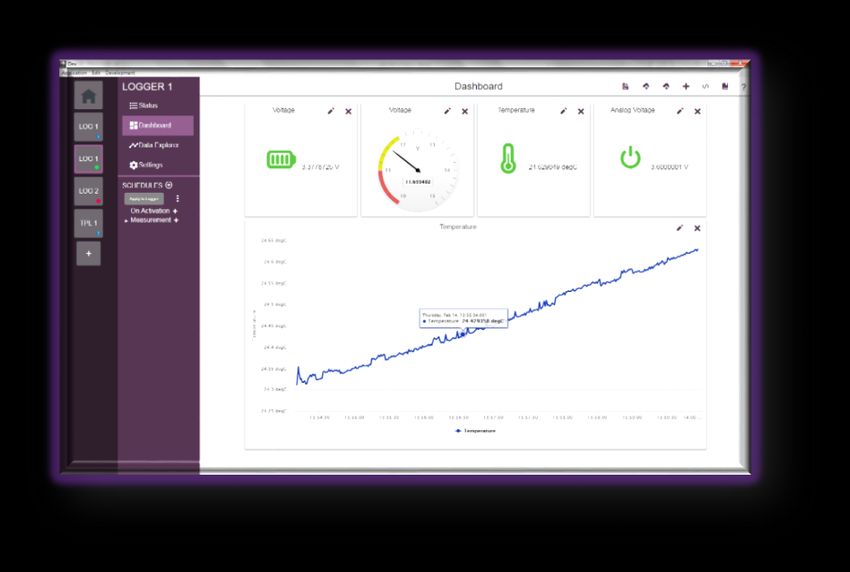
Dashboard
Dashboard within Home Page is used to display data from different loggers on Widgets (previous named as
mimics and charts) in one page. The data will get updated at designed refresh rate.
1 2 3
Figure 4: Dashboard Pane (1 – Save Dashboard; 2 – Add Widget; 3 – Help)
The ability to show data from different loggers will enhance data comparison capability especially when dealing
with several loggers in the network.
Figure 5: Channel Selection from 2 Loggers
Notes: In order to make data comparison from several loggers, please make sure all related loggers are online (can be seen by
green indicator on Logger Tab).
See Dashboard (P19) for more details.
UM-dEX-001EN dEX User Manual P a g e |7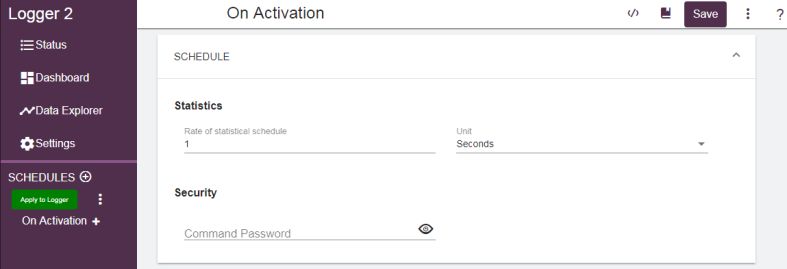
Data Explorer
Data Explorer menu will give access to historical data. And within Home Page, users can access historical data
from different loggers either showing them in chart or download them. Please see Data Explorer (P21) for
detailed information.
Figure 6: Data Explorer from Multiple Loggers (LOG 1 and LOG 2)
Preferences
Preference will give you access for changing dEX language setting, at this moment there are 2 language
available English and Portuguese.
Adding New Logger
The plus sign under Home symbol will open a new window on the right with the following entry:
Device Status will allow users to have direct connection to the logger (online) or start offline
configuration. Offline configuration will generate template.
Template will allow users to apply particular template to online connection of a logger.
Logger Model Selection will allow the users to select particular model for offline configuration.
Logger Name will set the name of the logger
Short Name will set the short name of the logger. This short name will appear at Home/ Logger segment.
IP Address/ Hostname is the location of the logger in a network. This option will appear when having
online connection to the logger.
Port is the connecting port, normally we will use port 80 unless users want to define other port. This
option will appear when having online connection to the logger.
Figure 7: Adding New Logger
UM-dEX-001EN dEX User Manual P a g e |8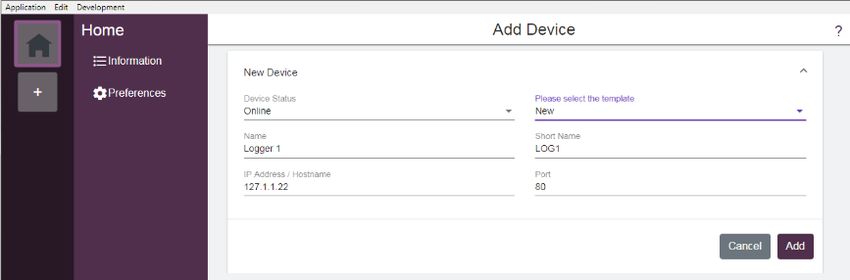
Logger Page(s)
Overview
Logger Page give access to the selected logger either viewing the historical data, displaying data as Widgets,
programming the logger or simply changing logger PROFILE settings.
It may also show the content of particular template which was previously created.
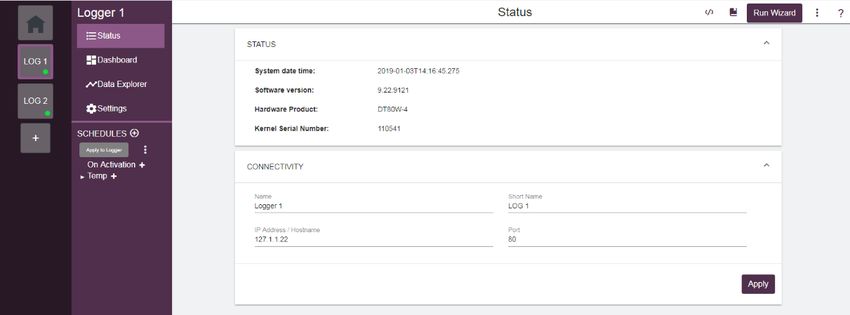
Status
Status provides information about the selected logger. There are 2 tabs within Status:
Status
In this category users may see short information of the logger: date and time when the logger is connected to
dEX NG, firmware version in the unit, dataTaker model and serial number.
Notes: Date and time information will not get updated overtime.
Connectivity
In this category, logger connection related settings are displayed and could be updated if the logger settings have
changed.
Name: Name displayed in the Menu segment of display page.
Short Name: Name displayed in the Home/Logger segment of display page.
IP Address: The IP address of the logger to connect to.
Port: The assigned TCP/IP port configured to the logger.
Dashboard
Dashboard menu will display current measurement on selected logger presented as widget/ mimics/ charts.
Please see Dashboard (P19) for detailed information.
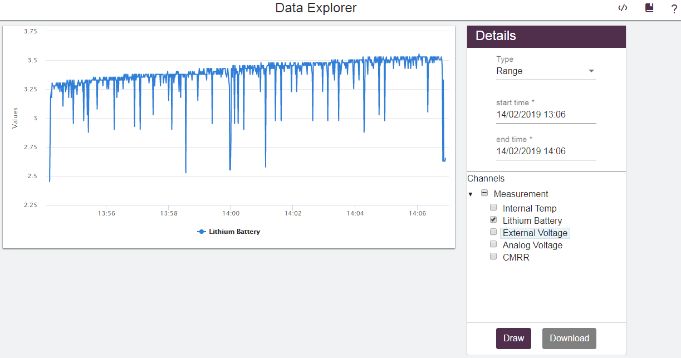
Data Explorer
Data Explorer menu will give access to historical data, recorded by the selected logger, either showing it in chart
or download it. Please see Data Explorer (P21) for detailed information.
Figure 8: Data Explorer from LOG 1 logger
UM-dEX-001EN dEX User Manual P a g e |9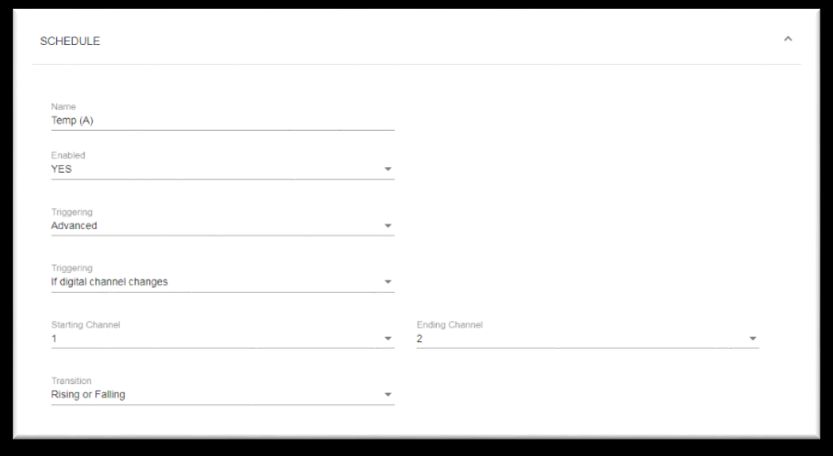
Settings
  Settings page will provide access to PROFILE settings for dataTaker. In dEX NG profile settings can be set
  independently without updating the program, so client does not need to worry about losing the existing dataTaker
  program when they want to change PROFILE setting.
  This settings has 3 categories, within each category there are a couple of groups which access to related
  PROFILEs. The design of dEX NG allows each group to be updated separately which make it easier to monitor
  and apply the necessary changes.

 Logger

                                  Figure 9: Logger Category on Setting Page – Logger(s)

  Logger category has a focus on local settings in dataTaker. This category contains 6 different groups which client
  may expand each group to get a specific PROFILE:
      1. Site Information
           This group is provided as a way of identifying and documenting a configuration.
           Name is an optional configuration name. This will be shown on the home screen of the DT80 LCD
           display. If not specified then the job name will be shown, which is always CONFIG for a job generated by
           the dEX NG.

                                     Figure 10: Successful update on Site Information

  UM-dEX-001EN                                      dEX User Manual                                     P a g e | 10
2. Regional
The Regional group contains settings related to the region in which the logger is deployed:
The Mains frequency setting should be set to the local power mains frequency. The DT80
integrates analog measurements over an integral number of mains cycles, in order to provide
maximum rejection of mains-related noise.
Set the Temperature units to the desired units to be used for all temperature measurements.
Decimal point character is used to select the number format used in CSV and free format data
returned by the logger.
3. Time and Date
The Time and Date group contains time related settings:
The Time zone control must be set if you are using NTP to synchronize the DT80's system time. If
NTP is not used then this does not need to be set. Note that the city names are provided as a
guide only, and do not take daylight savings into account.
There are controls relating to Network Time Protocol (NTP). The DT80 can use NTP to
synchronize its internal system time to a time server on the Internet. If NTP is enabled then the
time zone control must be set appropriately.
A button is provided for setting the logger date and time based on manual setting or use the
current PC time.
4. Power
This group contains a number of options that can be used to trade off the DT80's speed and availability
against power consumption.
Seven aspects of DT80 operation can be controlled on this group:
a b
c d
e f
g
Figure 11: Power Group on Logger Category
a. Enabling low power sleep mode will reduce the DT80 power consumption to very low levels after a
defined period of inactivity and between scheduled measurements. However, during sleep no
communications or other interaction with the logger are possible.
b. Delay until Sleep sets how long the DT80 waits before entering low-power sleep mode after the
las communication or key press. Default value is 30 seconds.
c. By default, sleep mode is disabled when the DT80 is externally powered. For applications which
use an external 12/ 24V battery you will probably want to clear this checkbox, so that the DT80 can
sleep while externally powered.
d. Sleep is also disabled by default if an Ethernet or USB cable is connected, because any USB/
Ethernet connection will be lost when the DT80 goes to sleep. You can force the DT80 to go to
sleep regardless of cable status by clearing the "disable sleep if using USB/ Ethernet" checkbox.
e. The DT80's analog measurement subsystem can be powered continuously, or switched on and
off as required. The latter option saves power, but requires a short "warm up" time before each
group of analog measurements, which will reduce the DT80's maximum sample rate.
UM-dEX-001EN dEX User Manual P a g e | 11f. The LCD backlight has 4 modes of operation:
Always on, It will be powered continuously (making the LCD easier to read).
On when needed, it will be switched on for a short time (P17 value) following a key press.
Always off, backlight will never turn on.
Balanced mode, if externally powered, it will always stay on and if battery powered, it will
be switched on for a short time (P17 value) following a key press..
g. The 12V power output can be enabled continuously (possibly also during sleep mode), or it can
be configured to automatically switch on when a CEM measurement is required.
5. Calibration
This group contains a control to set the voltage drift threshold (in microvolts) for triggering an automatic
recalibration of the DT80's analog system. Automatic recalibration reduces the effect of temperature
changes on analog measurements.
6. Security
Allowing access to the DT80's servers via the Internet can present a security risk. This page allows you
to restrict access to selected DT80 services.
HTTP: Users may enable or disable HTTP server and sets the HTTP port number, default port: 80
MODBUS: Users may enable or disable MODBUS server and set the MODBUS port number,
default port: 502
FTP: Users may enable or disable FTP server, set the FTP port number (default port: 21), set
credentials (user name and password) for accessing FTP server, and specify whether read-only
anonymous FTP access to the DT80 is permitted.
Command Server: Users may enable or disable command server, set the command port number
and the desired delay before locking the server.
PPP: Users may set PPP credentials (user name and password). These credentials are used when
connecting to the DT80 from a remote PPP client.
Communication
Figure 12: Communication Category on Setting Page – Logger(s)
Communication category has a focus on communication settings in dataTaker:
1. Ethernet
On this group you can:
Enable or disable the Ethernet port.
Select automatic or manual configuration. Automatic is suitable if there is a DHCP server running
on your local network, or if you a connecting directly to a single PC via a cross-over cable. Select
manual if you wish to configure a static IP address.
Manually set up the required network parameters, if manual configuration was selected. These
include IP address, subnet mask, gateway address and DNS server addresses. These are
normally specified by your network administrator.
UM-dEX-001EN dEX User Manual P a g e | 122. Modem
By default, the DT80 uses the state of its Host RS 232 port’s DSR terminal to determine whether a
modem is connected to the port, client may choose to assume that modem always present or no modem
connected.
The modem can also use various control to power it up from relay, 12V or digital output, the default setting
is no control from the logger.
The last setting will be able to reset the modem power if no response from CD pin for certain number of
seconds (default is 43,200 seconds).
3. USB
This group is used to control USB port function. The possible settings for the USB port FUNCTION
parameter are:
COMMAND (default) – the port accepts DT80 commands sent directly over the serial interface. The
port will automatically switch to PPP mode if an incoming PPP connection is detected. When the
PPP connection is closed the port will go back to accepting direct commands.
PPP – the port accepts PPP connections only.
SERIAL – data transmission and reception is controlled by the current job, using the 3SERIAL
channel.
MODBUS – the port receives and processes incoming serial Modbus requests.
MODBUS_MASTER – the port is used for polling a Modbus sensor device, as specified in the
current job using the 3MODBUS channel.
DISABLE – the port is disabled. This setting reduces power consumption.
4. Serial Port
The three DT80 serial ports (USB, host RS232 and serial sensor) are configured in a similar way: Each
has its own page of controls.
Figure 13: Serial Sensor port as RS485 on MODBUS Master setting at 9600 baud 8N1
On the USB port page (not present on DT82 models), there is only one setting: the port function,
which specifies whether the port should be used for command/PPP, PPP only, serial sensor or
Modbus. You can also disable the port.
On the host port page (not present on DT8xM models), you can set the port function, as well as
the serial parameters (baud rate, flow control etc.) The flow control timeout (maximum time to
spend waiting for a "clear to send" indication before sending anyway) can also be set.
On the sensor port page (not present on DT81/ 82E models) there are a similar set of controls for
the serial sensor port, plus an extra one to select the port mode (RS232/ 422/ 485). See Figure 13
for example.
UM-dEX-001EN dEX User Manual P a g e | 135. Wifi
On this group you can:
Enable or disable the Wifi module.
Select the operation mode: client or access point.
Set the SSID of the network.
Set the type of security of the network (Open, WEP, WPA or WPA 2).
Set the password to connect to the network.
If access point mode was selected, a channel number must be provided.
Manually set up the required network parameters, if manual configuration was selected. These
include IP address, subnet mask, gateway address and DNS server addresses. These are
normally specified by your network administrator.
Interface
Figure 14: Interface Category on Setting Page (Logger(s))
Interface category has a focus on front interface of dataTaker.
1. Startup
The settings on this page control the DT80's behaviour following a hard reset (HRESET command, power
failure, hardware reset switch, or abnormal reset).
By default, the current job will be reloaded following reset, but this can be disabled by selecting NO in the
dropdown menu.
You can also make the DT80 restore all digital outputs (including the latching relay output) to their
previous state following reset (by default they will be reset to the "off" state), using the Maintain digital
outputs checkbox.
2. Keypad Functions
You can also make the DT80 restore all digital outputs (including the latching relay output) to their
previous state following reset (by default they will be reset to the "off" state), using the Maintain digital
outputs checkbox.
This page allows up to ten commands to be added to the function menu that is displayed when the Func
key is pressed. To add or edit a label or command click on the appropriate table cell, enter the new text
then press Enter or click on another cell. See User Defined Functions in DT8x User Manual.
3. LCD
The options on this page are mostly intended for applications where the display is visible but the keypad is
not accessible. The Auto-scroll option will cycle through all defined channels on the display at the
specified rate, while the Auto-dismiss option will automatically acknowledge any warning messages that
may be shown on the LCD after they have been displayed for the specified time. See Display in DT8x
User Manual.
Job Builder
Job Builder will provide a visual job creation tools for users, it will follow the structure of dataTaker job to manage
schedules and channels. For detailed information, please see Job Builder (P25).
UM-dEX-001EN dEX User Manual P a g e | 14Extra Menu
Figure 15: Additional Menu for Status at the top right corner on Logger(s) Page
There are a couple extra menu which related to the logger, these menu are located at the right op corner of
Logger(s) Page. The menu appearance will depend on the page which users currently visiting.
1. Command Interface
Command Interface will open up port 7700 which similar to the old dEX Command Windows or
DeTransfer. It will allow you to send command to DT80 and see its response. However unlike previous
version of command interface, there is no specific SEND windows but only one line of code entry, also it
is not possible to highlight and capture the content.
2. Logs
This menu will give access to 3 logger logs information: Event Logs, Self-Test and Service Log. There is
a refresh button on each log page to generate the log.
Figure 16: Self-Test
3. Run Wizard
Run Wizard will assist new users to set DT80 PROFILE setting for the first time. The content is similar to
Setting but it has better presentation.
Figure 17: Wizard
UM-dEX-001EN dEX User Manual P a g e | 154. Three Dots
There are different menu set for three dots depending on the page. This is the possibility of three dots
sub menu:
- Delete Device
This menu will delete the logger page from the list
- Create Template
This menu will automatically create a template with the current logger model, PROFILE setting and
job.
- Apply Template
This menu will use selected template for the logger, current logger configuration will get overwritten.
- Restore from Loggers
This menu will get DT80 PROFILE from the logger and overwrite the PROFILE in Settings. This is
useful when users are not sure which PROFILES that they have changed before sending it back to
the logger.
- Factory Defaults
This menu will return all DT80 PROFILE to defaults.
5. Save Dashboard
This menu will keep the Widget set in the computer screen for the logger.
6. Download Dashboard
This menu will download the Widget set from DT80 and populate the computer screen.
7. Upload Dashboard
This menu will save the Widget set information in the logger.
8. Open Widgets
This menu will set Widget display for measurement.
9. Help
This function will give access to online resources in dataTaker web: FAQ, training documents and video,
and download link for software.
There are also some extra menu within Job Builders, some are similar to the above menu while the others are a
bit different. For detailed information on Job Builders extra menu, please see Properties Pane (P26)
Template Page
Overview
Program template is the legacy of offline configuration from the original dEX. It allows the users to make
preparation of the program without actually have physical connection. In dEX NG we add an option to use a
template when accessing online logger.
Status
Status provides information about the selected template.
Status
In this category users will see the logger model in which the template is based.
Connectivity
In this category, logger connection related settings are displayed and could be updated if the logger settings have
changed.
Name: Name displayed in the Menu segment of display page.
Short Name: Name displayed in the Home/Logger segment of display page.
UM-dEX-001EN dEX User Manual P a g e | 16Settings
Settings page within Template Page is similar to Logger(s) Page. It will provide access to PROFILE settings for
dataTaker. This will be a passive setting until this template is used on an online logger, thus Save button will
replace Apply button.
Figure 18: Logger Category on Setting Page – Template
For detailed information about PROFILE setting, please check Settings (P10) in Loggers Page.
Job Builder
Job Builder will provide a visual job creation tools for users, it will follow the structure of dataTaker job to manage
schedules and channels. For detailed information, please see Job Builder (P25).
UM-dEX-001EN dEX User Manual P a g e | 17Top Menu
dEX NG menu are collected into three groups along the menu bar: Application, Edit and Development
Application
At this moment there is no information about the application is this menu. While the other menu is used to exit
from the application.
Edit
The Edit menu contains text-related commands. They are applicable to the text in receive windows as well as
send windows. The commands are
Undo – Undo (cancel) your previous text editing operation
Redo – Cancel previous Undo operation
Cut – Deletes selected (highlighted) text from the active send window and places it in Windows’ clipboard
Copy – Makes a copy of selected (highlighted) text and places it in Windows’ clipboard, the original text is
not deleted
Paste – Inserts a copy of the clipboard contents at the insertion point in the active send window
Select All – Selects the entire contents of the active sub-window, including text that is scrolled out of view
Development
Development Tools will give diagnostic on dEX operation relative to dataTaker. It is similar to Developer Tools in
your web browser. dEX request is actually a RPC call to DT80, and if there is some issue on particular functions
users may trace that dEX function request.
It is useful to give indication to us for troubleshooting failed function.
Figure 19: RPC Call for Widget
UM-dEX-001EN dEX User Manual P a g e | 18Part C. Data Monitoring
Dashboard
Overview
Dashboard is a place where you can set one or several widgets together. If the dashboard is located at Home
Page the extent of accessible channels comprises to all defined loggers in dEX, however if this location at Logger
Page selection of channels are limited to one particular logger.
There are 4 different Widgets to choose: gauge, digital chart and wind rose. Users may choose to add many
Widget to the page, however the limitation is bound to the logger measurement interval. The faster measurement
interval, the less widget you should have.
Figure 20: Gauge and Digital Widgets
Gauge
Gauge widget represent a speedometer widget, you may set the range, lower and upper threshold of values. The
range is not covered by threshold will have green color, lower threshold with yellow color and upper threshold
with green color.
Digital
Digital Widget will show measurement value as numbers together with selected icons. The icons will change
color depending on threshold setting with no threshold with green, lower threshold with yellow and upper
threshold with red color.
Figure 21: Standard and Scatter Chart Widgets
UM-dEX-001EN dEX User Manual P a g e | 19Chart Chart will plot range of data over period of time (standard chart) or plot the measurement data one against another (scatter chart). On standard chart user may plot several parameters at the same time utilising different Y axis. There are 3 selection on chart form either as line chart, area chart and bar/ column chart. However the less parameters appear on the chart the more clarity it will become. Wind Rose This widget is specialised to plot wind speed and direction parameters. UM-dEX-001EN dEX User Manual P a g e | 20
Data Explorer
Overview
Data Explorer page can be seen in Home Page and Logger Page(s), both have the same function to show
historical data which was recorded by dataTaker. However the target data would be different:
Data Explorer in Home Page has the following capabilities:
Show historical data on particular date range from selected channels of several connected loggers
in the same chart page (Figure 6).
Download data as CSV/ DBD file(s) on particular date range from selected channels of several
connected loggers (each file represent one logger data).
Data Explorer in Logger Page(s) has the following capabilities:
Show historical data on particular date range from selected channels of a logger.
Download data as CSV/ DBD file(s) on particular date range from selected channels of a logger.
2
1
3
4
Figure 22: Data Explorer sections; 1 – Chart, 2 – Range Selection, 3 – Channels Selection, 4 – Outputs Selection
Sections of the Page
There are 4 sections within Data Explorer page:
Chart
Chart occupy the middle section and to generate one users need to define channels and date range, otherwise
this section will be empty.
UM-dEX-001EN dEX User Manual P a g e | 21Figure 23: Chart Display
Chart display is mostly being used to make comparison between two readings, and because dEX NG can show
data from multiple loggers this feature may give more advantage on logger to logger data comparison.
Notes: This chart has automatic range setting, thus displaying two channels with big differences in value may show flat lines.
Also displaying too many channels at once (although it is possible) may lose clarity on the display.
Time Range
Time Range selection will offer choice on start and end data to be displayed or downloaded. The options are as
follows:
All Values will display/ download all available data/alarms. When using this option, start or end range
selector will disappear.
Figure 24: All Value option
Range (which is the default with 1 hour past of current time) allows you to specify an explicit date/time
range. Clicking on the start or end date fields will display a calendar/ time control, as shown in Figure 25
below. That control will indicate whether you are modifying start or end time by blue highlight at the bottom
of time control. Users need to set start or end time before setting up its counterpart.
UM-dEX-001EN dEX User Manual P a g e | 22Figure 25: Calendar/ time control
Use the left/ right arrow selector to select the month and the middle selector to select the year, then click
on the required day. The currently selected date is highlighted in blue, then set the time using up/ down
arrow selector before clicking Set button.
Channels Selection
Channels selection will offer choice of one or more channels to be displayed/ downloaded. By clicking “Load
Device Tree” users will be able to see program structure of one logger or multiple loggers depending on the
location of Data Explorer page.
If Data Explorer is located at Home Page, users will be able to choose particular loggers, particular channels or
particular schedules using checkbox. But when the Data Explorer is located at Logger Page(s), logger selection
will not be available in the structure.
As per tree structure selection system, when users put a checkbox on higher structure all braches/ members of
that structure will get selected as well.
Figure 26: Tree Structure on LOG 1
Example on Figure 26: no channels is selected on schedule A, all channels in schedule B are selected and only
partial channel in schedule C is selected. For partial selection (i.e: schedule C), notice the minus sign in the box
in front of Current (schedule C name).
UM-dEX-001EN dEX User Manual P a g e | 23Outputs
Users may choose to display the data within selected time stamp as a chart (Draw) or download the data into
their PC. Draw will initiate data plotting on the Chart (P21) area while download will open a selection for data
format (CSV or DBD) then continue with location selection in the PC for data.
The file name will be auto generated by dEX with dex-chart as header followed with download date and time
stamp.
Figure 27: Auto generated file name
UM-dEX-001EN dEX User Manual P a g e | 24Part D. Job Builder
Overview
Figure 28: Fresh dEX Programming Template
Job Builder is located within Logger Page(s) (P9), after Settings (P10) menu. If the logger is being programmed
for the first time, that interface will show the existing program template stored by dEX NG. If there is no stored
template, it will show On Activation (Figure 28 (P25)). Otherwise dEX NG will show the existing program (Figure
29 (P25)).
Figure 29: dataTaker Program Example in dEX NG
The above screenshots show Program Tree View on the left (middle part of Page Structure (P6)) and Properties
Pane on the right.
Program Tree View
Program Tree View show the current configuration with configuration elements (channels and schedules) are
defined. This part of the interface thus gives an overview of the configuration, showing which channels belong to
which schedules.
The Tree View contains two "levels", with each level's entries indented further to the right.
The top level there are the schedules, In Figure 29 six schedules have been defined: the built-in On
Activation entry represents the immediate schedule, and is followed by five user schedules, A, B, C, D
and E (a.k.a "Temp", “Voltage”, “Current”, “Strain” and "Load Cell").
UM-dEX-001EN dEX User Manual P a g e | 25Each schedule have plus symbol on the right to create new channel and triangle symbol on the left to
hide/ hide all of their constituent entries, which can reduce clutter when you are working on a large
configuration.
The second level are the channels. Channels are bound to schedule as its member, users may create
many channels within a schedule.
If you highlight an entry in the tree (either a schedule or a channel), its details will be displayed in the large
properties pane area which occupies the right side of the screen area.
Figure 30: Tree View
Directly above Tree View area are several buttons:
1. SCHEDULES with a plus symbol in a circle. This plus symbol is clickable and used to create a new
schedule.
2. Apply to Logger button for sending the program to dataTaker
3. Three dots which will open 2 more selectable menu:
Load from Device
This function will upload logger configuration to dEX NG and replace the shown configuration.
Clear Schedules
This will clear the shown program and start fresh.
Properties Pane
The large properties pane on the right hand side is used to display all of the detailed settings for the selected
Tree View item.
The layout of this area varies depending on the type of entry selected on the tree, schedule or channel:
If a schedule tree entry is selected then details of the schedule's trigger are shown. The rest of setting is
not shown and must be accessed via Advance tab.
If a channel entry is selected then details of channel name, wiring configuration and channel number are
shown, while the rest of setting are not shown and must be accessed via Advance and Statistic tab.
Figure 31: Function buttons above Properties Pane
UM-dEX-001EN dEX User Manual P a g e | 26Above Properties Pane, there are several buttons:
1. Command Interface
The first button from the left will give access dEX NG Command Interface, client can use this interface to
send commands directly to dataTaker logger similar to dEX Command Windows or DeTransfer.
Figure 32: Command Interface
2. Logs
The second button from the left will give access to Event Logs, Self-Test and Service Logs report. Click
the refresh button to generate the report.
Figure 33: Self-Test report
3. Save Template
This “Save” button is used to make confirmation after creating or modification of schedules or channels.
4. Three Dots
The three dots will have different functions depending on the active line. For programming, they have a
maximum 5 selections:
Delete
This function will trigger deletion of line, applicable for Schedules (but not within On Activation)
and Channels.
Move Up
This function will move one channel up in Tree View within one schedule, but it can’t move the
channel between schedules), applicable for Channels only.
UM-dEX-001EN dEX User Manual P a g e | 27 Move Down
This function will move one channel up in Tree View within one schedule, but it can’t move the
channel between schedules), applicable for Channels only.
Duplicate
This function will create a duplicate of selected channel, applicable for Channels only.
View DXC
This function will generate DXC file, accessible from any lines (On Activation, Schedules and
Channels).
Figure 34: DXC Viewer
5. Help
This function will give access to online resources in dataTaker web: FAQ, training documents and video,
and download link for software.
Schedules
When a new program is triggered starts up, only one pre-defined schedule is shown: the immediate schedule (On
Activation). This immediate schedule does not have a trigger or any storage options, however this page is used
to set Statistical Schedule (Schedule S) and Command Password.
If you need to add a new schedule, click plus symbol inside a circle next to Schedule word (in capital). See Figure
30. The schedule ID allocation will follow declaration sequence, the first declaration schedule will use ID A, then
ID B and so on. When one schedule get deleted the next one will assume previous used ID.
There are 12 schedules can be created in total, when the limit is reached the plus symbol in circle will disappear
so no more schedules can be created.
On Activation
The immediate schedule is used to trigger any channel as its member one time only either at the start of running
program or after power cycle. This page also hosts 2 program setting which are
Statistical Schedule which give statistic interval setting to be used by the channels when they enable
statistic option.
A command server password can be defined. If a password is set then the DT80 will ignore anything
sent to the command server until the password is sent.
UM-dEX-001EN dEX User Manual P a g e | 28General Options
Schedule Name
The default name would be SCHEDULE_, there is no indication of schedule ID so it is advised to add one in the
name in order to give tracing mark for troubleshooting. Although there is no schedule ID, the schedule order
follow letter sequence depending on the defined sequence of schedules.
Schedule Trigger
By default, dEX NG sets a new schedule to a 5 second trigger. To change this time, simply alter the indicated
number and/or time units. For a daily trigger at a particular time of day, select Daily at option then define the hour
and minute.
Other types of schedule trigger (e.g. event triggered, manual trigger) is also available. Select Advanced which
will cause Triggering control to appear, then choose Triggering control to show more option. For example, the
following settings will trigger the schedule when a falling edge is detected on digital input 1D or 2D.
Figure 35: Setting for trigger the schedule when rising/ falling signal detected on 1D or 2D
Enable Logging
Enable logging selection will enable or disable the logger to log measurement data for that particular schedule.
Default setting is YES.
Advanced Options
Advanced option will give access to additional schedule option, such as trigger condition and memory allocation,
General
General option allow the users to define location of data/ alarm either internal memory (drive B) or external USB
stick (drive A).
Conditions
Conditions entry is used to define the schedule "while" condition. By default the setting is set to ALWAYS, when
other setting is selected additional options will appear.
Figure 36: While condition on 5CV equal to 0
UM-dEX-001EN dEX User Manual P a g e | 29Data
Data option allows you to set storage allocation for data and whether you want old data to be overwritten by new
or stop logging after memory is full.
Alarms
Data option allows you to set storage allocation for alarms, the length of alarms characters and whether you want
old data to be overwritten by new or stop logging after memory is full.
Managing Schedules
To add a new schedule, click plus symbol in circle next to SCHEDULE (Figure 30 (P26)). This will add a new
entry to the Tree View, and properties pane to the right for setting configuration (General Options and Advanced
Options)
This dEX NG does not allow to change the priority order of schedules, unlike the web interface version. To delete
a schedule and all of its constituent channels, select the schedule, click on Three Dots above the properties pane
and select Delete.
Channels
Overview
Users may add channels as a member of particular schedule by clicking
Properties pane of a channel will be shown on Display Pane after selection of channels. This pane will provide
option selection of a channel such as sensor type, wiring, channel name, and measurement unit. Most
measurement channels have a similar properties pane layout, except SERIAL, MODBUS and SDI12 channels.
There are 3 groups within properties pane of a channel: General Options, Advanced Options and Statistics.
Channel can be added by clicking + symbol on the right side of schedule name (see Program Tree View (P25)).
Channel Types
There are many channel types that can be read by dataTaker, those channels are grouped within 2 levels. The
lower level is based on category such as voltage, current, bridge, digital input, etc. And the upper level is based
on signal or operation type such as Analog, Digital, Serial, Action and Others.
Analog
Analog is one of signal group, consist of 8 categories: temperature, bridge, voltage, current, resistance,
frequency, internal and geotechnical. The last Geotechnical category will appear only on dataTaker G model.
The following is the breakdown for each categories within analog group:
1. Temperature
1.1. AD590 series: AD590, AD592, TMP17
1.2. RTD: Copper, Nickel, PT385, PT392
1.3. Thermocouple: B, C, D, E, G, J, K, N, R, S, T
1.4. LM135 series: LM132, LM235, LM335
1.5. LM35 series: LM34, LM35, LM45, LM50, LM60, TMP35
1.6. Thermistor: YS01, YS02, YS03, YS04, YS05, YS06, YS07, YS16, YS17
2. Bridge
2.1. Current Bridge
2.2. Voltage Bridge
3. Voltage
4. Current
5. Resistance
6. Frequency
7. Internal: REFT, VANA, VREF, VZERO, VBAT, IBAT, VDD, VSYS, VRELAY, VEXT, VLITH, R100,
CMRR
8. Geotechnical
UM-dEX-001EN dEX User Manual P a g e | 30Figure 37: Analog Channels Selection, Geotechnical channel only appears on G model
Digital
Digital is one of signal group, consist of 3 categories: digital input, digital output and pulse counter.
Figure 38: Digital Channels Selection
Action
Action is one of process group, consist of 3 categories: email data, FTP data, calculation and alarm.
Figure 39: Actions Selection
UM-dEX-001EN dEX User Manual P a g e | 31Serial
Serial is one of signal group, consist of 3 categories serial, SDI12 and MODBUS.
Figure 40: Serial Channels Selection
Others
Other is a separate group consist of the remaining categories which are not classified within previous group,
consist of 4 categories: reference, delay, manual and reset counter.
Figure 41: Other Channels Selection
Channel Properties Pane
Channel Tab
The top tab is channel tab which give basic setting to a channel. There are 2 setting groups: General and Wiring
and all channel will have at least one setting group. General group comprises basic selection to a channel, thus
every channel may have different appearance of this setting. Most of the channel will have selection of channel
type in this setting.
Wiring group comprises wiring configuration, terminal location, channel name and measurement unit. Some
passive channel such as digital output will not have this group.
Completing this tab is a bare minimum to start your measurement.
Advanced Tab
The second tab is advanced which give more setting to a channel. It consists the selection to log, assignment to
channel variable, data manipulation and scaling. On some channels special extra settings are available such as
extra sample, multiplier, measurement delay, gate time and external shunt resistor.
Scaling will allow conversion from analog signal into other unit. There are 2 type of scaling which can be set by
clicking Manage Scaling button. After creating this scaling is usable across all channel in the program.
UM-dEX-001EN dEX User Manual P a g e | 32Figure 42: Scaling
Statistics
The last tab is statistic for creating statistical report. For each row that is ticked, an additional measurement value
will be calculated and reported. So in the example below a total of four values will be logged: the original
measurement, plus the average, minimum and maximum values calculated over the period since the time the
enclosing schedule was executed.
If any statistical values are defined for a channel, the channel will then be sampled at the Statistical Schedule
(P28) rate, rather than the rate of the channel's own schedule. It will, however, still be logged at its own
schedule's rate.
For example, if the statistical schedule rate is set to its default of 1 second, and the above channel's schedule is
set to its default rate of 5 seconds, then the sensor will be sampled once per second. Every 5 seconds it will log
the instantaneous value of the sensor, plus the average, minimum and maximum, calculated over the previous 5-
second period.
You can choose not to log a calculated statistical value. For example, it may be being used as an input to a
calculation channel. Finally, each statistical value may optionally be assigned to a channel variable. You may
want to do this if the value is to be made available to a Modbus client system, for example.
Figure 43: Statistical Options
Alarms
Alarms section has been remodelled from previous dEX, now it allows combination of condition on either channel
or time. This construction of complex condition is possible using Boolean expression.
UM-dEX-001EN dEX User Manual P a g e | 33Within this setting you may also set Alarm text to save and several actions to be performed by the logger when alarm is triggered. Special substitution characters can be placed into Alarm text to dynamically insert information when alarm returned/ log or sent out as SMS. Email can also be triggered as part of actions, FTP transfer action is also possible but have to be constructed as independent command. UM-dEX-001EN dEX User Manual P a g e | 34
You can also read