PATTERNS AND TRENDS OF SUBSTANCE USE - June 2018 Update THE REGIONS OF FLORIDA
←
→
Page content transcription
If your browser does not render page correctly, please read the page content below

PATTERNS AND TRENDS
                                     OF SUBSTANCE USE
                                                                WITHIN AND ACROSS
                                                            THE REGIONS OF FLORIDA
                                                          June 2018 Update

                     This product is supported by Florida Department of
                     Children and Families’ Office of Substance Abuse
                     and Mental Health funding.
Office of Substance Abuse
   and Mental Health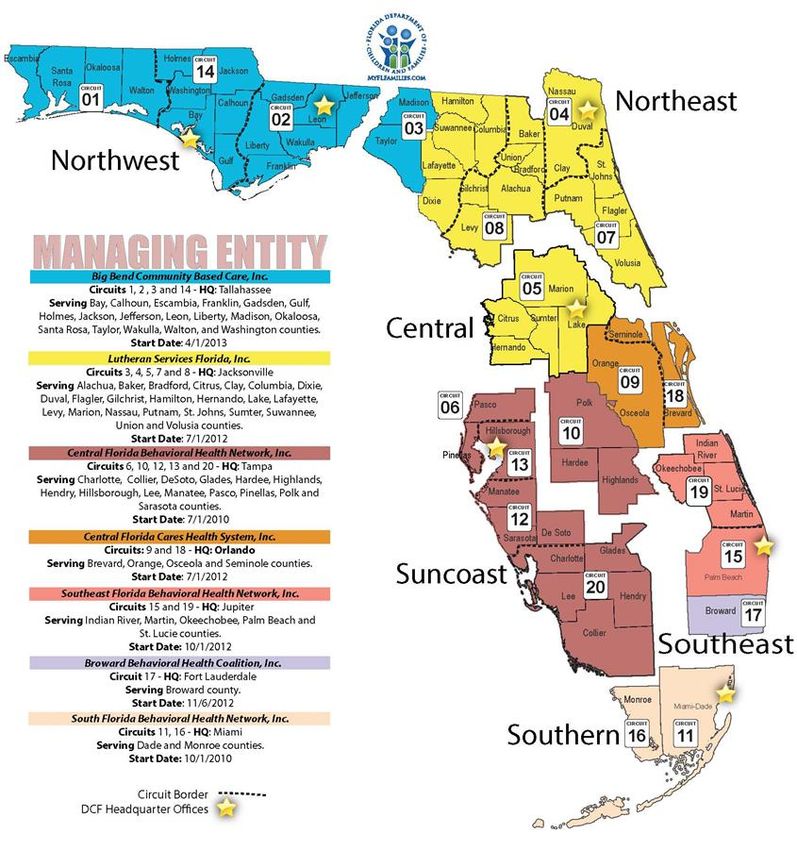
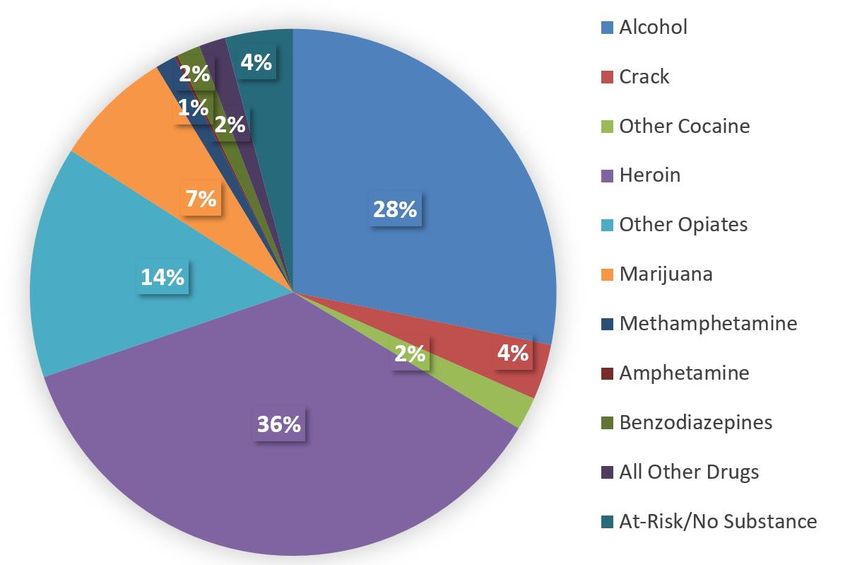
Table of Contents

SECTION I. INTRODUCTION .................................................................................................................3
   Report Highlights .................................................................................................................................... 4
   Florida’s Regions and Population ........................................................................................................ 6
SECTION II. PATTERNS AND TRENDS OF SUBSTANCE USE ....................................................................8
   Alcohol ..................................................................................................................................................... 8
      Underage Alcohol Use....................................................................................................................... 8
      Adult Alcohol Use and Misuse.......................................................................................................... 9
   Tobacco/Nicotine/Vaping ...................................................................................................................... 9
      Youth Tobacco Use ........................................................................................................................... 9
      Adult Tobacco Use ............................................................................................................................. 9
      Electronic Vaporizers ....................................................................................................................... 10
   Marijuana ............................................................................................................................................... 10
   New Psychoactive Substances (NPS) .............................................................................................. 11
   Opioids ................................................................................................................................................... 12
      Prescription opioids .......................................................................................................................... 13
      Fentanyl analogs .............................................................................................................................. 14
      Heroin ................................................................................................................................................. 15
      Cocaine .............................................................................................................................................. 17
      Methamphetamine/Amphetamines ................................................................................................ 19
      Benzodiazepines .............................................................................................................................. 20
SECTION III. EPIDEMIOLOGIC INFORMATION FROM PUBLIC TREATMENT DATA ................................ 22
SECTION IV. SUMMARY ................................................................................................................... 27
REFERENCES .................................................................................................................................... 28

                                                                               1
2
Patterns and Trends of Substance Use
                      Within and Across the Regions of Florida

                                   Update June 2018

                                Lee A. Crandall, Ph.D.
                             Epidemiologist and Professor
                          Department of Public Health Sciences
                                  Clemson University

SECTION I. INTRODUCTION

This report provides a brief statewide and regional update of the substance abuse issues
and trends in Florida most recently addressed in the 2018 Annual Report, Patterns and
Trends of Substance Use Within and Across the Regions of Florida. This update is
based on information from multiple new sources available as of May 2018. These sources
include:
    • the 2017 Medical Examiners Interim Report on drugs identified in deceased
       persons during the first six months of 2017;
    • newly available online data from the 2017 Florida Youth Tobacco Survey (FYTS);
       and
    • data for Fiscal Year 2016-2017 substance abuse treatment admissions by primary
       drug from the Department of Children and Families SAMHIS.

Based on data from the 2017 Medical Examiners Interim Report, half-year numbers (data
reported for 6 months) were doubled for yearly projections for some graphs and tables
used in this update report. It should be noted that this approach may underestimate data
for the entire year when rates are increasing, and overestimate annual data when rates
are decreasing.

Florida‘s 2017 population was estimated to be slightly more than 20,484,000 residents
(20,363,867) when inmates are excluded), according to the Bureau of Economic and
Business Research (BEBR). This is an increase of nearly 9% since the 2010 census.
Approximately 4.1 million Floridians were born in another country (20%) and even more
were born in another U.S. state, according to the U.S. Census Bureau. Thus, Florida’s
population is a cultural sample of the America’s and serves as a sentinel site for observing
emerging issues and changing patterns of substance abuse.

The Florida Department of Children and Families recognizes six multi-county regions and
provides behavioral health services to Florida’s diverse population through its seven
Managing Entities. Where possible, data have been broken down into geographical
regions with separate data for the Broward Managing entity.

                                             3
Report Highlights

   o In 2017, historic declines in alcohol use, binge drinking, and cigarette smoking
     among Florida middle and high school students continued mirroring national trends
     (Florida Youth Substance Abuse Survey, 2017). About one of every thirteen
     students reported “vaping” (using electronic cigarettes or similar devices that
     produce an aerosol) during the past 30 days, three times the frequency of cigarette
     use, but a decline of 1.2% from 2016.

   o Conversely, the opioid epidemic continued to worsen dramatically in Florida and
     across the nation during 2016 and 2017. The most lethal component of this
     epidemic has been the rapid spread of illicitly manufactured non-pharmaceutical
     opioids mostly from foreign clandestine labs, especially fentanyl analogs that often
     are extraordinarily potent.

   o Concerns have been expressed recently about the potential for a second epidemic
     of stimulant drugs concurrent with the opioid epidemic. The Drug Enforcement
     Administration’s Intelligence Brief of August 2017 said, “Columbian coca
     cultivation and cocaine production in 2016 reached the highest levels ever
     observed.” It also said that national data showed “the most significant increase in
     domestic cocaine usage since at least 2009” and that trend “is likely to amplify
     through at least 2018.” In Florida, the Medical Examiners 2017 Interim Report
     released in 2018 showed that stimulant-related deaths have increased rapidly
     since 2013.

   o Continuing declines in underage alcohol use are confirmed by multiple surveys
     across all regions of Florida over the past decade. (National Survey on Drug Use
     and Health, Youth Risk Behavior Surveillance System, Florida Youth Substance
     Abuse Survey). However, the 2017 Monitoring the Future data showed a slight
     increase in past month alcohol use nationwide among 8th graders. The 2018
     FYSAS data, when they become available, can allow insight into whether Florida
     mirrors this increase.

   o Alcohol continued to be the most frequently observed substance in drug-related
     deaths in Florida in the first half of 2017. It was determined to be a cause of death
     for 19% of the decedents in which it was detected. (Florida Medical Examiners
     Commission 2017 Interim Report)

   o Fentanyl and its analogs fueled the dramatic escalation of deaths related to
     Florida’s opiate epidemic in 2016 and the first half of 2017. (Florida Medical
     Examiners Commission 2017 Interim Report)

   o Heroin deaths escalated dramatically across Florida in 2016, totaling 1,023. Data
     for the first half of 2017 suggest that the death rate for that year will surpass 2016.
     (Florida Medical Examiners Commission Interim 2017 Report)

                                             4
o Cocaine deaths also increased at a faster rate in 2016 than in previous years.
  Mid-year data for 2017 suggest a continued rapid rise in these deaths. (Florida
  Medical Examiners Commission 2017 Interim Report)

o Methamphetamine-related deaths increased dramatically in Florida in 2016. The
  2017 estimate based on mid-year data is for an additional 200 deaths versus 2016.
  (Florida Medical Examiners Commission 2017 Interim Report)

o While there are some variations, most patterns and trends of substance abuse
  continue to be relatively similar within and across the regions of Florida. Notably,
  both Medical Examiner data and treatment admission data suggest that
  methamphetamines are a more prevalent problem in the Northwest region than
  elsewhere in the state, while this region seems to be less impacted by opioids.

                                        5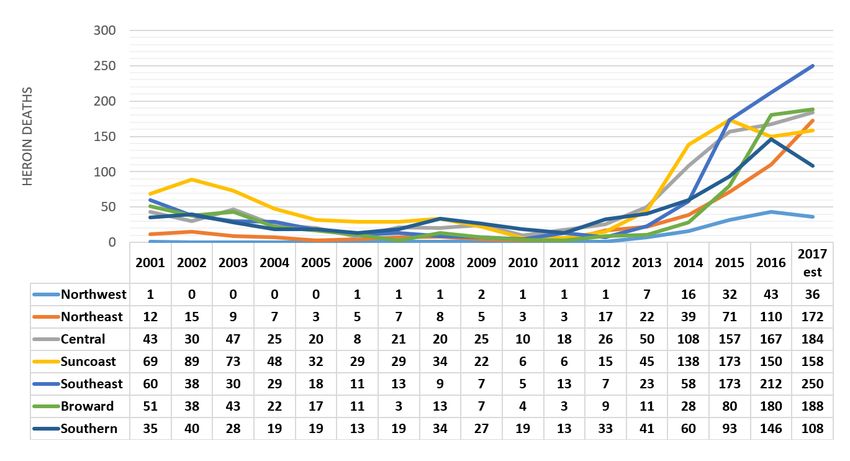
Florida’s Regions and Population

The Department of Children and Families provides behavioral health services to Florida’s
diverse population through its seven Managing Entities as shown on the map below.
Numbers on this map indicate circuit court districts. When possible, data in this report
has been presented for the seven Managing Entity catchment areas including Broward.

Figure 1 - Florida's Managing Entities by Region

                                                   6
Total 2017 state estimate* 20,363,867
Figure 2 - 2017 Estimated Total Populations in Florida's DCF Regions
December 2017 - Bureau of Economic and Business Research
The total population of Florida as of April 1, 2017 was estimated to be 20,484,142, an
increase of 1,682,810 from the 2010 census. Population estimates for each region used
in this report are based on the Bureau of Economic and Business Research (BEBR)
estimates published in December 2017. The pie chart of population shows that the
Suncoast Region accounts for the largest share of Florida’s population (25%) while the
Northwest Region, despite its large geographic area, accounts for only 7% of the
population.
7SECTION II. PATTERNS AND TRENDS OF SUBSTANCE USE
Alcohol
Underage Alcohol Use
Relatively little new information on underage alcohol use has become available since the
Annual Report was prepared in December 2017. The National Survey on Drug Use in
Households has made state-level tables available for 2014-2015 and the Monitoring the
Future (MTF) report for 2017 is now available. Data for Florida youth from the Florida
Youth Substance Abuse Survey are collected in schools during the spring semester, so
2018 data will not be available until the autumn.
NSDUH has modified its reporting categories for the 2015-2016 data. Reports currently
available online do not provide breakouts for ages 12-20 and 21+. The current estimates
published to date instead break use out by ages 12-17 and 18-25. As a result, 2015-
2016 data are not comparable with graphs published in previous reports which showed
long term trends in alcohol use among persons 12-20.
Among youth ages 12-17 interviewed by NSDUH in Florida, 9.15% reported alcohol use
in the past month compared to 9.40% nationally, a difference that was not statistically
significant. Asked about binge drinking in the past month, 4.93% of Florida youth versus
5.33% of youth nationally reported binge drinking. The national estimate falls within the
95% confidence interval for the Florida estimate. Thus, it appears that both estimates for
Florida do not differ significantly from national estimates.
As noted in past reports, various years of CDC’s Youth Risk Behavior Survey (YRBS),
the Monitoring the Future survey (MTF), and FYSAS surveys all show substantial
reductions in both any current alcohol use and binge drinking since 2002 among national
and Florida youth. The declining trend lines of underage drinking rates for both the state
and nation parallel one another closely. However, nationally, 2017 Monitoring the Future
data showed a decrease in 30 day “any alcohol use” only in 10th and 12th grade students,
but a moderate increase from 7.3% to 8.0% among 8th graders.
It is important to investigate whether 2018 Florida data will mirror the national MTF
patterns for younger students. The next opportunity to assess age-related differences in
adolescent alcohol use in Florida will occur when the 2017 Youth Risk Behavior Survey
(YRBS) data are made available (currently slated for June 14, 2018) and when the 2018
Florida Youth Substance Abuse Survey data (collected in spring 2018) are released late
in this calendar year.
8Adult Alcohol Use and Misuse
BRFSS data for 2017 are not yet available. Consequently, the most current survey data
available on adult use and problematic adult use in Florida are those reported in the most
recent annual report.
The Florida Medical Examiners Commission recently reported that in the first six months
of 2017 there were 2,594 occurrences of ethanol alcohol detected among drug-related
deaths in Florida and, in 490 of these occurrences, alcohol was considered a cause of
death. The number of alcohol occurrences in the first half of 2017 represented a slight
(2.7%) increase over the same period in 2016 while the number of deaths was a much
larger 21% increase over the 405 deaths during the same period in 2016.
According to the most recent Florida Uniform Crime Reports, there were 16,765 arrests
in Florida for Driving Under the Influence (DUI) during the first six months of 2017
representing a 3.3% decrease compared to the 17,339 arrests during the same six month
period in 2016. Full year data for 2017 had not been released as of May 2018. The
substances involved in the DUI arrest are not specified but most are for alcohol
intoxication.
Tobacco/Nicotine/Vaping
Youth Tobacco Use
The most significant decline in adolescent drug use nationally and in Florida has been the
dramatic reduction in reported use of cigarettes. National Institute on Drug Abuse’s
Monitoring the Future survey data for 2017 show that nationally each of the age groups
that it follows has posted dramatic declines over the past two decades in lifetime cigarette
use and that this decline continued into 2017.
Recently reported 2017 data from the Florida Youth Tobacco Survey (FYTS) show
dramatic decreases from 2012 to 2017 in “ever tried” cigarettes (a 40.9% decrease) and
current cigarette use (a 59% decrease). Only 2.5% of Floridians ages 12-17 surveyed by
the FYTS in 2017 reported current smoking.
For 2016, when county-level data were available, the prevalence rates of current cigarette
use varied across the seven managing entity regions with higher rates of smoking in the
northern regions of the state. FYSAS 2018 data, available later this year, will allow these
regional differences to be reexamined.
Adult Tobacco Use
Paralleling the reduction in youth cigarette smoking, adult smoking reported in BRFSS
surveys has dropped from 19.3% in 2011 to 15.5% in 2016. The 2016 percentage reflects
tobacco use being reported by 17.8% of males and 13.3% of females in Florida. In 2016
9the lowest adult prevalence was in persons aged 65 and over (8.4%) followed closely by
the 18-24 age group (11.2%) with other age groups roughly twice as likely to be current
smokers.
Electronic Vaporizers
FYTS data recently available show a marked increase in the use of electronic vaporizers
since 2012. Nearly one of every ten 11-17 year olds (9.8%) reported using electronic
vaping in 2017, a 333.8% increase since 2012. 22.3% of youth reported having tried
electronic vaping at some time. These rates are notably higher than those for cigarette
smoking. Some, but not all of the products sold for use in vaporizing units, contain nicotine
of varying levels. The majority of those who “vape” report using only nicotine-free
flavorings, but according to MTF, the use of nicotine containing products increases with
grade level from about one in ten 8th graders to one of every three 12th graders who
vapes.
Perhaps the most positive FYTS finding on this topic, which mirrors the 2017 FYSAS data
included in the last Annual report, is that current use of electronic vaporizers dropped
from 11.0% in 2015 and 2016 to 9.8% in 2017.
The 2016 FYSAS did not show marked differences among regions in the prevalence of
vaping. It will be worthwhile to revisit the issue of regional differences when 2018 data
become available.
Adult use of e-cigarettes as reported in the 2016 BRFSS survey showed that use of e-
cigarettes decreased as the age of the adults surveyed increased. Of the 18-24 age
group, 9.8% reported current e-cigarette use. By comparison, only 1.4% of the 65 and
over age group reported current use.
Concerns have been expressed about the negative health effects of e-cigarettes and
other vaporizing products. Recent research studies have not clearly verified the claim that
e-cigarettes pose less of a health risk than smoking tobacco. Moreover, the “flavorings”
for vapor products are constantly evolving to promote variety. Consequently, consumers
have no way of knowing to what extent electronic smoking devices and products are safe
or what potentially harmful chemicals the products contain. While we await better data on
the long-term effects of “vaping” it is prudent to discourage use, especially among teens.
Marijuana
Newly available national data from MTF showed slight increases from 2016 to 2017 at
each grade level for lifetime marijuana/hashish use and increases in 30 day use for all
youth, excluding 8th graders. In contrast, multiple years of Florida data from the FYSAS
and YRBS surveys identified a rise in adolescent marijuana use around 2009 and 2010
with a relatively stable use or even a slight decline in reported use since that time period.
The same surveys show that marijuana use among Florida middle school students
10peaked in 2010 and decreased in 2017 to the lowest level measured in FYSAS surveys.
It will be important to scrutinize these trends when 2018 FYSAS results become available.
The Florida Medical Examiners Commission 2017 Interim Report reported that there were
1,124 occurrences of cannabinoids detected in Florida toxicology studies during the first
half of 2017. These were instances in which cannabinoids were determined to be present
at the time of death. The number of occurrences in the first six months of 2017
represented a 4.9% increase over the 1071 cases in the same time period in 2016. In
2016 the Commission identified cannabinoids as the cause of death of only 4 of the
people who died in whom a drug was determined to be present at the time of death.
New Psychoactive Substances (NPS)
A critical issue impacting substance abuse in Florida and the U.S. over the past several
years has been the emergence of new synthetic drugs of abuse. The United Nations and
major national government agencies have adopted the term, “New Psychoactive
Substances” or NPS, to describe these drugs. Others refer to these as “novel
psychoactive substances” using the same NPS acronym. No occurrences of tryptamines
were reported by medical examiners in the first half of 2017.
During this same time period, phenethylamines/iperazines (BZP or TFMPP) accounted
for 21 occurrences and eight deaths according to the Medical Examiners Commission,
which is four more occurrences, but three fewer deaths than the prior year.
Reported use of synthetic cannabinoids has decreased dramatically among youth in
Florida in recent years according to data from the FYSAS. Nevertheless, adults continued
to use these substances and during the first six months of 2017, the Florida Medical
Examiners Commission reports that occurrences of synthetic cannabinoids among
decedents that they studied increased by 200 percent (20 more) and deaths caused by
synthetic cannabinoids also increased (18 more). The majority of the synthetic
cannabinoids reported during the first half of 2017 were 5F-ADB (19 occurrences).
Very recently, injuries and deaths in the Midwest from synthetic “marijuana” have received
much attention from the news media. The CDC reports that “from 10 March 2018 through
05 April 2018, 94 people presented to Emergency Departments (89 in Illinois, 2 in Indiana,
1 in Maryland, 1 in Missouri, and 1 in Wisconsin).” As of April 14, 2018, the Illinois
Department of Public Health had received reports of 126 cases in eleven different
counties across the state, including three deaths. According to an Illinois Health
Department report, samples of synthetic marijuana have tested positive for brodifacoum,
a lethal anticoagulant often used as a rodenticide, or rat poison. As of May, 2018, two
similar cases have been reported in Hillsborough County Florida according to a report
from the Hillsborough County Health Department.
The Florida Medical Examiners Commission reports that when the first six months of 2017
are compared with the same time period in 2016, occurrences of synthetic cathinones
11increased by 38 percent (18 more) and deaths caused by cathinones increased by 55
percent (11 more). Figure 3 shows that after a marked drop in early 2016, deaths involving
cathinones appear again to be increasing slightly.
160
Offically Caused Present in System
140
Cathinone-Related Deaths
120
100 75
80
60 64
73
53 32 34
40 45
28 59 21
20 31
19 25 20 29
14 17 17
0
1H 2H 1H 2H 1H 2H 1H 2H 1H
2013 2013 2014 2014 2015 2015 2016 2016 2017
Figure 3 – Synthetic Cathinone Deaths in Florida: Jan 2013 – June 2017
FDLE – Drugs Identified in Deceased Persons by Florida Medical Examiners 2017 Interim
Report
Opioids
This broad category of drugs includes those derived directly from opium, often called
opiates, (e.g. morphine, codeine) as well as semi-synthetic drugs such as oxycodone and
hydrocodone, and completely synthetic drugs like fentanyl and its analogs many of which
fit the definition of NPS noted above.
Overall occurrences of every opioid except Methadone increased in Medical Examiners
Reports between the first six months of 2016 and the same time period in 2017. Most of
these increases ranged between 1% and 30%. Alarmingly, overall occurrences of fentanyl
analogs, a particularly powerful and deadly opioid increased by 383% (from 181 to 875)
when the two time periods were compared.
Figure 4 illustrates deaths considered by Florida Medical Examiners to have been caused
by various opiates. Fentanyl analogs (depicted with a green line starting in 2016) accounted
for much of the overall increase in opioid-caused deaths in Florida from the first half of 2016
to the first half of 2017. Of 875 occurrences, these drugs were considered the cause of
death in 840 cases (96% of occurrences) in 2017 versus 149 deaths in 2016, an increase
of 563%. By contrast, heroin is considered the cause of death for 93% of deaths in cases
where it occurs.
12Figure 4 – Lethal Opioid Occurrences* Among Deceased Persons in Florida
FDLE – Drugs Identified in Deceased Persons by Florida Medical Examiners 2008 - 2017
Interim and Annual Reports
Prescription opioids
Figure 5 shows the trajectory of prescription opioids from 2005-2017 (estimated based on
first six months of 2017) identified in deceased persons by Florida Medical Examiners. This
excludes deaths from substances such as heroin and fentanyl analogs which are never
prescribed. Figure 5 shows a leveling-off of deaths from prescription opioids based on a
projection of data for the first six months of 2017 to the entire year.
*Estimated
Figure 5 – Nonmedical Rx Opioids (excluding Fentanyl Analogs) Occurrences Detected among Florida
Decedents
FDLE – Drugs Identified in Deceased Persons by Florida Medical Examiners 2005-2017 Interim
and Annual Reports
13Fentanyl analogs
In contrast to Figure 5, Figure 6 includes all opioids (including fentanyl analogs) except
heroin. Figure 6 shows that, when fentanyl analogs are included, the current rate of
increase in opioid deaths seems to have caught up with the 2011-2013 trajectory that
existed prior to Florida’s passage of laws and regulations for opioid misuse and these
deaths are increasing at a rapid rate.
Figure 6 – Nonmedical Rx Opioids (Including Fentanyl Analogs) Occurrences Detected among Florida
Decedents
FDLE – Drugs Identified in Deceased Persons by Florida Medical Examiners 2005 - 2017
Interim and Annual Reports
The death rate for fentanyl analogs during the first six months of 2017 was 4.29 per 100,000
population statewide, but, as shown in Figure 7, regional rates varied considerably across
the state ranging from a low of 1.34 deaths per 100,000 population in the Northwest region
to a high of 8.13 deaths per 100,000 in the Southeast region. Of the state’s 25 Medical
Examiner Districts, five reported more than 50 deaths from fentanyl analogs: Jacksonville
(77), Miami (79), Sarasota (111), Ft. Lauderdale (132) and West Palm Beach (181).
14Figure 7 – Fentanyl Analog Deaths per 100,000 Population in Florida January – June 2017
FDLE – Drugs Identified in Deceased Persons by Florida Medical Examiners 2017 Interim
Report
Heroin
The Florida Medical Examiners Commission reported that there were 1,023 heroin-related
deaths across Florida in 2016 representing a 31% increase over the 779 such deaths in
2015 and a 228% increase over the 447 such deaths in 2014. This reflects nearly 18 times
as many heroin-related deaths compared to 56 heroin deaths statewide in 2011. This
dramatic rate of increase began in 2014 and appears to continue into 2017, but with a
slightly lower estimated trajectory based on estimates from the first six months of data.
(Figure 8). Heroin was considered a cause of death in 93% of the heroin deaths in 2016
and the first half of 2017 though the vast majority of decedents also had other drugs such
as alcohol or stimulants in their system.
15Figure 8 – Number of Heroin-related Deaths
FDLE – Drugs Identified in Deceased Persons by Florida Medical Examiners 2005-2017 Interim
and Annual Reports
Increased heroin deaths since 2013 appear to be affecting most regions of the state as
shown in Figure 9. However, both the Florida Medical Examiner data and treatment
admission data discussed below suggest that the heroin problem has been less severe in
the Northwest region despite a recent increase in heroin deaths in that region.
Figure 8 – Number of Heroin-Related Deaths by FL Management Regions
FDLE – Drugs Identified in Deceased Persons by Florida Medical Examiners 2005-2017 Interim
and Annual Reports
16Table 1 shows statewide data on opioid deaths for five 6-month periods starting with the
first six months of 2015. While many of the opioids included in the table show increases,
the most striking increases are for fentanyl and fentanyl analogs. Morphine may be
detected as a metabolite of other opioids such as heroin or fentanyl.
Table 1. Deaths with Occurrences of Various Opiates
Source: FDLE – FL Medical Examiners Commission Reports
Cocaine
As reflected in Figure 10, Florida Medical Examiners Commission data reported between
2002 and 2018 indicates that the relatively steady decline in Florida cocaine deaths from
2007 to 2010 stabilized through 2013. However, cocaine deaths have increased since 2013
with a particularly abrupt increase from 2015 to the estimated total for 2017 (more than
double the 2013 rate).
17*Estimated
Figure 9 – Cocaine Deaths in Florida
FDLE – Drugs Identified in Deceased Persons by Florida Medical Examiners 2005-2017
Interim and Annual Reports
This increase in cocaine deaths may be linked to poly-drug use particularly with opioids.
Cocaine laced with deadly fentanyl analogs was identified in Florida in 2016 and has
become more prevalent in the past year. There were 2,882 cocaine-related deaths in
Florida in 2016, an increase of over 1,000 deaths from the preceding year. Projected 2017
deaths, (based on first six months data published in April 2018) are 3,168 with other drugs
present in the decedent’s system 87% of the time.
According to the Florida Medical Examiners Commission 2017 Interim Report, cocaine was
considered the cause of death in 65% of the first six-month 2017 cocaine deaths. Nearly
two-thirds of the cocaine deaths (64%) occurred among those aged 35 and older; less than
1% (n=10) of the first-half 2017 cocaine decedents were under 18 years of age.
Based upon Fiscal Year 2016-2017 state-funded treatment admissions data from DCF,
primary addiction treatment admissions for cocaine (crack or other) totaled 5,286 patients
in Florida - accounting for 7% of all publicly funded admissions. Of those admissions, males
accounted for 52% of these clients. Crack cocaine was specified by 61% of all the cocaine
patients. Fifty-five or 1% of the admissions were for someone under 18 years of age, 12%
were 18-25, 28% were 26-34 and 59% were age 35 or older. Smoking cocaine was the
route of administration reported by 54% of the cocaine clients with intranasal sniffing cited
by 31% and 5% reported injecting cocaine. The remaining 10% reported oral or other or
unknown routes of administration. Again, these numbers reflect individuals admitted to
DCF-funded treatment facilities only.
18Methamphetamine/Amphetamines
For a decade, the DEA has reported that most methamphetamine is produced in
clandestine laboratories outside the United States, especially in Mexico, and smuggled into
the country. In Florida, the Florida Medical Examiners Commission has found that
indicators of methamphetamine have been increasing since 2011 with deaths related to the
drug escalating more rapidly since 2015. If data for the first six months of 2017 are
expanded to the entire year, this number seems likely to increase to 828 deaths for 2017
(Figure 11). Florida Medical Examiners considered methamphetamine the cause of death
in 51% (n=213) of the 414 cases in the first six months of 2017. A breakout of
methamphetamine-related deaths by counties or state managing entity regions is not
available (Florida Medical Examiners Commission 2017 Interim Report).
*Estimated
Figure 10 – Number of Methamphetamine-Related Deaths in Florida: 2000-2017*
FDLE – Drugs Identified in Deceased Persons by Florida Medical Examiners 2005-2017 Interim
and Annual Reports
The Florida Medical Examiners Commission also reported 640 instances of amphetamines
detected among decedents across Florida in 2016 which was a 65% increase from the 387
such occurrences in 2015. Projected deaths for 2017 (based on first six-month data from
the Interim report) are 800. Amphetamine was considered the cause of death in 29% of
the cases in the first six months of 2017. (Florida Medical Examiners Commission 2017
Interim Report released in 2018).
Some have suggested that, viewed collectively, stimulant drugs (cocaine, cathenones,
amphetamines and methamphetamine) represent a growing epidemic. Figure 12
combines data on deaths in Florida caused by these classes of stimulants over the past
19five years. It clearly shows that, with the exception of cathinones, the number of stimulant-
caused deaths has increased dramatically.
*Estimated
Figure 11 – Stimulant-caused Deaths in Florida, 2013-2017*
FDLE – Drugs Identified in Deceased Persons by Florida Medical Examiners 2005-2017 Interim
and Annual Reports
Benzodiazepines
Benzodiazepines, in general, and specifically alprazolam (Xanax®), continue to pose a
substantial problem across Florida, particularly when used non-medically in combination
with other pharmaceuticals, alcohol, and illicit drugs. Figure 13, illustrates this growth based
on data from Florida Medical Examiners Commission reports covering time periods from
2005 to June 2017. There were 5,167 reports of a benzodiazepine present in deceased
persons across Florida in 2016 but projected deaths for 2017 appear to be down slightly.
Of the benzodiazepine occurrences in the first half of 2017 reported by Florida Medical
Examiners, 26.2% were considered “a cause of death.”
20*Estimated
Figure 12 – Number of Nonmedical Rx Benzodiazepine Reports Detected among Deceased Persons in
Florida 2005 – 2017*
FDLE – Drugs Identified in Deceased Persons by Florida Medical Examiners 2005-2017
Interim and Annual Reports
21SECTION III. EPIDEMIOLOGIC INFORMATION FROM PUBLIC TREATMENT DATA
Data on publicly funded treatment for substance abuse can be useful in understanding
regional differences in the relative not overall - prevalence of use of various substances.
However, there are limitations: (1) these data only represent individuals treated in publicly
funded programs, therefore capturing a smaller proportion of all persons seeking
treatment in more affluent communities; and (2) the overall availability of spaces in
publicly funded treatment may result in numbers that underestimate the severity of
substance abuse. Despite these limitations, data on persons in publicly funded treatment
may allow comparisons about the relative demand for treatment for various substances
across regions of the state.
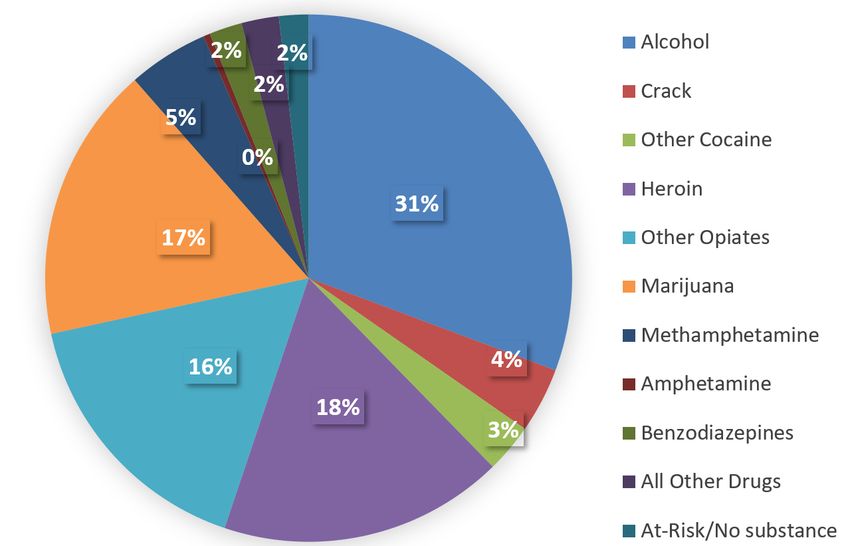
Figure 14 shows the overall distribution of admissions to treatment in publicly funded
programs in Florida from July 1, 2016 to June 30, 2017. Treatment for alcohol represents
the largest share of admissions with treatment for marijuana, heroin, and other opiates
also accounting for large portions of admissions. Treatment for crack cocaine, other
cocaine, methamphetamines and other amphetamines accounted for much smaller
proportions of statewide admissions.
87,840 Admissions
Figure 13 – Statewide Primary Admissions to Publicly Funded Treatment 2016-17
FDLE – Drugs Identified in Deceased Persons by Florida Medical Examiners, 2017 Interim
Report
The data for the Northwest Region (Figure 15) contrast rather markedly with the statewide
data. While alcohol treatment is still the most frequent reason for admission, and
marijuana the second most frequent in the Northwest, the proportion admitted for heroin
and other opiates is much smaller and the proportions admitted for crack cocaine and
methamphetamines are larger than the statewide proportions. This region has by far the
largest proportion of treatment admissions form methamphetamines of any region in the
22state. Low rates of admission for opioids are consistent with the Medical Examiners data
reported in previous sections of this document.
11,995 Admissions
Figure 14 – Northwest Region Primary Admissions to Publicly Funded Treatment 2016-17
FDLE – Drugs Identified in Deceased Persons by Florida Medical Examiners, 2017 Interim
Report
The Northeast region more closely approximates the state data. Most notable is a smaller
proportion of admissions for heroin relative to the state.
15,334 Admissions
Figure 156 – Northeast Region Primary Admissions to Publicly Funded Treatment 2016-17
FDLE – Drugs Identified in Deceased Persons by Florida Medical Examiners, 2017 Interim
Report
23In contrast, the Central region (Figure 17) has a very high proportion of opioid admissions,
especially heroin, and a smaller proportion devoted to marijuana than the state or other
regions.
12,615 Admissions
Figure 17 – Central Region Primary Admissions to Publicly Funded Treatment 2016-17
FDLE – Drugs Identified in Deceased Persons by Florida Medical Examiners, 2017 Interim
Report
Like the Northeast Region, the substance use treatment admissions by drug type for the
Suncoast Region closely approximate the proportion of admissions for the state as a
whole.
26,615 Admissions
Figure 16 – Suncoast Region Primary Admissions to Publicly Funded Treatment 2016-17 *
FDLE – Drugs Identified in Deceased Persons by Florida Medical Examiners, 2017 Interim
Report
24The Southeast region is notably dominated by treatment for alcohol, opioids, heroin and
marijuana, with only a tiny proportion of admissions relating to users of amphetamines
(see Figure 19). The contrast between this region and the Northwest Region depicted in
Figure 15 is notable.
9,842 Admissions
Figure 17 – Southeast Region Primary Admissions to Publicly Funded Treatment 2016-17
FDLE – Drugs Identified in Deceased Persons by Florida Medical Examiners, 2017 Interim
Report
The Broward district has a larger than typical proportion of admissions related to crack
cocaine compared to the state or most other regions. However, the Southern region
reports the largest proportion of admissions related to this substance. This region also
has the largest proportion of admissions related to other cocaine, but a very small
proportion related to heroin or other opiates.
255,153 Admissions
Figure 18 – Broward Region Primary Admissions to Publicly Funded Treatment 2016-17
FDLE – Drugs Identified in Deceased Persons by Florida Medical Examiners, 2017 Interim
Report
6,286 Admissions
Figure 21– Southern Region Primary Admissions to Publicly Funded Treatment 2016-17 *
FDLE – Drugs Identified in Deceased Persons by Florida Medical Examiners, 2017 Interim
Report
In summary, treatment admission data support the notion that some drugs impact
different regions differentially, with crack and cocaine more prevalent in the southern parts
of the peninsula and methamphetamines a larger problem in the western Panhandle.
Other drugs such as alcohol and marijuana account for a large proportion of admissions
everywhere in the state.
26SECTION IV. SUMMARY
In summary, population survey data on youth alcohol and tobacco use and initiation
continued to show long-term declines in self-reported lifetime use and current use.
However, the most recent data from Monitoring the Future shows a slight increase in “any
alcohol use” among the 8th graders that they studied. As 2018 FYSAS data become
available in the autumn of 2018 it will be important to assess whether this age group in
Florida maintains past reductions in alcohol use.
Cigarette smoking is at an all-time low among Florida youth. However, nearly three times
as many students reported e-cigarettes/vaping in 2017 versus cigarette smoking. Future
data can help to assess whether this habit is a substitute for cigarette smoking or a
prelude to adult smoking as a result of nicotine in vaping products.
Adult alcohol use is a persistent problem statewide as shown in autopsy data and
treatment admissions data. Poly-drug use is prevalent in Florida as demonstrated by the
much higher number of drug occurrences versus total drug deaths in the first half of 2017.
It is important to note that alcohol-related deaths often include alcohol and other drugs of
abuse.
Florida’s serious opioid problem continued through the middle of 2017 with fentanyl
analogs and heroin particularly lethal. According to data trends, some shifting has
occurred from prescription opiates to heroin and illicit opioids as the cause of opioid
deaths as prescribing practices restrict medical access to opioids. It will be important to
continue to monitor these changes to understand the effects of recent laws and
regulations passed in response to this crisis.
Cocaine deaths are again on the rise in Florida and, nationally, concerns have been
expressed about rising harms from the broad class of stimulant drugs including cocaine,
amphetamines and methamphetamine. This concern appears accurate given Florida’s
recent trends in stimulant-caused deaths
Benzodiazepines continue as a cause of accidental deaths in Florida, particularly among
adults who may be using them in combination with other drugs.
Monitoring of substance use with survey data from the FYSAS, FYTS, NSDUH and
BRFSS, and continued examination of data on treatment admissions and drug-related
deaths is crucial to understanding the changing impact of substance use on the state and
its regions.
27REFERENCES
Bureau of Economic and Business Research, Florida Estimates of Population 2017.
https://www.bebr.ufl.edu/sites/default/files/Research%20Reports/estimates_2017.pdf.
Centers for Disease Control and Prevention. Behavioral Risk Factor Surveillance System.
Prevalence and Trends Data Online.
Centers for Disease Control and Prevention, Fact Sheets – Binge Drinking, 2017.
Centers for Disease Control and Prevention: 2003 to 2015 Youth Risk Behavior
Surveillance System (YRBSS) bi-annual Surveys.
Federal Register, Schedules of Controlled Substances: Temporary Placement of
Mitragynine and 7-Hydroxymitragynine into Schedule I, 2016.
Florida Department of Children and Families: Florida Youth Substance Abuse Surveys
2000 – 2017 and Florida Youth Tobacco Surveys 2006 – 2017.
Florida Department of Law Enforcement: Florida Medical Examiners Commission Annual
Reports on Drugs Detected in Deceased Persons in Florida 2010 – 2016.
Florida Department of Law Enforcement: Drugs Identified in Deceased Persons by
Florida Medical Examiners, 2017 Interim Report
Florida Department of Children and Families: Substance Abuse Treatment Admissions
by Primary Drug for FY 2016-2017 from Substance Abuse and Mental Health Information
System (SAMHIS)
Florida Department of Law Enforcement: Statewide Judicial Circuit Arrest Report January
- December 2016.
Johnston, L. D., Miech, R. A., O'Malley, P. M., Bachman, J. G., Schulenberg, J. E., &
Patrick, M. E. (2018). Monitoring the Future national survey results on drug use, 1975-
2017: Volume II, college students and adults ages 19-55.
Johnston, L. D., Miech, R. A., O’Malley, P. M., Bachman, J. G., Schulenberg, J. E., &
Patrick, M. E. (2018). Monitoring the Future national survey results on drug use: 1975-
2017: Overview, key findings on adolescent drug use. Ann Arbor: Institute for Social
Research, The University of Michigan.
Substance Abuse and Mental Health Administration, Key Substance Use and Mental
Health Indicators in the United States: Results from the 2016 National Survey on Drug
Use and Health, 2017.
28Substate Estimates from the 2012-2014 National Survey on Drug Use and Health
(NSDUH).
U.S. Drug Enforcement Administration, Colombian Cocaine Production Expansion
Contributes to Rise in Supply in the United States, 2017
U.S. Drug Enforcement Administration, Fentanyl; A Briefing Guide for First Responders,
2017.
U.S. Food and Drug Administration, Statement from FDA Commissioner Scott Gottlieb,
M.D. on FDA advisory about deadly risks associated with kratom, November, 2017.
U.S. Substance Abuse and Mental Health Administration: Comparison of 2014-2015 and
2015-2016 Population Percentages (50 States and the District of Columbia) National
Survey on Drug Use and Health (NSDUH).
29You can also read