A geophone-based and low-cost data acquisition and analysis system designed for microtremor measurements - GI
←
→
Page content transcription
If your browser does not render page correctly, please read the page content below
Geosci. Instrum. Method. Data Syst., 9, 365–373, 2020
https://doi.org/10.5194/gi-9-365-2020
© Author(s) 2020. This work is distributed under
the Creative Commons Attribution 4.0 License.

A geophone-based and low-cost data acquisition and analysis system
designed for microtremor measurements
Ozkan Kafadar
Department of Computer Programming, Kocaeli University, 41140 Kocaeli, Turkey

Correspondence: Ozkan Kafadar (okafadar@kocaeli.edu.tr)

Received: 27 April 2020 – Discussion started: 26 May 2020
Revised: 22 July 2020 – Accepted: 29 July 2020 – Published: 4 September 2020

Abstract. The commercial data acquisition instruments de-          1   Introduction
signed for three-component microtremor measurements are
usually very expensive devices. In this paper, a low-cost,         The fundamental principle of seismic methods is based on
computer-aided, and geophone-based system designed to              the recording of seismic waves generated by natural or syn-
record, monitor, and analyze three-component microtremor           thetic sources. There are two types sensors, called velocime-
data is presented. This proposed system is not a simple data       ters and accelerometers, with different bandwidths and sens-
acquisition system. It is also an integrated system devel-         ing mechanisms to measure these seismic oscillations. These
oped to interpret the microtremor data using the horizontal-       sensors measure the ground motion as velocity and accel-
to-vertical spectral ratio (H / V) method without any exter-       eration and convert the ground motion into a measurable
nal software. Therefore, the H / V peak frequency and am-          electrical signal. Accelerometers are electromechanical de-
plitude can be easily estimated using this system. The pro-        vices, which measure acceleration, and are generally used for
posed system has several features such as a 200 Hz sam-            specific purposes such as vibration and inclination measure-
pling frequency, approximately 72 dB dynamic range, text           ments. On the other hand, geophones are velocimeters, which
data format, and data analysis tools. This system consists of a    are often preferred in local seismic applications because of
graphical user interface developed by using the .NET Frame-        their excellent reliabilities and high sensitivities. Accelerom-
work 4.5.2 and external hardware that includes signal con-         eters are generally less sensitive than velocimeters and are
ditioning circuits, voltage converter circuit, external analog-    also used in strong ground motion measurements. Broad-
to-digital converter, and Arduino Uno board. The proposed          band velocimeters have a larger passband than geophones
system uses low-cost vertical and horizontal geophones with        and can measure ground motions with frequencies ranging
a 4.5 Hz natural frequency to measure three-component mi-          from 0.001 to 500 Hz. Classical short-period velocimeters
crotremor data. The developed software undertakes many             are constituted by three orthogonally mounted geophones
tasks such as communication between the external hard-             that have natural frequencies of a few hertz. Data acquisition
ware and computer, transferring, monitoring, and recording         systems are needed to digitize the analog signals detected by
the seismic data to the computer, and interpretation of the        these sensors and to store them in a data storage device. Re-
recorded data using the Nakamura method. Channel consis-           cently, many studies have been performed to design seismic
tency and internal noise measurement tests were performed          data acquisition systems. In a study by Khan et al. (2012), a
to demonstrate the accuracy and precision of the proposed          software component was developed to digitize analog seis-
system. The proposed system was compared to a commer-              mic signals using the computer sound card. Llorens et al.
cial triaxial digital seismograph, and satisfactory results were   (2016) designed a simple data acquisition system for record-
obtained. The developed system is a completely open-source         ing seismic data detected by the vertical geophone to an ex-
and open-hardware system and can be easily used in aca-            ternal SD card. In a previous study, we developed hardware
demic studies conducted by researchers and university stu-         and software for the seismic refraction method (Kafadar and
dents who are interested in seismic ambient noise analysis.        Sertcelik, 2016). In another study, hardware was designed for
                                                                   recording seismic noise (Llorens et al., 2018).

Published by Copernicus Publications on behalf of the European Geosciences Union.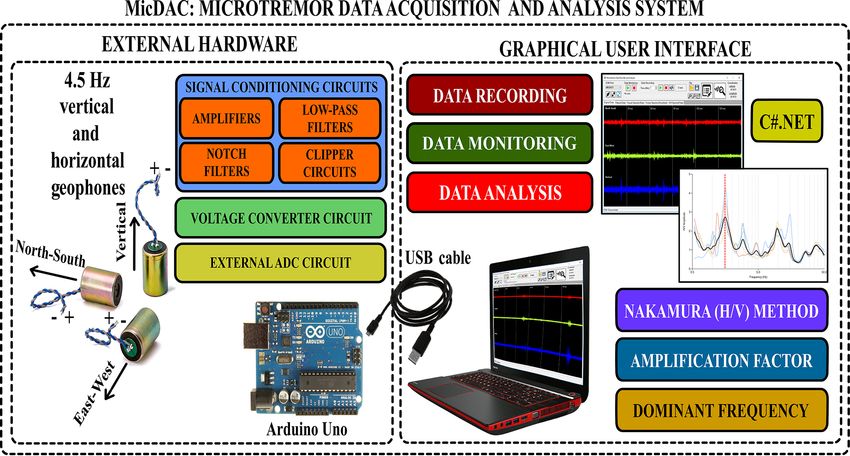
366                                                               O. Kafadar: A geophone-based and low-cost data acquisition

   In this paper, a low-cost, computer-aided, and Arduino-           are applied to each selected time window. The recorded mi-
based three-component microtremor measurement and anal-              crotremor data are generally split into shorter time windows
ysis system (MicDAC) is presented. In the literature, there          before starting the analysis process. It is a standard practice
are many data acquisition and analysis systems developed             to multiply these windows by a taper before performing a
using Arduino boards for scientific purposes (Llorens et al.,        Fourier spectrum. The cosine tapers are usually preferred in
2016; Fisher and Gould, 2012; Huang et al., 2018; Puente             seismic data analysis. They minimize the discontinuity effect
et al., 2017). MicDAC is controlled through a user-friendly          between the ends of the time series (Percival and Walden,
graphical interface (MicDAC-GUI) developed by using the              1993).
Microsoft .NET Framework 4.5.2 platform and C# language.                Raw spectra contain many frequency samples. Konno–
MicDAC is not a simple digitizer. It is an analysis tool that        Ohmachi smoothing is widely used to smooth the Fourier
can interpret recorded ambient noise using the Nakamura              spectrum (Konno and Ohmachi, 1998). This process is not
method (Nakamura, 1989), and it can calculate the two pa-            mandatory but is strongly recommended. In this study, the
rameters (H / V peak frequency and amplitude) most impor-            quadratic mean is used to calculate the average of two hori-
tant in designing earthquake-resistant structures. This study        zontal components. The SESAME (Site Effects Assessment
is completely different from the literature since the proposed       using Ambient Excitations) project is the most comprehen-
system does not require any external software. It can display        sive study performed to interpret H / V curves (SESAME,
the calculated Fourier spectra for three-component ambi-             2004). In the SESAME report, the required conditions to in-
ent noise in real time. This feature provides pre-information        terpret the H / V curves correctly are described in detail.
about the frequencies of ambient noise in the survey area be-
fore starting measurements.
                                                                     3     System architecture and design

2   Horizontal-to-vertical spectral ratio (H / V) method             MicDAC consists of a developed graphical user interface
                                                                     and external hardware that includes amplifiers, low-pass and
Except for earthquakes and seismic explosions, the vibra-            notch filter circuits, clipper circuits, voltage converter circuit,
tional movements of the Earth that occur naturally (winds,           external analog-to-digital converter, and Arduino Uno board.
oceanic waves, and geothermal reactions) or artificially (traf-      The graphical abstract of MicDAC is shown in Fig. 1. The
fic and industrial machines) with periods that do not ex-            designed external hardware is connected to the computer via
ceed a few minutes are called microseisms (Katz, 1976). The          a USB. It utilizes the USB port as a power supply. Thus, no
term microtremor is used for periods ranging between 0.05            external battery is required.
and 2 s. In other words, microtremors are low-amplitude (1–
10 µm) and low-frequency (0.5–20 Hz) oscillations. There-            3.1    Hardware implementation
fore, broadband seismometers are used to measure these seis-
mic waves.                                                           The vertical and horizontal geophones manufactured by the
   Microtremors have been classified by some researchers.            EGL Company were used to measure three-component mi-
According to Aki (1957) and Frantti (1963), microtremors             crotremor data. They have some characteristic features such
are surface waves. Other researchers claim that microtremors         as a natural frequency of 4.5 ± 10 % Hz, typical spurious
are body waves (Kanai, 1962; Douze, 1964). In general, sur-          frequency greater than 150 Hz, damping of 0.6 ± 5 %, and
face sources such as wind, ocean waves, and cultural noise           open circuit sensitivity of 28.8±5 % V m−1 s−1 . The external
generate surface waves, whereas naturally occurring Earth            view, amplitude response, and phase response of these geo-
tremors with an extremely small amplitude generate body              phones are shown in Fig. 2. There are also geophones with
waves (Weller, 1974).                                                lower frequency on the market, but the price of these instru-
   The horizontal-to-vertical spectral ratio (H / V) technique       ments increases exponentially with decreasing frequencies.
proposed by Nakamura (1989) is one of the most popu-                 Moreover, the cost of high-quality broadband seismometers
lar methods developed for the analysis of microtremor data.          can reach a mid-level car price. For this reason, in this paper a
This method, based on single-station microtremor data anal-          low-cost hardware–software device is presented to both mea-
ysis, can easily minimize the source effect by normalizing           sure and interpret three-component microtremor data. The
the horizontal spectral amplitude with the vertical spectral         estimated costs of the electronic components of the designed
amplitude. The first step to evaluate microtremor data us-           external hardware in this study are presented in Table 1. The
ing the H / V technique is to remove the offsets for each            total cost of the hardware, including the sensors, is approxi-
seismic component. This process is performed by subtract-            mately EUR 255.
ing the mean value of signals from each time-domain signal              The output of a geophone consists of two poles, and its
in seismic data. Optionally, a low-pass filter can be applied        output voltage is too weak to be recorded without amplifica-
to the recorded signal to remove the high-frequency compo-           tion. The voltage difference between these poles can be mea-
nents. Then, tapering and fast Fourier transform operations          sured by using various operational amplifiers. The first stage

Geosci. Instrum. Method. Data Syst., 9, 365–373, 2020                                       https://doi.org/10.5194/gi-9-365-2020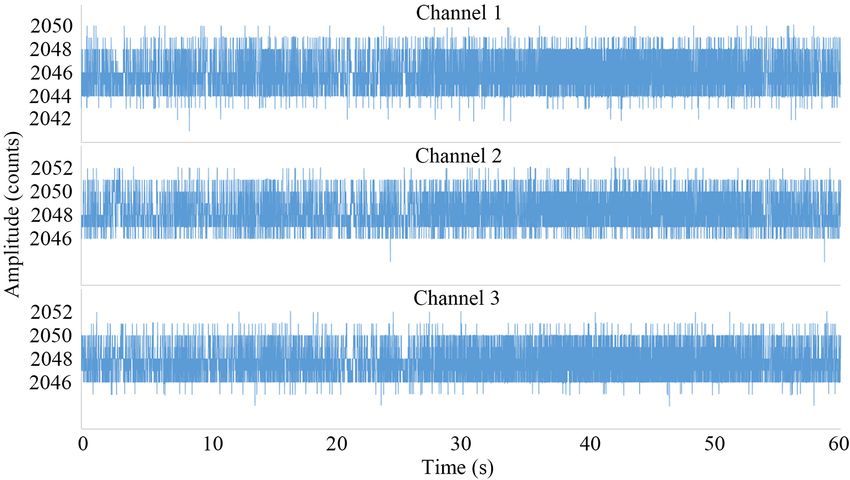
O. Kafadar: A geophone-based and low-cost data acquisition 367
Figure 1. Graphical abstract of the proposed system for measurement and analysis of three-component microtremor data.
Table 1. List of the electronic components.
Components Source Total Cost (EUR)
4.5 Hz vertical geophone Sentez System ×1 65.0
4.5 Hz horizontal geophone Sentez System ×2 70.0
Arduino UNO + USB cable Int-El Electronic ×1 21.0
ICL7660 DC-DC converter Int-El Electronic ×1 1.0
INA122 instrumentation amplifier Int-El Electronic ×3 5.5
OP07CP operational amplifier Int-El Electronic ×3 0.3
MCP3208 12 bit ADC Int-El Electronic ×1 3.0
Resistor, capacitor, diode, potentiometer, DIP switch, Int-El Electronic 4.0
connector, jumper cable, crocodile cable
Breadboard Int-El Electronic ×3 1.1
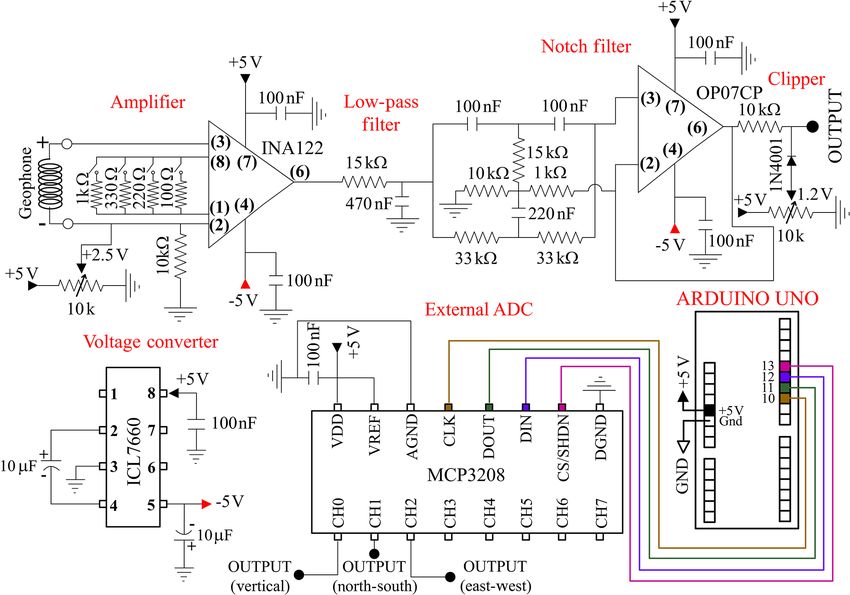
of this signal conditioning circuit consists of differential- channel thanks to the DIP switch and resistors connected to
input and single-output INA122 amplifiers from Texas In- pins 1 and 8 of the INA122 amplifiers.
struments (1997). These amplifiers are instrumentation am- The next step in the external hardware is a passive RC
plifiers with
√ very important properties such as low-noise (resistor–capacitor) low-pass circuit, which is used to atten-
(60 nV / Hz), high-quality, and rail-to-rail output, wide uate the high-frequency components in the amplified signal
power supply range (single supply: 2.2 to 36 V, dual sup- and to avoid the aliasing phenomenon. The cutoff frequency
ply: −0.9/+1.3 to −18/+18 V), low offset voltage (250 µA of the low-pass filter was set at approximately 22 Hz because
max), and low quiescent current (60 µA). the corresponding frequency range in microtremor studies is
In this study, symmetrical power supplies (±5 V) were 0–20 Hz. In the last stage of the signal conditioning circuits,
used to supply these amplifiers. The Arduino Uno board can the Twin-T notch filters and clipper circuits were used to re-
only provide 3.3 and 5 V positive outputs. For this reason, move the 50 Hz interferences and to clip the negative voltage
the ICL7660 integrated circuit was used to obtain the neg- in the output signal, respectively (Fig. 3). Instead of the inter-
ative power supply (−5 V) from the positive power supply nal 10 bit analog-to-digital converter on the Arduino board,
(+5 V). The pin connections of the ICL7660 voltage con- the MCP3208 12 bit external analog-to-digital converter was
verter and INA122 amplifier are shown in Fig. 3. It can be set preferred to ensure higher-resolution signals.
to four different gain levels (46, 56, 60, and 66 dB) for each
https://doi.org/10.5194/gi-9-365-2020 Geosci. Instrum. Method. Data Syst., 9, 365–373, 2020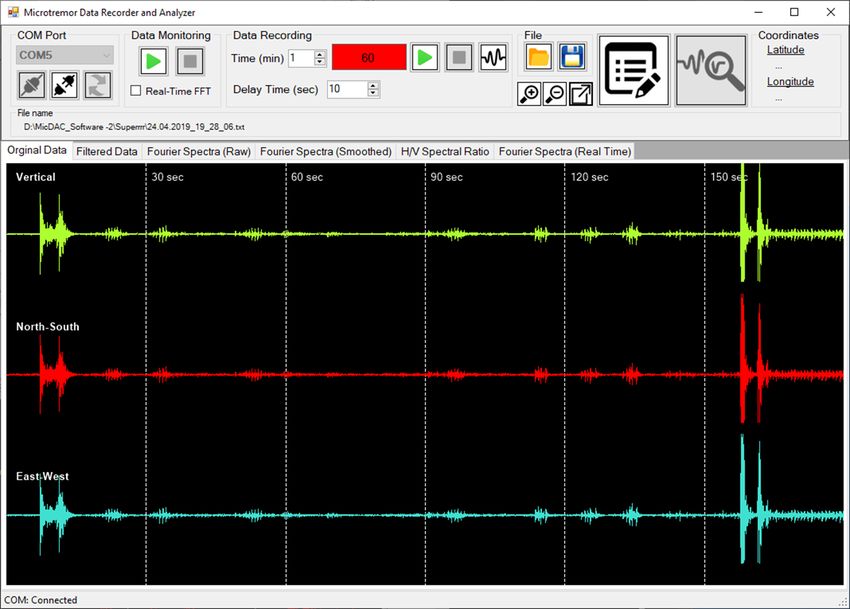
368                                                                O. Kafadar: A geophone-based and low-cost data acquisition

Figure 2. For the geophones with a 4.5 Hz natural frequency, (a) external view, (b) amplitude response, and (c) phase response.

Figure 3. Schematics of external hardware and pin connections.

3.2   Software implementation                                           starting the recording operation. In addition, this mode is also
                                                                        used to adjust the offset needed to see signals symmetrically
                                                                        through the 10 K potentiometer, a component of the external
The MicDAC sketch (Arduino uses the term sketch for a pro-
                                                                        hardware (Fig. 3). The data recording mode is used to record
gram) was compiled with Arduino version 1.8.8 and stored
                                                                        three-component microtremor data during the desired time.
as a file called MicDAC.ino. This sketch digitizes seismic
                                                                           The MicDAC-GUI allows for performing records with a
data with a 200 Hz sampling frequency and transfers the dig-
                                                                        maximum of 180 min. When the recording operation ends,
itized data to the computer via USB. The second program
                                                                        the user is alerted with an alarm and the temporary data are
(MicDAC-GUI), developed by using .NET Framework 4.5.2
                                                                        saved into a file called “datam.txt”. The microtremor data are
in C# language, is a user-friendly and Windows operating-
                                                                        stored in a text file. This data file consists of three columns:
system-based software. The MicDAC-GUI consists of data
                                                                        V (vertical), NS (north–south), and EW (east–west) compo-
monitoring mode, data recording mode, and analysis tools.
                                                                        nents. The recorded signal values vary in the range between
It detects the available COM ports automatically. The data
                                                                        0 and 4095 because the analog-to-digital converter is 12 bit.
monitoring mode is used to display three-component mi-
crotremor data in real time and to test the geophones before

Geosci. Instrum. Method. Data Syst., 9, 365–373, 2020                                           https://doi.org/10.5194/gi-9-365-2020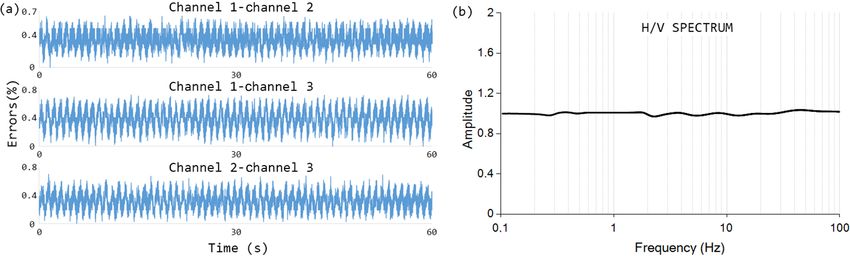
O. Kafadar: A geophone-based and low-cost data acquisition                                                                                369

Figure 4. (a) Error percentage of difference signal estimated during the first channel consistency test; (b) H / V spectral ratio.

The coordinates of the survey area and descriptions are stored             Table 2. H / V peak frequencies and amplitudes calculated from the
in a file with info extension.                                             data recorded simultaneously by GeoBox and MicDAC.
   The MicDAC-GUI allows many operations such as low-
pass filtering, tapering, windowing, and smoothing on the                                                         GeoBox      MicDAC
recorded data. The desired signals can be selected thanks                          H / V peak frequency (Hz)        3.5034       3.4919
to the windowing feature of the MicDAC-GUI. The win-                               H / V peak amplitude             8.8663       8.9264
dow length (10.24, 20.48, 40.96, 81.92, and 163.83 s) is a
user-defined parameter. The time duration of the analysis
process increases or decreases depending on the number of
                                                                           were calculated. As shown in Fig. 4a, the error percentages
enabled time windows and data length. The frequency dis-
                                                                           of the difference signals (channel 1–channel 2, channel 1–
tribution of each window is displayed separately. This fea-
                                                                           channel 3, and channel 2–channel 3) are lower than 1 %. The
ture gives an idea about the windows that will be used in
                                                                           H / V ratios were calculated using the same sinusoidal sig-
the analysis. Finally, the horizontal-to-vertical spectral ratios
                                                                           nals recorded by three channels and presented in Fig. 4b. The
for each selected time window are calculated. The calculated
                                                                           H / V ratio will be equal to 1 because the same sinusoidal
H / V spectral ratios are also numerically displayed using a
                                                                           signals were applied to each channel input.
grid component. After the analysis process ends, the param-
                                                                              Secondly, a channel consistency test was conducted with
eters (cutoff frequency of low-pass filter, taper ratio, length
                                                                           real sensors. For this purpose, the same vertical geophone,
of time window, bandwidth of Konno–Ohmachi smoothing
                                                                           placed on a table, was connected to the inputs of each chan-
function), raw data, low-pass-filtered data, Fourier amplitude
                                                                           nel and the ambient noise was recorded over a period of
spectra data, smoothed Fourier amplitude spectra data, and
                                                                           180 s (Fig. 5). In this test, the calculated Fourier spectra
H / V spectra data are saved into a text file with the “soln”
                                                                           were utilized to demonstrate the frequency contents of three
extension.
                                                                           channels. The calculated Fourier spectra and H / V ratio are
                                                                           shown in Fig. 6a and b, respectively.
3.3   The reliability and accuracy tests of MicDAC                            In the next test, the internal noise of MicDAC was
                                                                           recorded during a time period of 60 s with a 200 Hz sam-
Three tests were performed in order to demonstrate the accu-               pling frequency (Fig. 7). The noise levels of three chan-
racy and precision of MicDAC: (1) channel consistency tests                nels were observed as approximately ±3 counts (7.3242 mV,
using synthetic and real data; (2) internal noise measurement              9.39 × 10⁻⁵ m s−1 ).
test; and (3) comparison of the characteristics and frequency                 Finally, MicDAC was compared with a triaxial digital seis-
contents of recorded signals using the proposed system and                 mograph called GeoBox manufactured by SARA Electronic
a commercial microtremor measurement device.                               Instruments. GeoBox is an instrument designed especially
   The channel consistency test was performed to evaluate                  for recording ambient seismic noise, and its different ver-
the time–amplitude differences for each channel. Firstly, a                sions with sensors of 2 and 4.5 Hz are available on the mar-
1 Hz sinusoidal signal of 15 mV amplitude generated by the                 ket. In this study, the SR04HS model with 4.5 Hz sensors of
model FG-8002 function generator manufactured by EZ Dig-                   was used to make a comparison with MicDAC. The signals
ital was connected to each input channel, and these signals                recorded simultaneously by MicDAC and GeoBox are shown
were recorded over a period of 60 s with a 46 dB gain. After               in Fig. 8a and b. Log-MT software was used to monitor and
that, the differences of the recorded signals for each channel             record the signals with GeoBox. Two different gain levels, 46

https://doi.org/10.5194/gi-9-365-2020                                         Geosci. Instrum. Method. Data Syst., 9, 365–373, 2020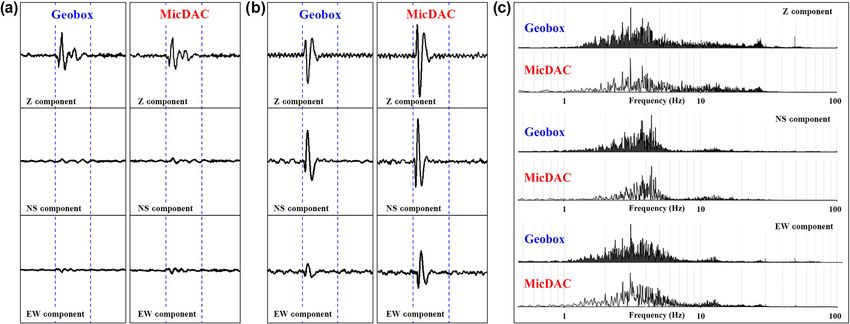
370                                                                 O. Kafadar: A geophone-based and low-cost data acquisition

Figure 5. Screenshot of MicDAC-GUI and detected signals using a 4.5 Hz vertical geophone connected to each channel input.

Figure 6. (a) Fourier spectra for the recorded three-component data during the second channel consistency test; (b) H / V spectral ratio.

and 60 dB, were used in the signals recorded with MicDAC.                ratios were also obtained using the Geopsy software (Fig. 9a
As a result of this comparison in the time domain, a good                and b). The obtained H / V peak frequencies and amplitudes
correlation between the recorded signals using GeoBox and                are given in Table 2. A good correlation was observed be-
MicDAC was observed. This similarity was also observed in                tween the calculated H / V peak frequencies and amplitudes.
their frequency spectra (Fig. 8c). In addition to the compar-            The main reason for the differences in the amplitudes of the
isons in the time and frequency domains, their H / V spectral            H / V curves at frequencies below 2 Hz is related to the elec-

Geosci. Instrum. Method. Data Syst., 9, 365–373, 2020                                            https://doi.org/10.5194/gi-9-365-2020
O. Kafadar: A geophone-based and low-cost data acquisition 371
Figure 7. Internal noise measurements for each channel.
Figure 8. Three-component seismic data recorded simultaneously using both devices: (a) MicDAC with 46 dB gain and (b) MicDAC with
60 dB gain. (c) Comparison of Fourier spectra of recorded three-component microtremor data using GeoBox and MicDAC.
tronic design of GeoBox. GeoBox has an electronic architec- This region is in the middle of the Izmit Basin, and the up-
ture that can obtain a flat band wider than the natural band per strata of this basin are composed of alluvium deposits
of the geophone embedded in the instrument. Therefore, it consisting of silt, sand, gravel, and clay. In this region, a
obtains better sensitivity at low frequencies. large-scale study for site classification and seismic hazard
assessment was already conducted by the Marmara Research
Center of TÜBİTAK and Greater Metropolitan Municipality
of Kocaeli (Özalaybey et al., 2008, 2011). According to their
4 Experimental study study, the thickness of the sediments in the Izmit Basin was
calculated as approximately 715 m. Especially in the regions
Another test measurement was conducted to test the perfor- located in the middle of the Izmit Basin, it was found that the
mance of MicDAC in field conditions and to compare the H / V peak frequency varies between 0.2 and 1.0 Hz and the
obtained results with a previous study. For this purpose, a corresponding magnification values are 5–6 times (Özalay-
previously measured area was selected for recording ambi- bey et al., 2008).
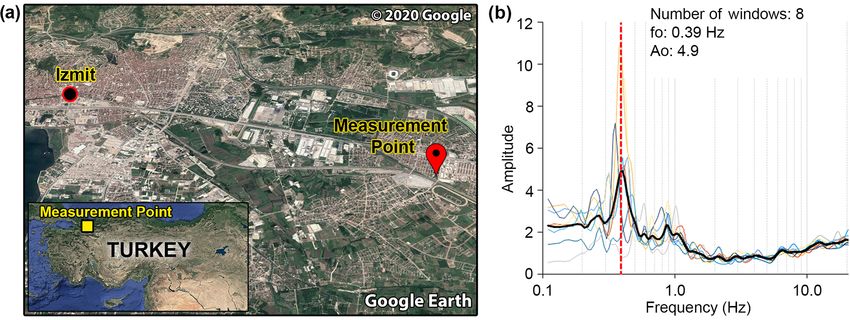
ent noise. The measurement point is located in the Kartepe Ambient noise was recorded during a period of 20 min.
district in the Marmara region, Turkey (Fig. 10a). The relation between the expected minimum frequency and
https://doi.org/10.5194/gi-9-365-2020 Geosci. Instrum. Method. Data Syst., 9, 365–373, 2020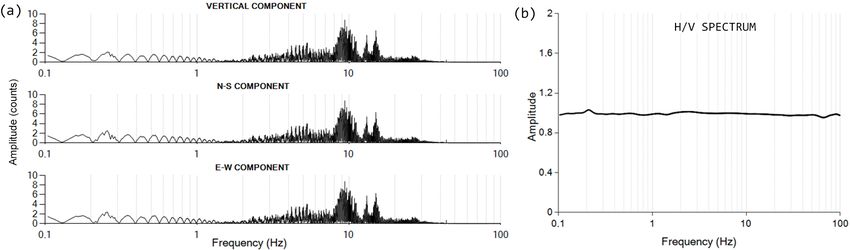
372                                                                O. Kafadar: A geophone-based and low-cost data acquisition

Figure 9. The obtained H / V spectral ratios of recorded data by (a) GeoBox and (b) MicDAC.

Figure 10. (a) Location of the test measurement point in Google Earth© view; (b) H / V spectral ratio.

recording duration is explained in the SESAME report in de-             components, integrated circuits, and the Microsoft .NET
tail (SESAME, 2004). The recorded signal was split into 14              Framework 4.5.2 application development platform. The de-
time windows of 81.92 s, and eight of these time windows                signed external hardware can be easily assembled by readers
were used for the analysis; 5 % cosine tapering and 10 Hz               and controlled through a developed graphical user interface
low-pass filtering operations were applied to the selected              using C# language. This software allows for the monitor-
windows, and Fourier spectra for each window were cal-                  ing and recording of three-component microtremor data and
culated. The Konno–Ohmachi filter with bandwidth b = 40                 analyzing the recorded data using the horizontal-to-vertical
was used to obtain the smoothed Fourier spectra. Then H / V             spectral ratio (H / V) technique. In this way, the peak fre-
spectral ratios were calculated for each window. Finally,               quency and amplitude of the H / V curve can be estimated.
the H / V peak frequency and amplitude for the measure-                 Channel consistency, internal noise measurement, and com-
ment point were determined as 0.39 and 4.9 Hz, respectively             parison tests were performed to demonstrate the accuracy
(Fig. 10b). These findings show that the obtained results are           and precision performances of the proposed system. In the
consistent with the literature (Özalaybey et al., 2008).                channel consistency test, it was shown that the error percent-
                                                                        age of the difference signals was lower than 1 %. In addi-
                                                                        tion, it was shown that the H / V is equal to 1 when a single
5   Conclusions                                                         sensor is connected to each channel input at the same time.
                                                                        In the internal noise measurement test, the noise levels for
The aim of this study is to develop a low-cost, computer-               three channels were observed as approximately ±3 counts.
aided, and Arduino-based three-component microtremor                    In particular, the H / V curves obtained from data recorded
data acquisition and analysis system using basic electronic

Geosci. Instrum. Method. Data Syst., 9, 365–373, 2020                                          https://doi.org/10.5194/gi-9-365-2020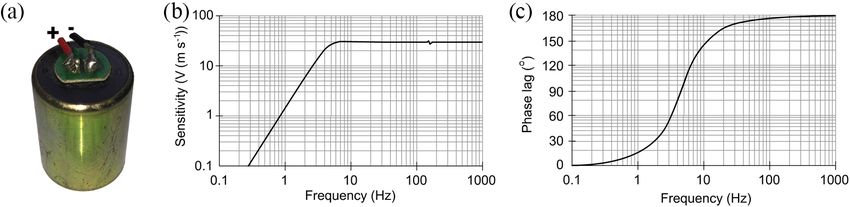
O. Kafadar: A geophone-based and low-cost data acquisition                                                                               373

simultaneously with MicDAC and GeoBox and their peak                    Kafadar, O.: ozkankafadar/MicDAC: MicDAC, Zenodo,
frequencies and amplitudes proved the reliability of the pro-             https://doi.org/10.5281/zenodo.4009796, 2020.
posed system. Finally, an experimental study was performed              Kafadar, O. and Sertcelik, I.: A computer-aided data acquisition sys-
to test the performance of MicDAC in field conditions. The                tem for multichannel seismic monitoring and recording, IEEE
obtained H / V peak frequency and amplitude from the ex-                  Sensors J., 16, 6866–6873, 2016.
                                                                        Kanai, K.: On the spectrum of strong earthquake motions, Primeras
perimental study were compared to a previous study, and a
                                                                          J. Argentinas Ing. Antisismica, 24, 68–73, 1962.
good correlation was shown between them. Therefore, it can              Katz, L. J.: Microtremor analysis of local geological conditions, B.
be concluded that MicDAC is a suitable and inexpensive al-                Seismol. Soc. Am., 66, 45–60, 1976.
ternative system for three-component microtremor measure-               Khan, K. A., Akhter, G., and Ahmad, Z.: DigiSeis-A software com-
ments and H / V analysis.                                                 ponent for digitizing seismic signals using the PC sound card,
                                                                          Comput. Geosci., 43, 217–220, 2012.
                                                                        Konno, K. and Ohmachi, T.: Ground-Motion Characteristics Es-
Code availability. The MicDAC software folder with a size of              timated from Spectral Ratio between Horizontal and Vertical
10 MB contains an Arduino sketch program, executable file                 Components of Microtremor, B. Seismol. Soc. Am., 88, 228–
folder, MicDAC open-source software files, and readme file.               241, 1998.
The MicDAC software was developed by using the C#.NET                   Llorens, J. L. S., Merino, J. J. G., Caturla, J. J. G., Eslava, P. J.,
language. It is based on Microsoft Windows OS and Frame-                  Cintas, S. R., and Herranz, J. R.: Development and programming
work 4.5.2. The developed graphical user interface, device                of Geophonino: A low cost Arduino-based seismic recorder for
firmware, and other supplementary files can be supplied from              vertical geophones, Comput. Geosci., 94, 1–10, 2016.
the author or downloaded from GitHub, a web-based repos-                Llorens, J. L. S., Merino, J. J. G., Caturla, J. J. G., Eslava, P. J.,
itory hosting service: https://github.com/ozkankafadar/MicDAC             Cintas, S. R., and Herranz, J. R.: A low-cost three-component
(https://doi.org/10.5281/zenodo.4009796, Kafadar, 2020).                  seismic noise recorder for the application of the H / V method,
                                                                          Sensor. Actuator., 269, 342–354, 2018.
                                                                        Nakamura, Y.: A method for dynamic characteristics estimation of
Competing interests. The author declares that there is no conflict of     subsurface using microtremor on the ground surface, Quart. Re-
interest.                                                                 port Rail. Tech. Res. Inst., 30, 25–33, 1989.
                                                                        Özalaybey, S., Zor, E., Tapırdamaz, M. C., Tarancıoğlu, A., Öza-
                                                                          laybey, S. Ç., Erkan, B., Karaaslan, A., Alparslan, E., Ergin, M.,
Acknowledgements. I would like to thank the Sentez Earth and              Ergintav, S., and Tan, E.: Kocaeli İli için Zemin Sınıflaması ve
Structure Engineering Limited Company for allowing me to use              Sismik Tehlike Değerlendirme Projesi, TÜBİTAK, 5057105, 1–
their laboratory and equipment.                                           190, 2008.
                                                                        Özalaybey, S., Zor, E., Ergintav, S., and Tapırdamaz, M. C.: Investi-
                                                                          gation of 3-D basin structures in the Izmit Bay area (Turkey) by
                                                                          single-station microtremor and gravimetric methods, Geophys. J.
Review statement. This paper was edited by Ciro Apollonio and re-
                                                                          Int., 186, 883–894, 2011.
viewed by two anonymous referees.
                                                                        Percival, D. B. and Walden, A. T.: Spectral Analysis for Physi-
                                                                          cal Application, Cambridge University Press, London, 187–330,
                                                                          1993.
References                                                              Puente, S. T., Ubeda, A., and Torres, F.: e-Health: Biomedical
                                                                          instrumentation with Arduino, IFAC-PapersOnLine, 50, 9156–
Aki, K.: Space and Time Spectra of Stationary Stochastic Waves            9161, 2017.
   with Special Reference to Microtremors, B. Earthq. Res. I. Univ.     SESAME: Guidelines for the implementation of the H / V spectral
   Tokyo, 35, 415–456, 1957.                                              ratio technique on ambient vibrations: measurements processing
Douze, E. J.: Signal and noise in deep wells, Geophysics, 29, 721–        and interpretation, European Commission-Research General Di-
   732, 1964.                                                             rectorate, Project No. EVG1-CT-2000-00026, 2004.
Fisher, D. K. and Gould, P. J.: Open-Source Hardware Is a Low-          Texas Instruments: Single Supply, MicroPower Instrumentation
   Cost Alternative for Scientific Instrumentation and Research,          Amplifier, INA122 datasheet, 1–14, 1997.
   Modern Instrumentation, 1, 8–20, 2012.                               Weller, C. E.: Seismic Exploration Method, U.S. Patent, 3.812.457,
Frantti, G.: The nature of high-frequency earth noise spectra, Geo-       1974.
   physics, 28, 547–562, 1963.
Huang, H., Lee, D. H., Chang, K., Li, W., and Dev, A. T.: Develop-
   ment of mobile platform for indoor positioning reference map us-
   ing geomagnetic field data, Computers and Electrical Engineer-
   ing, 68, 557–569, 2018.

https://doi.org/10.5194/gi-9-365-2020                                      Geosci. Instrum. Method. Data Syst., 9, 365–373, 2020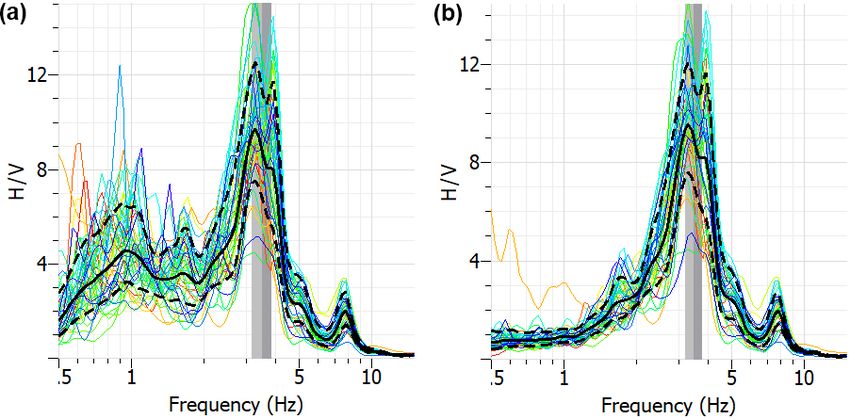
You can also read