Asia-Pacific Economic Statistics Week 2019 - ESCAP ...
←
→
Page content transcription
If your browser does not render page correctly, please read the page content below
Asia–Pacific Economic Statistics Week 2019
 Integrating economic statistics in monitoring the Agenda 2030
 17-21 June 2019 | Bangkok, Thailand

 Asia-Pacific Economic Statistics Week
 Seminar Component
 Bangkok, Thailand, 17 – 21 June 2019
 Name of author
 Maftukhatul Qomariyah Virati; Rachmi Agustiyani; Siti Mariyah; Setia Pramana

 Organization
 BPS Statistic Indonesia

 Contact address
 Dr. Sutomo Street 6-8 Jakarta 10710 Indonesia

 Contact phone
 (+62)85731195717

 Contact Email
 14.8221@stis.ac.id; setia.pramana@stis.ac.id
 Topic of seminar to which your abstract relates: [1]

 Title of paper: Development of a Big Data Analysis System (Case Study :
 Unemployment Statistic)

Abstract
Technology has evolved over time. One of them is the transfer of printed media into online
media. Nowadays, you can find news and job vacancy faster than ever, they can be obtained
by surfing internet. This also make them one of the valuable data to help explain phenomena
in real world. BPS Statistics Indonesia has taken advantage of this data, but still using manual
techniques. This means that BPS has to search and collect news items one by one, taking a
lot of precious time and effort. Web scraping technology can help to solve this problem. Web
scraping can crawl into the news site and job vacancy sites and automatically collect
information into a web-based system. With the APIs of Google Trend and Twitter, additional
data can be obtained to further help explain the phenomena. This research is aimed to develop
a web system that is able to monitor google trend and twitter, scraping for news and job
information. In addition, news that has been collected can be investigated with a particular
keyword search. Researchers used System Development Life Cycle (SDLC). To test the
system, researchers use black box testing and System Usability Scale (SUS). The results of
the test, indicate that the system can run well and provide for an acceptable solution.
I. Contents

I. Contents......................................................................................................................................... 2
II. Introduction.................................................................................................................................... 3
III. Developing a Big Data Analysis System .............................................................................. 4
 A. Methodology .............................................................................................................................. 4
 1. Web Scraping News and Job Vacancy............................................................................. 4
 2. API for Index Google Trend and Twitter ........................................................................... 4
 3. Quality Control and Limitation ............................................................................................ 6
 4. Challenges ............................................................................................................................. 7
 5. Admnistration Source vs Big Data ..................................................................................... 7
 6. Integration with current official statistics ........................................................................... 8
 B. Developing System .................................................................................................................. 9
 1. Analysis System ................................................................................................................... 9
 2. Design System .................................................................................................................... 10
 3. System Implementation ..................................................................................................... 13
 4. System Security .................................................................................................................. 18
 5. System Evaluation ............................................................................................................. 19
IV. Conclusion ............................................................................................................................... 21
V. References .................................................................................................................................. 22
II. Introduction
 Unemployment statistics are an important indicator of economic activity and needed
for policy makers. Unemployment Statistics explains the condition of the labor force in a
country. The results of these statistics are data such as Tingkat Pengangguran Terbuka
(TPT)/ Open Unemployment Rate and Labor Force. Unemployment itself is a problem that
must be resolved immediately. Long-term unemployment take a toll on both sociology and
economically Nichols, Mitchell and Linder (2013). In Indonesia, this statistics are handle by
the Employment Sub-directorate of the BPS Statistics Indonesia.

 The Employment Sub-Directorate of the BPS Statistics Indonesia carried out a Survey
called Survei Angkatan Kerja Nasional (SAKERNAS) to obtain Indonesia employment
statistics. SAKERNAS is held twice a year in February and August. The reason the BPS
Statistics Indonesia chose to do SAKERNAS in February is because in that month is the main
harvest season (thus expected to have more employment), while August is the drought
season. SAKERNAS was conducted by interviewing selected household members.

 To maintain data quality, the approach taken by the BPS Statistics Indonesia is to
check the consistency between variables, compare data with the previous year, and compare
data with phenomena that occur in the community. The first two can be managed using entry
program and statistic analytic. However, to compare data with phenomena that occur in the
community, it must be known what phenomena is happening.

 Phenomena that occur in the community are known by gathering news on that month.
Currently news collection is still done by our staf manually, by collecting news from the
newspaper and doing a search one by one on the internet. This causes the gathering of news
to take a lot of time and effort. Therefore, a system to help gather news that available in various
online media automatically is needed. In addition, searching system needs to be implemented
into the system which will make it easier to see phenomena.

 In addition, there are employment data that still have not been caught from news
gathering. Research conducted by Joonas Tuhkuri in 2014 showed that the Index Google
Trend can be used to predict future unemployment. There’s also another research by Bokányi,
Eszter & Lábszki, Zoltán & Vattay, Gábor (2017) that predict the employment and
unemployment rates from twitter daily in US. The recent technology made job vacancy more
easily found via job vacancy site such as Jobstreet, Jobs.id, and etc. Therefore this research
also seeks to capture data such as job vacancies, Index Google Trend, and twitter.
III. Developing a Big Data Analysis System
 A. Methodology
 1. Web Scraping News and Job Vacancy

 Web scraping is the activity of collecting data using various methods other than using
the API and human intervention. Web Scraping is usually done by writing automatic programs
that query the web server, request data, and decipher the data to extract into information
(Mitchell, 2015)

 Scrapy is a robust web framework of Python for scraping data from various sources. It
was released on June 26, 2008 and continues to grow until now. (Dimitrios Kouzis-Louis,
2016). The advantage of Scrapy compared to other frameworks are capability to understand
broken HTML, organized code, and a large and helpful community which responsible for
maintance, development, and quality control of the framework.

 2. API for Index Google Trend and Twitter

 Search Volume Index is an index produced by Google for certain word searches.
Search Volume Index does not display the number of search words, but forms it into an index
by comparing the number at a certain point with the highest number.

 The Unemployment Rate in Indonesia is explained by an index, namely the Tingkat
Pengangguran Terbuka (TPT). The unemployment rate (TPT) produced by the BPS Statistics
Indonesia is obtained from the following formula

 = 100%

 Unemployment rate in Indonesia is produced every February and August, since
February is the paddy harvest season which resulted in demand of more labor, and August is
the dry season which resulted in decreasing labor demand.

 To do a job search, Indonesian will use keywords such as kerja (job), lowongan kerja
(job vacancy) and loker (slang for job vacancy). The results of the Search Volume Index for
these keywords are as follows
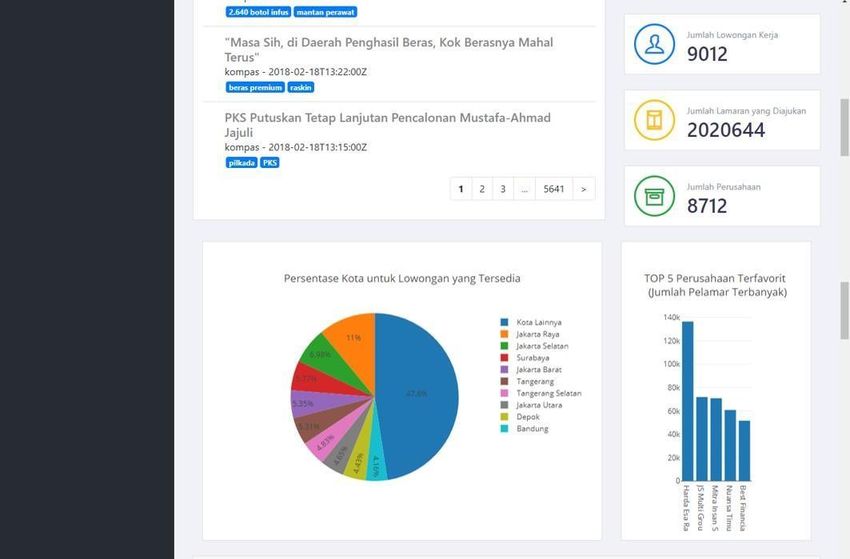
Figure 1. Chart of Search Volume Index from Index Google Trend

 For kerja and lowongan kerja, despite having a different search volume, it has the
same pattern. As for the loker keywords, it only began to follow the pattern in early 2015 as
the slang was introduced.

 The comparison between the unemployment rate produced by Badan Pusat Statistik
with the Search Volume Index from the Index Google Trend is shown by the figure below.

 Figure 2. Unemployment rate 2007-2016 Figure 3.SVI dari Index Google Trend 2007-2016

 It is seen that both the unemployment rate and the Index Google Trend have
decreased. This is in accordance with the research conducted by Joonas Tuhkuri in 2014.
Moreover Index Google Trend have the index for every month, while for Unemployment rate
it is only calculated every year on February and August. The Index Google Trend can be a
new appeal to help predict the unemployment rate in Indonesia.
As for using twitter data, research conducted by Bokányi, Eszter & Lábszki, Zoltán &
Vattay, Gábor. (2017) who make predictions about employment and unemployment from daily
rhythm twitter. In the study it was known that there was a pattern between tweets with the
unemployment rate. This can be used for better decision making in unemployment.

 3. Quality Control and Limitation

 Data generated from the internet is certainly diverse. On news sites, for example, there
are tags like Title of News . This tag needs to be cleaned before the data
is stored in the database. Using scrapy help and the some package from python from
The Title of News we can extracted Title of News and saving it into database.

 Saving date on the news site also needs attention. This is because the method of
writing date is different in each site. For example, there are some sites who write dates with
dd/mm/yyyy method, but there are also sites that use the mm-dd-yyyy method. So when the
date is taken, each site needs to be customized to break the element of date and rearrange it
using the same standard. In this study, the standard date used is dd-mm-yyyy which is the
most common date writing method in Indonesia

 The problem that might occur is because the updated news site causes the web-
scraping process to fail. If this happens, web-scraping must follow the development of this
news site and have to update the system. But, this is usually rare on news sites, in contrast to
e-commerce sites that can change their layout every month, even every week.

 In addition, the use of the Application programming interface (API) is provided from the
site. So that there is a possibility for a permission on the API to be changed, or even the API
from the site is stopped. This is also a small possibility to occur, usually API support is stopped
if the site owner goes bankrupt. However, this is rare on large sites like Google and Twitter.

 Currently this research is still in the development stage as the job openings can only
be obtained from certain sites such as Jobs.id, while not all job seekers use the site and may
rely on other platforms. Though the selected site is the main job vacancy site, it can possibly
lead to inherent bias. For now, this research is still limited in that area.

 Also, Indonesia is a vast country with a variety of ethnicities, cultures and languages.
Unfortunately, many Indonesians are still out of reach or have difficulties with the internet
network. While the data collected in this system uses the internet, this make it impossible to
measure the people who do not have internet network. Therefore, until now the results of this
study have not been able to analyze up to the provincial level, but still at the national level.

 On news sites, there are also issues with the news that are repeated on several
websites. Besides that there are also problems regarding hoax news or fake news. This has
been overcome by choosing a news site that has a credible rating. The news site chosen is a
national news site and is careful enough to post news. Repeated news is expected to be
overcome in further system development using similarity algorithms such as TF-IDF
4. Challenges

 The difference between each site makes web-scraping activities must use different
code on each site. In addition, data cleaning needs to be done before data from the site is
stored in the system database. This data cleaning process also requires special handling that
is different for each site.

 The amount of data collected in this system is very large. Every month there are around
60,000+ news collected and thousands of jobs. So it requires a large and reliable database in
handling available data. So postgreSQL was chosen as a database for the development of
this system. PostgreSQL has no volume restrictions like other databases. Besides that
PostgreSQL is also open source so there are no problems in the license.

 5. Admnistration Source vs Big Data

 The source of administrative data for employment so far has only come from a yellow
card from the Dinas Ketenagakerjaan (Labour Force Agency). This card is used as a
requirement to apply for jobs in government agencies. The disadvantage is that Dinas
Ketenagakerjaan rarely publishes the number of yellow cards. In addition, these cards are
usually not needed to appy job outside government agencies. So, some job seekers usually
don't take care of it.

 There is also potential administration source from tax reports that must be reported
every year. However, this report usually only contains general data such as the category of
labor only. In addition, this report only contains the number of people who work, not the
unemployment. Which make finding the unemployment rate difficult.

 SAKERNAS survey process takes a very long time. Starting from survey preparation
such as determining methodology, training instructure, and etc. When the survey is finally
started, it also requires a lot of man power. Badan Pusat Statistik requires thousands partner
who will visit the sample household and do interview. After completing the survey process,
there’s need to do data processing. Badan Pusat Statistik still uses paper-based for
SAKERNAS, it means that Badan Pusat Statistik need to do entry data. After that data from
each district will be collecting to provincies and verified. After verified the data will be sent to
data center in Jakarta. The Data still need to be processed and analyzed. This very long
process cause the SAKERNAS February to start in December and finish in May.

 So, Indonesia's SAKERNAS February are usually only published in May. This means
there is a difference of about 3 months. Meanwhile, with Big Data such as Index Google Trend
has shorter time difference. There’s only 1 day data difference. This very short time difference
can help predict a faster unemployment rate. In addition, on the Index Google Trend we get
Search Volume Index data that can be used to view data every month, even every hour.
Whereas for SAKERNAS, the data is only available in February and August. This is also the
same as other Big Data such as Web Scraping, and Twitter. The energy and time needed is
far less. This will greatly help in making decisions effectively and efficiently.
6. Integration with Current Official Statistics

 The use of Big Data in the Badan Pusat Statistik is still in the development stage. In
2019, Badan Pusat Statistik began collaborating with the Politeknik Statistika STIS to create
a special Big Data team. This means that the Badan Pusat Statistik has begun to prepare the
use Big Data for official statistics.

 This is evidenced by the many studies on Big Data for Official Statistics. For example,
Kajian Indeks Harga Konsumen berbasis E-commerce (Alifa Putri Wijaya, 2018) which
examines the Consumer Price Index by web-scraping the price on e-commerce sites. There
is also research on the Pembangunan Sistem Klasifikasi Teks Berita Online sesuai Indikator
Indeks Demokrasi Indonesia (Nur Imron Suyuti, 2018), which built a classification system in
the Online News Text for indicators of Indonesian Democracy Index. There is also a Web
Mining Simple Solution (Rahmad Hidayat et al., 2017) that makes a System to facilitate
analysis of the results of web mining, one of the features of the Mining Simple Solution Web
is to conduct Sentiment Analysis, as was done in the study of Kajian Analisis Sentimen Data
Twitter menggunakan Metode Support Vector Machine dengan optimasi PSO dan Firefly
(Bambang, 2017) which conduct Sentiment Analysis on Twitter data to see the view or
opinions on the National Examination.

 The results of this study have already been used to assist in the analysis of
SAKERNAS in August 2018 and February 2019. For SAKERNAS in August 2019 it has been
prepared for use. With the help of Big Data team from Politeknik Statistika STIS, the system
built also began to be integrated with the Badan Pusat Statistik.

B. Developing System
 1. Analysis System

 a) Working Bussiness Proces
 This analysis is done to see the needs of a system. First interviews are conducted with
subject matter to find out the process of the system running. From the results of interviews
conducted, it is known that the system running process is as follows

 Figure 4. Working Bussiness Process

 So far, the news search process is still done manually. BPS staff will see what
phenomena are obtained from SAKERNAS. Then the employee will do a news search related
to the phenomenon. This search is done on the internet using Google. After a search, see if
the news is found. If the news is not found, the employee must search again. If the news is
found the news will be checked whether it matches the existing phenomenon. If the news is
not in accordance with the phenomenon, BPS staff must search again. If the news is in
accordance with the phenomenon, news will be collected in the form of files. The results of
the news search are then formed.
b) Problem Identification
 Afterwards, analysis and identification of all problems in the system can be carried out.
The results of the analysis and identification of this problem are illustrated by the fishbone
diagram below, there are 4 main problems, namely from the Human, Method, Machine and
Material.

 Figure 5. Fishbone Diagram

 The Human Resources in the BPS Statistics Indonesia are limited. This is not
comparable with the amount of news available which makes it inefficient and ineffective.
The method used by the BPS Statistics Indonesia still uses manual methods. Search will
be done one by one using a search engine. Then, the existing news will be seen whether it
is in accordance with the phenomenon that occurred. This search will be done one by one
and takes not a little time.

 From the side of the machine. Storage of news that has been collected is still done
manually, by copy-pasting. This also causes stored data to be unstructured and difficult to
find again. This also makes that the news collected with a files not a database. Which can
make them duplicate and abundant. For the machine, there are data on employment that
still have not been caught. For example, Google trends index can be used to see
unemployment in Indonesia. Twitter data, and data on job vacancies have also not been
collected and analyzed.

 2. Design System

 a) Bussiness Proces Proposal

 After knowing how the system works, then system design can be done next. First,
the proposed business process is prepared.
Figure 6. Bussiness Process Proposal

 First, employees will get any phenomena found in SAKERNAS. Then the employee
just starts scraping by choosing the site to be scraped and the date for scraping. The system
will then do scraping and save the results of scraping in the database. Employees can then
search to find news and match news with the appropriate phenomenon. In addition, the
system will display data from the Google trends index. The system will also display data
from Twitter. Employees can then make the required reports using data from scraping
results, google trends index, and data from twitter.

 b) System Architecture

 The architecture of the system to be built is as follows. The programming language
used is the Python language version 3.5.3. The web framework used is Django version
2.0.7. The web scraping framework used is Scrapy version 1.5.1. For the design of the
interface used HTML, CSS, JS and Bootstrap 4.0. To facilitate the construction of the
website, Sublime Text is used
Figure 7. Architecture Diagram

 The system built is a web-based system built using the Django framework. In UI
development, various additional libraries were used. The plotly library is used to create
more interactive graphics. The datatables library is used to make better tables. In addition,
bootstrap is also used to help develop CSS and JS.

 While in the development of the backend section, it is divided into two parts, namely,
web scraping, and API. To do web scraping, use a python library called scrapy. Scrapy will
browse web pages using spiders and then save the news into the database using the
pipeline. Scrapy searches to get news data on online media and job vacancies on the jobsID
web. The library used to access the Index Google Trend API is the pytrends library that is
based on python. While the library used to access the twitter API is a tweepy library that is
also based on python. In addition, additional libraries are also used to help develop the
system. The django-scrapy-fire library used to connect the django framework and scrapy
framework. The scrapyd library is used to run framework scrapy.

 The database used in developing this system is postgreSQL. PostgreSQL was
chosen because of its open-source and unlimited database capacity. Django and
postgreSQL integration are not too difficult to do, because Django uses the concept of
Object Relational Model (ORM).
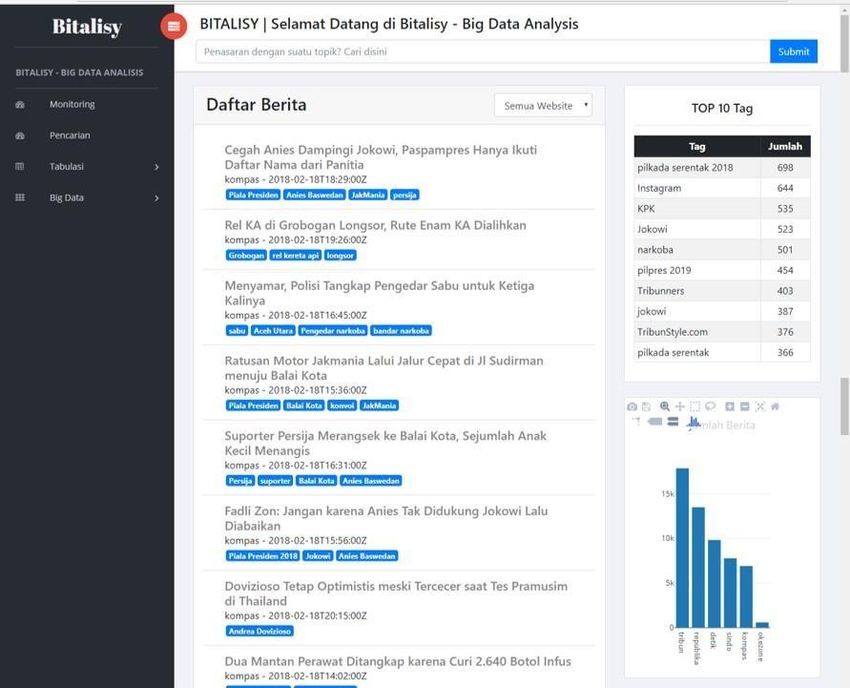
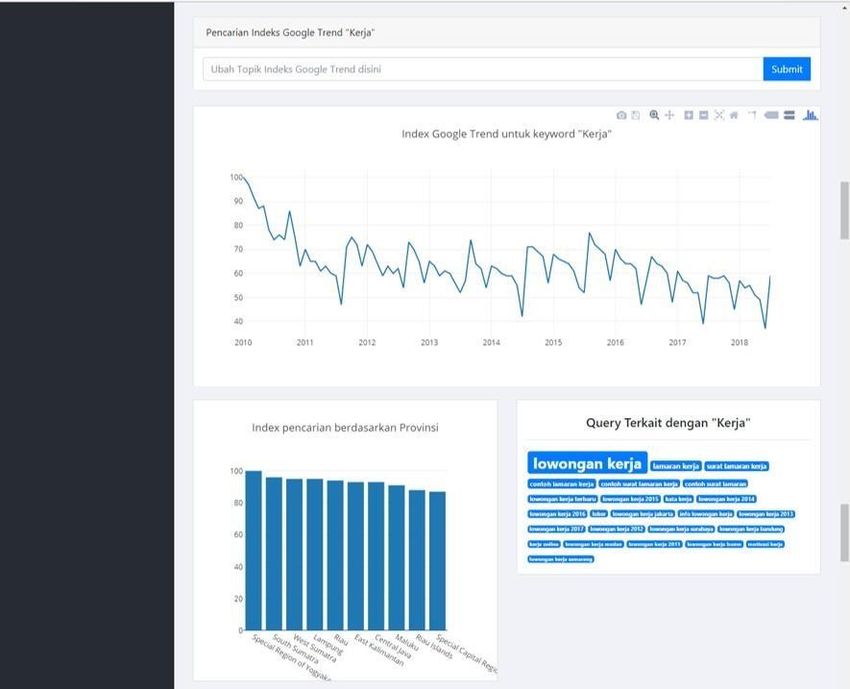
3. System Implementation
a) Monitoring

 Monitoring can be used to see the data that have been collected. Divided into 4 sub-
sections, namely news monitoring, job vacancy monitoring, Index Google Trend monitoring,
and twitter monitoring. Monitoring is focused on using graphics to facilitate interpretation. In
monitoring the news you can see the news stored in the database. The news can also be
filtered according to the sources. In addition, there are Top news tags, which are the news
tags that appear most often on existing news. In monitoring there is also a graph that shows
the amount of news on each media site. In monitoring job vacancy you can see the number
of job vacancy stored in the database, the number of applications submitted, the number of
companies offering job vacancy, cities that have vacancies, and companies that have the
most applications. In monitoring the google index trend can be seen trends with certain
keywords. Then it can be seen which provinces have the highest index, and what queries
are related to those keywords. Finally on Twitter monitoring, you can see tweets about
certain keywords. Besides that, trending topics in Indonesia can also be seen here.

 Figure 10. News Monitoring
Figure 11. Job Vacancy Monitoring

Figure 12. Index Google Trend Monitoring
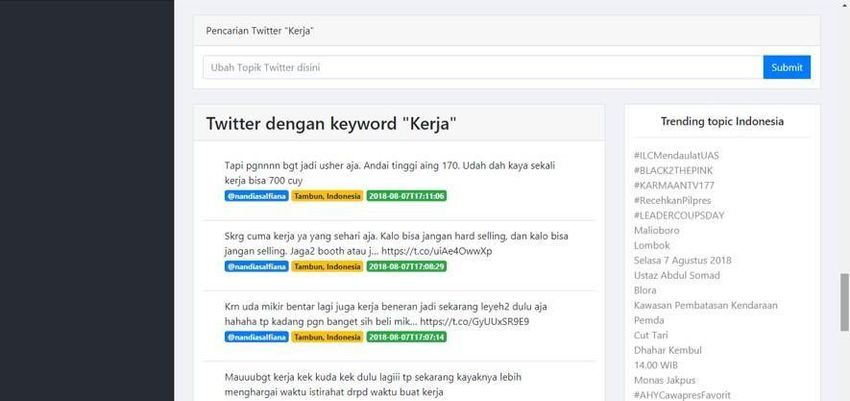
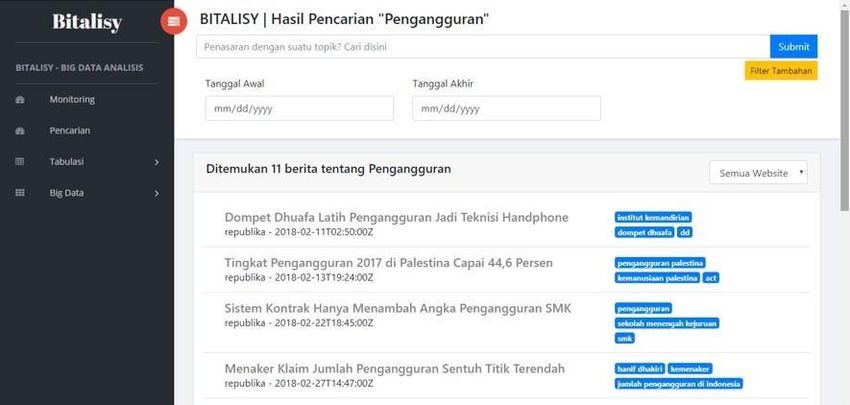
Figure 13. Twitter Monitoring

b) Searching

 In this feature, users can enter certain keywords to do news searches. News
search can be filtered on certain websites and on certain dates. Results will be displayed
every ten stories. If the news produced by more than ten news, a button will appear to the
next page.

 Figure 14. Searching News

c) Web Scraping

 Web scraping is divided into two sub-sections, namely the scraping news section
and scraping job vacancy section. On scraping news, users can choose what sites to do
scraping and dates to do scraping. While on web scraping job vacancy, there is only a
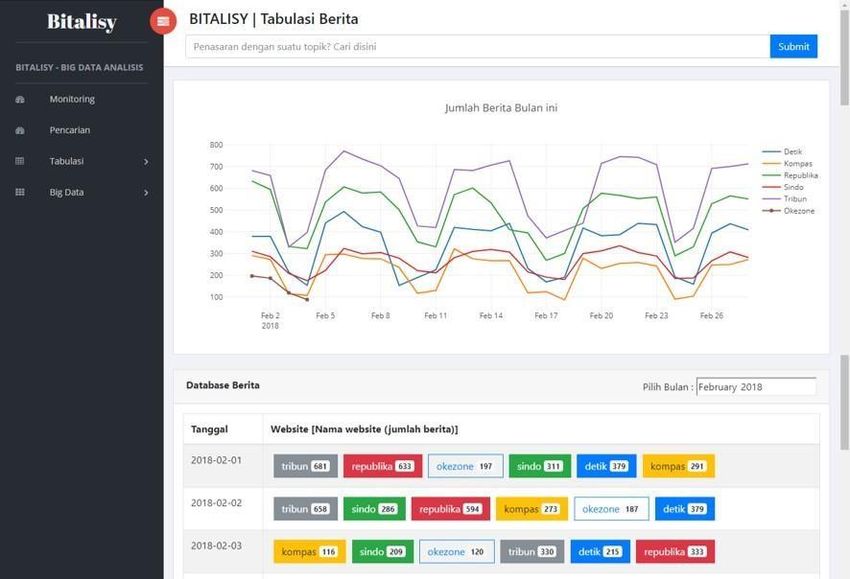
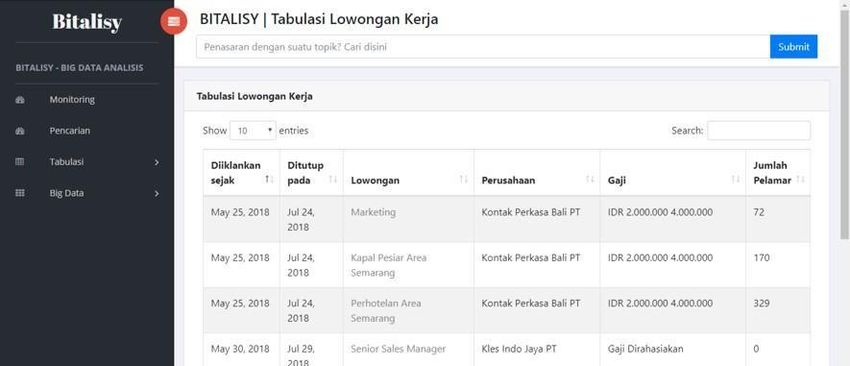
button to start scraping. A log will appear to show that the scraping process has started, is
running, pending, and finished. When scraping is complete, a button will appear to see the
results of the scraping that has been completed. The process that occurs from web scraping
is that the user will send a command to start scraping to the scrapy framework. Scrapy will
then begin the scraping process. Then the website will check the progress of scraping every
5 seconds. When the scraping status is finished, the checking process will be stopped.
Scrapy himself will start searching the web with spiders. After the data from the website is
retrieved, scrapy will channel the results via the pipeline for storage to the database.

Figure 15. News Web Scraping

Figure 16. Job Vacancy Web Scraping

d)Tabulation

In this feature the user can view the news and job vacancies that have been saved. In the
news tabulation, users can see a graph of the number of news for the month. In addition,
users can see the amount of news on each website each day. News details can also be
viewed by pressing the button. It is the same with job vacancy.
Figure 17. News Tabulation

Figure 18. Detail Table from News Tabulation
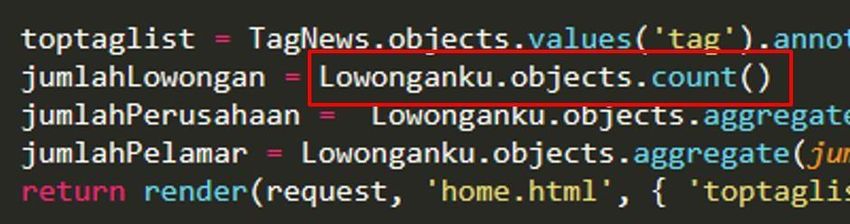
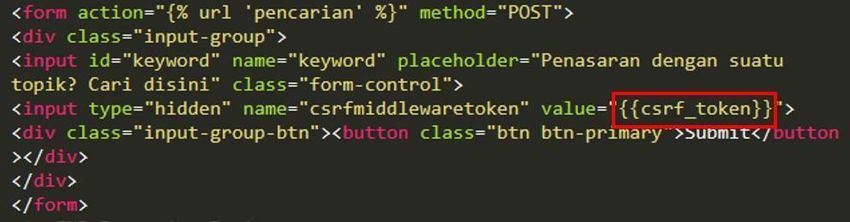
Figure 19. Job Vacancy Tabulation

 4. System Security

 a) XSS Protection

 XSS protection is done by sending variables from the server side to the client side.
These variables are sent using double bracket in the django template. An example of its
implementation can be seen in Figure 20. The data in question is marked using a red box.
Toptag data will be taken from the django view and generated in the django template.

Figure 20. Implementation XSS Protection

 b) CSRF Protection

 CSRF protection is done by adding secret code to each data form using the POST
method. For examples of implementation, see Figure 21 which is marked with a red box. It
appears that a variable named csrfmiddlewaretoken needs to be added that contains the
secret code of the CSRF. This CSRF code will be generated by the system automatically
by the system to protect users.
Figure 21. Implementasi CSRF Protection

 c) SQL Injection Protection

 Protection from SQL Injection can be done using queryset from django compared
to using raw SQL. Examples of queryset usage can be seen in Figure 22. How to protect
from SQL Injection is marked in the red box. The function in this red box is the same as
counting all items in the Job table. By using queryset, data is safer from SQL Injection
attacks.

Figure 22. SQL Injection Protection

 5. System Evaluation

 System Evaluation is done to test whether the functions made in the system are
running well, and whether the system that is made is feasible to use. The method used for
evaluating this system is the Black Box Testing, System Usability Scale (SUS) method and
Comparison of Total Activity and Time.

 a) Black Box Test

 Black Box testing is a test conducted to see whether the output produced is as
 expected. Black Box testing does not pay attention to the processes that occur in the
 system. The results of the Black Box test can be seen in Appendix 14. The results of the
 black box indicate that the functions on the system are running well and produce results
 as expected

 b) Comparison of Total Activity and Time

 User Activity in the System
Working Time Proposed Time
 Total Total
 System Estimation System Estimation

Opening
 30 seconds 30 seconds
news site

 30 news X
Open the @30 30 seconds
 Web 30 news x 1
news link seconds = 900
 scraping @1 second second = 30
 seconds
 news site* seconds
 30 news X
Copy Paste
 @30 30 seconds
news into
 seconds = 900
excel
 seconds

 Download
 6 sites X 5
Compiling news that
 300 seconds 300 seconds @5 seconds seconds =
news has been
 30 seconds
 collected*

Skimming 30 news X
News to @120 120 seconds Searching
 2 seconds 2 seconds
search seconds = 360 news*
related news seconds

Opening
jobs vacancy 30 seconds 30 seconds
site

 30 job
 vacancy X
Open the job @30 Web 30 job
 30 seconds
vacancy link seconds scraping job vacancy x 1
 = 900 @1 second
 vacancy second = 30
 seconds
 site* seconds
 30 job
Copy Paste vacancy X
 @30
job vacancy 30 seconds
 seconds
into excel = 900
 seconds

 Download
 job vacancy
Compiling
 300 seconds 300 seconds that has 5 seconds 5 seconds
job vacancy
 been
 collected*
Opening &
 Monitoring
 Searching
 Index
 Index 60 seconds 60 seconds 5 seconds 5 seconds
 Google
 Google
 Trend*
 Trend site

 Opening &
 Searching
 Monitoring
 Tweet and 60 seconds 60 seconds 5 seconds 5 seconds
 Tweet*
 Trending
 Topic

 Total : 107
 Total : 3840
 Total Activity Total Activity seconds ~
 seconds ~
 : 11 :7 1.783
 64 minutes
 minutes

*done by system

Table 2. The Compare of Total Activity and Time Difference between Working System and Proposed System for
1 user

From table 2, we can see that the comparison of total activity that has been done with
working system is 11 activity, with the proposed system, there’s only 7 activity. The work
force is reduced by 36.36%. There’s also a big time difference, with the working system we
need 64 minutes but with the proposed system we only need around 2 minutes. That’s
96.87% time reduction. With the proposed system the business process hopefully be more
effective and efficient.

IV. Conclusion
 The conclusion that can be drawn from the research is that web scraping that has been
implemented and integrated in the system has been running well. Users can use web scraping
to retrieve news and job data. Then, the implementation of news search has gone well. Users
can search news with certain keywords. Users can also filter to select news from certain
websites and only certain dates. Google trend and twitter index data can be monitored through
the system and has been running well.

 The suggestion is that further news systems need to be added that are more complex,
namely by using search algorithms such as TF-IDF. Hoax news and irrelevant news also need
cleaning. Furthermore, it can be integrated with the Simple Web Solution Solution (WMSS) for
deeper mining text analysis. Data from other social media such as Facebook and Instagram
is also better collected.

 Several Big Data for official statistics projects including this study have been
communicated with the stake holders to get their feed backs. Most of the appreciated the
results. We also received valuable input and suggestion for further development.
V. References

[1] Bambang (2017). Kajian Analisis Sentimen Data Twitter menggunakan Metode
 Support Vector Machine dengan optimasi PSO dan Firefly [Skripsi]. Jakarta. Sekolah
 Tinggi Ilmu Statistik.
[2] Bangor, Aaron. dkk (2009). Determining What Individual SUS Scores Mean : Adding
 an Adjective Rating Scale. Journal of Usability Studies. Vol 4, 114-123.
[3] Bokányi, Eszter & Lábszki, Zoltán & Vattay, Gábor. (2017). Prediction of employment and
 unemployment rates from Twitter daily rhythms in the US. EPJ Data Science. 6.
 10.1140/epjds/s13688-017-0112-x.
[4] Brooke, John. (1996). SUS-A quick and dirty usability scale. Journal of Usability
 Evaluation in Industry.
[5] Connoly, Thomas. (2015). Database Systems : A Practical Approach to Design,
 Implementation, and Management Sixth Edition. England : Addison Wesley.
[6] Duckett, Jon. (2011). HTML and CSS: Design and Build Websites 1st
 Edition. Wiley.
[7] Duckett, Jon. (2014). JavaScript and JQuery: Interactive Front-End Web
 Development 1st Edition. Wiley.
[8] Dumbill, Edd. (2012). Planning for Big Data. California : O'Reilly
 Radar.
[9] Everett, Gerald D. dan Raymond McLeod, Jr. (2007). Software Testing: Testing
 Across the Entire Software Development Life Cycle. Wiley-IEEE Computer Society
 Press.
[10] Guttag, John V. (2013). Introduction to Computation and Programming Using Python.
 Cambridge, Massachusetts. The MIT Press.
[11] Hidayat, Rahmad. (2017). Pembangunan Aplikasi Web Mining Simple Solution
 (WMSS) : Modul Crawling, Data Management Berita, dan GUI [Skripsi]. Jakarta.
 Sekolah Tinggi Ilmu Statistik.
[12] Holovaty, Adrian dan Jacob K. Moss. Beginning Databases with PostgreSQL: From
 Novice to Professional, Second Edition. Apress Berkely.
[13] Hunter, Kirsten L. (2017). Irresistible APIs: Designing Web APIs That Developers Will
 Love. Manning Publications.
[14] Khan, Mohd. Ehmer. (2011). Different Approaches to Black Box Testing Technique for
 Finding Errors. International Journal of Software Engineering & Applications (IJSEA).
 Vol.2, No.4.
[15] Kouzis-Loukas, Dimitrios. (2016). Learning Scrapy. Packt
 Publishing.
[16] Matthew, Neil dan Richard Stones. (2015). Beginning Databases with PostgreSQL :
 From Novice to Professional, Second Edition. California : Apress Berkely.
[17] Mitchell, Ryan. (2015). Web Scraping with Python : Collecting Data from the Modern
 Web. United States of America. O'Reilly Media, Inc.
[18] Republik Indonesia. 1997. Undang-Undang No. 16 Tahun 1997 tentang Statistik.
 Sekretariat Negara. Jakarta.
[19] Suyuti, Nur Imron (2018). Pembangunan Sistem Klasifikasi Teks Berita Online sesuai
 Indikator Indeks Demokrasi Indonesia [Skripsi]. Jakarta. Sekolah Tinggi Ilmu Statistik
[20] Tuhkuri, Joonas (2014). Big Data: Google Searches Predict Unemployment in
 Finland, ETLA Reports 31, The Research Institute of the Finnish Economy.
[21] United Nation. 2017. The Sustainable Development Goals Report 2017.
 United Nation.
[22] Whitten, Jeffrey dan Loonie Bentley. (2014). Systems Analysis and Design Methods
 7th Edition. McGraw-Hill Irwin.
[23] Wijaya, Alifa Putri (2018). Kajian Indeks Harga Konsumen berbasis E-commerce
 GUI [Skripsi]. Jakarta. Sekolah Tinggi Ilmu Statistik
[24] Wongkar, Enggelin G. (2014). Pengembangan Sistem Web Crawler sebagai Sarana
 Riset Media secara Otomatis. Jurnal Aplikasi Statistik & Komputasi Statistik, Vol 2,
 115-139.
Attachment

Black Box Test

 No. Description Expected Result Result
 (1) (2) (3) (4)

 Precondition: Users are in the monitoring feature

 1 Open the home page Home page opens correctly √
 The previous news disappeared,
 Choose news from certain sites
 2 replaced with news that had been √
 choosen
 Display top tags on the news
 3 Top tags appear correctly √

 4 Displays a chart of the news total The chart appears correctly √
 The total of job vacancies appear
 5 Display the total of job vacancies √
 correctly
 Display the number of application The number of application appears
 6 √
 correctly
 The total of company appears
 7 Display the total of company √
 correctly
 Display a chart of the city from job
 8 The chart appearss correctly √
 vacancies
 Display a chart of the favorite
 9 The chart appearss correctly √
 company
 Display Index Google Trend chart
 10 The chart appearss correctly √
 Display Index Google Trend chart by
 11 The chart appearss correctly √
 provincies
 12 Display related query
 The query appearss correctly √
 13 Display the latest tweet
 The tweet appearss correctly √
 14 Display Indonesian Trending Topic The trending topic appearss √
 correctly

 Precondition: Users do a news search

 The news and total of bews
 15 The searched keyword found containing keywords will be √
 displayed
 A notification appears that the
 keyword is not found and asks the
 16 The searched keyword is not found user to do a search again or do √
 news scraping

 The start and end dates appear for
 17 Choose additional filters √
 news sorting
 Display news that sort by date
 18 Sort by date √
 correctly
No. Description Expected Result Result
(1) (2) (3) (4)

 Precondition: Users are in the news tabulation feature

 Display a chart of the news by month
19 The chart appearss correctly √
 Each row will display a button with
20 Display a daily table of total news the name of the site and the amount √
 of news on the site on that day

 The user selects the site button Users will be directed to details
21 √
 news
 Update charts and news tabulation
22 Pengguna mengganti bulan tabulasi √
 tables
 A notification appears that news is
23 Tabulations in that month do not not found and asks the user to do √
 have data web scraping

 Precondition: Users are in the job vacancy tabulation feature

 The table appears correctly
24 Display a table of job vacancies √
 A new tab appears which directs
 The user selects one of the job
25 the job link √
 vacancies

 Precondition: Users are in the news web scraping feature

 The user chooses a site to be A selection of sites will appear.
26 √
 scraping
 The user chooses the date for
27 Date selection appears √
 web scraping
 A process log will appear to show
28 Users click on the news scraping the scraping process. After scraping √
 start button is complete, a button will appear to
 see the results
 Users will be directed to news
29 Users choose to see results √
 details

 Precondition: Users are in the job vacancy web scraping feature

 A process log will appear to show
 The user clicks on the scraping job the scraping process. After scraping
30 button is complete, a button will appear to √
 see the results
You can also read