Principals' use of the Teaching, School, and Principal Leadership Practices survey tool - Cathy Wylie and Cathie Johnston
←
→
Page content transcription
If your browser does not render page correctly, please read the page content below

Principals’ use of the
Teaching, School, and
Principal Leadership
Practices survey tool
Cathy Wylie and Cathie Johnston
2021

This report can be downloaded from www.tspsurveys.org.nz

New Zealand Council for Educational Research
P O Box 3237
Wellington
New Zealand

www.nzcer.org.nz

ISBN 978-1-99-004022-1

© New Zealand Council for Educational Research, 2021
Contents
Acknowledgements                                                                                     iii

1.   Introduction                                                                                     1
     The Teaching, School, and Principal Leadership Practices survey tool                             1
     Investigating TSP as a tool in schools’ ongoing development                                      2

2. Why use TSP?                                                                                       4

3. How do principals use TSP?                                                                         5
     Principals use TSP for their own development and for appraisal                                   5
     Identifying priorities for development and change                                                6
     Checking teacher wellbeing and the pace of change                                                7
     Relating TSP data to other school data                                                           7
     Digging deeper                                                                                  8
     Tracking items over time                                                                        8
     Principals largely focus on the school journey                                                   9

5. Principals recommend the use of the TSP tool                                                      10

6. Discussion                                                                                        11
     Using survey data about practices for school improvement                                        11

Appendix                                                                                             14
     Appendix A Two examples of reporting with both principal and teachers’ ratings (trial school)   14
     Appendix B Use of TSP data interview questions                                                  16
     Appendix C Shifts in median scale scores 2017–2019                                              17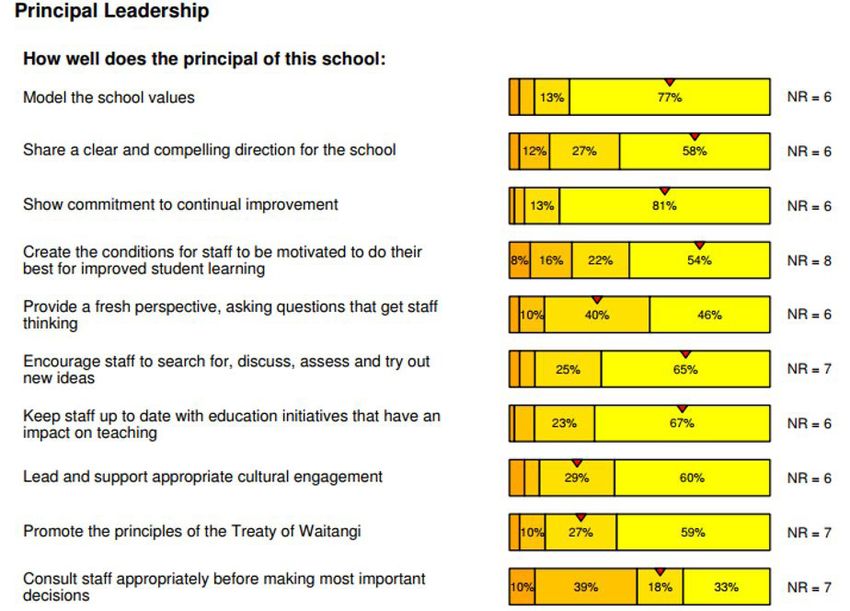
Acknowledgements

We are very grateful to the 10 principals who found time in their busy schedules to speak to us about
their continued use of the Teaching, School, and Principal Leadership Practices survey tool.
Our thanks also to Edith Hodgen, who undertook statistical analysis used in this report, and Heleen
Visser, for her helpful review of our draft report.
This work was part of NZCER’s Te Pae Tawhiti grant, funded through the Ministry of Education.

                                                  iii
1. Introduction
The Teaching, School, and Principal Leadership Practices survey tool
The Teaching, School, and Principal Leadership Practices survey tool (TSP) aims to give busy principals
good quality data about teacher, school, and leadership practices in their schools. The online tool is
available during Terms 2 and 3 each year, so it can be used when it suits an individual school.
TSP is funded by the Ministry of Education to provide schools with a reliable, free, and confidential
tool to support their ongoing development, and at the same time provide aggregate national
information about practice that can inform policy. The tool, advice on its use, information about its
development, and the aggregate reports are available at www.tspsurveys.org.nz.
The TSP tool has four sections:
The Teaching Practices/He Mahinga Kaiako section is completed by teachers and teaching principals.
It covers:
• Optimising students’ opportunities to learn (8 items)
• Diversity, equity, and inclusion (6 items)
• Learning-focused partnerships with parents/whānau and community (4 items)
• Teaching as inquiry (4 items)
• Being professional (7 items).
The School Practices / He Mahinga Kura and Principal Leadership / He Aratakinga Tumuaki sections
are both completed by teachers and principals.
The School Practices/He Mahinga Kura section focuses on practices that provide the conditions for
effective teaching.
It covers:
• Supportive and caring environment (9 items)
• Coherent curriculum and evaluation (9 items)
• School goals (9 items)
• Learning-focused partnerships (5 items)
• Teaching as inquiry (4 items)
• Strategic resource allocation (5 items)
• Professional feedback and support (4 items).
The Principal Leadership / He Aratakinga Tumuaki section focuses on principal practices, with two
domains:
• Directions and fresh horizons
• Interpersonal relations and working with others.
Questions are also asked about workload, morale, years of experience as teacher or principal, and
gains from Community of Learning | Kāhui Ako participation.
1Principals’ use of the Teaching, School, and Principal Leadership Practices survey tool
The items that teachers and principals rate are all drawn from the strong body of evidence now
available about effective teaching, school, and leadership practices. They align with key national
guidelines: The New Zealand Curriculum’s dimensions of effective pedagogy; the Education Review
Office’s (ERO’s) school evaluation indicators; the Standards for the Teaching Profession; and the
Educational Leadership Capability Framework. The development of the tool was supported by an
active advisory group which brought together knowledge, experience, and enthusiasm from the
peak education bodies, government education agencies, researchers, and professional development
providers.
Principals can download their school report whenever schools have completed the TSP. The report
gives them one set of results using teacher data, and another that locates the principal response in
relation to the teacher responses for the common items. A demonstration example of this reporting is
given in the Appendix A.
To underline the aim of using these data for ongoing improvement, the school report is owned by the
principal, who can decide how best to use it in their school context.
A brief survey at the end of TSP’s first year in 2017 had responses from 75 of the 403 schools that had
used it. Almost all of these principals said TSP supported teaching and learning in their school. Most
said the reports they got were useful. Many had already used the information in school review and
planning, and they could see its use for their own principal appraisal. Around half discussed their
school’s report with their leadership team, and they had shared it with their staff.
Investigating TSP as a tool in schools’ ongoing development
In late 2020, when this study was done, TSP had been available for 3 years—2017, 2018, and 20191—but
without the publicity of its first year, it was used by fewer schools in subsequent years. In total, 600
schools used TSP over these 3 years.
The TSP team at NZCER and our advisory group were not sure how often schools would use TSP:
whether it would become part of an annual cycle of data collection and use, or whether it would be
used periodically, as a health check. When we collated the 2019 aggregate national picture we found
that 105 schools had used TSP for 2 years in a row, 44 schools had used it in alternate years, and
54 schools had used it each year, with 50 having teachers taking part each year. These 50 schools
included a good range of school types (14 full primary, 20 contributing primary, three intermediate,
two composite, nine secondary, and two specialist schools) and school deciles.
We saw the opportunity to investigate how these schools have used their data, the role it plays in
relation to other data (such as student engagement and performance), and what supports or hinders
schools to make good use of data related to their practice.
Research questions
1. How has TSP data been used by schools doing TSP over 3 years, and why?
2. What other data has it been used with?
3. What supports or hinders use of TSP data for improvement?
4. Are different patterns of use associated with different patterns of change in TSP ratings over the
period?
1 Ministry of Education funding for TSP was not available in 2020.
21. Introduction
This report focuses mainly on the uses that school principals described. It starts, however, with a
summary of quantitative analysis of changes in TSP scores over time for these schools. We undertook
this to see if there were overall changes in TSP scores over the 3-year period for these schools, and
also to select a range of schools to approach for interviews with the principal.
The first step in this analysis was a global picture of the patterns over time for the 50 schools, using
median scale scores for teacher ratings on each of the three TSP aspects taken as a whole. Comparing
2017 and 2019, we found correlations of 0.49 in relation to school practices, and 0.59 in relation to
principal leadership, indicating that shifts have occurred over this time.
Appendix C shows these shifts in median teacher ratings for individual schools. The median scale
scores are on a scale of 0–3. We used teachers’ median scale scores on the school practices scale to
sort the schools into five categories:
• schools that had stable patterns 2017–2019
- nine had comparatively high median scale scores
- 23 had medium median scale scores
- four schools had low median scale scores
• seven schools where the median scale scores increased from a low or medium median score in
2017
• seven schools where the high or medium median scale scores decreased from 2017.
Then we randomly chose schools in each of these categories to provide a range of schools to
approach to participate in our research:
• two schools with comparatively high median scale scores
• two schools where high or medium median scale scores had decreased
• four schools with medium median scale scores
• two schools whose low or medium median scale score in 2017 had increased in 2019
• two schools whose median scale score remained low.
Ten of the 12 principals we contacted in late 2020 spoke to us about their use of TSP. One of the
schools we approached had changed principals, and the new principal was interested in TSP but had
yet to use it. We replaced this school with another. Two of the 12 principals we approached became
unavailable. Most of the interviews were by Zoom, or phone, with one face to face. The questions we
sent to principals ahead of talking with them are in Appendix B. We spoke with the principals of four
full primary schools, two contributing primary schools, and four secondary schools; their size ranged
from 37 students to more than 1,300 students.
We analysed our notes and transcripts of the interviews to identify themes and gain insights into what
principals valued, and why. This is reported in the following section.
Our conclusion picks up the growing emphasis on data use for improvement, and insights from
several US studies of principals’ use of school survey data about factors that can help or hinder such
use.
32. Why use TSP?
Among the reasons why principals used TSP each year were that:
• they find the items relevant and rich
• it’s a “one stop shop” for data that can be used for a number of purposes
• they trust NZCER as a provider of robust and valid research-based tools
• TSP is efficient of staff time
• TSP is safe for teachers; they can be sure their views are anonymous—and that gives principals
confidence that teachers are giving honest views
• results are quick.
Comments by principals included the following:
I really value the domains in TSP—each one is important to me in what needs to be valued in a
school. They really resonated. It’s amazing to have such good items for teachers to respond to. As
a leader, these are the things we should be basing our decisions on.
Unless we have data to support something with our teachers, it won’t fly. Everything we do is
based around data.
Good, probing items that really make you think and reflect on leadership. It provides coherency of
what to aim for.
43. How do principals
use TSP?
Principals used TSP reports to inform their own development and appraisal, to identify priorities for
change, check trends over time, and check whether change was happening at a sustainable pace.
They used TSP reports on their own, and also alongside other school data, particularly data about
student achievement, wellbeing, and engagement.
Principals use TSP for their own development and for appraisal
Most of the principals used the TSP reports for their own development and appraisals. The reports
provided useful evidence, as well as material for discussion and challenge.
It makes you think about things you maybe otherwise wouldn’t have thought of as part of your job.
It lines up very nicely with professional standards and your own job description.
My appraiser has used it [TSP report] really effectively, to have those challenging conversations.
Principals new to their school or first-time principals spoke of using TSP first to provide a baseline,
and then to track their progress.
I began wanting data about myself, as a first-time principal—what do staff think of me? I also had a
sense that the items in the survey were important, so getting a key focus from the data seemed a
good idea. I really value the principal data, I look through everything in detail, I focus on what the
teachers rate as a deficit, and I work on that next year, I discuss it with the BoT chair.
Principals were interested in how staff saw them, though it could be hard.
Some things hit you sensitively and personally.
Don’t obsess about what staff say about you—don’t think, ‘Who are the people who weren’t
positive about my leadership?’ They’re entitled to their view. This data helps you understand and
reflect. And that’s also why it’s valuable to work with your senior leadership team to unpack the
stuff.
Only one principal did not rate their own leadership practices.
The set of reports comparing principal and teachers’ responses was particularly valuable for
principals’ self-reflection, with some talking of “discrepancy” analysis where their own rating and
teachers’ ratings were markedly different, and provoking thought about why they differed.
In a very small school, the principal found it useful to reflect themselves on what evidence or thinking
had gone into their own rating of their leadership, as well as having team conversations to discuss
why these ratings, and constructive feedback, was so valuable.
5Principals’ use of the Teaching, School, and Principal Leadership Practices survey tool
Identifying priorities for development and change
The principals also spoke about using TSP to make cases for change, and to identify priorities for
focus and professional learning, usually working with their school leadership team.
I took over the school when morale was low, low levels of trust, the school was stagnating. People
needed some wake-up calls. The data from TSP helped to define where to push, when to push, and
when to pull back. I find discrepancies between my ratings and the teacher ratings give real food
for thought. I shared all the data with the principal response with the senior leadership team and
the board. I wanted transparency as well as a sense of unity in what needed to be done. With the
staff, I shared all the reports without my data, I provided an overview and used it to explain the
strategic decisions. The data backed me up.
We find it useful for our annual planning, and it highlights things we might not otherwise hit
on, like we’ve made an effort in the last couple of years to do something about leadership
development a bit more formally—none of the scores were so bad, but that score wasn’t as good
as the others, so we started a leadership development collaboration where we meet once or twice
a term with people who are aspirational, want to know more about leadership.
We’ve shared the data with our PLD provider, used it to help plan our PLD.
Senior leadership team have had to take a few on the chin. It showed that curriculum design was
not being supported by PLD—the focus of PLD was in the wrong place.
We ask the teachers to look at their own report,2 and just ask themselves two questions about the
patterns, two things you could get better at.
[in a small school] I just put the report on the staffroom table, principal and staff data together.
It allowed the conversations to generate themselves. This is how we work, informally, chats just
emerged, and individual staff did approach me also with comments we could discuss further.
[in a small school] We discuss the results at staff meeting, we highlight surprises or concerns,
look for things to work on, they become strategic goals, professional development, or inquiries.
We focus on an area of need—looking at student achievement, and the collaboration/sharing
items that made us focus on good ways to operate. Purposefully using the data. Can’t respond to
everything—we’re trying to work smarter.
Another principal, seeing no change in teachers’ reports of having sufficient time for collaborative
work when the school had made collaborative inquiry a priority in relation to improving student
learning, put aside her scepticism about students starting school late one day a week to give staff
a common time to work together. This school found that freeing up time this way was valuable and
allowed them to make progress. But another principal who also experienced some frustration in her
staff’s lack of progress with collective inquiry saw items relating to resourcing time as decided by the
teachers’ collective contract and the school meeting structure, and not within her control. Thus the
use of data to make change was also linked to how principals understood their remit.
Several principals found that teachers’ ratings of teaching practice items were higher than they would
rate them.
It showed me that their understanding of the items was different from what I saw of their
practice. It allowed opportunities to discuss pedagogy, and their knowledge and beliefs, promoted
challenging conversations—saw an eventual shift.
2 Teachers can download a PDF of their own responses.
63. How do principals use TSP?
It helped shift the staff culture. I could look at the ratings of teaching practice, and ask teachers to
show me their evidence for that rating.
TSP data were commonly shared with the school board of trustees, usually in summary form. They
were used as part of reporting on progress, charting what the school would focus on in the next year,
to support the board’s strategic understanding and thinking, and as evidence in cases for improved
resourcing.
They’re my employers, so if I want to do something, ask for resources, if I put myself in their shoes,
I’d want to know a little bit more detail to make that decision in relation to the bigger picture. The
way to do that is to provide data and the thought processes around it.
Checking teacher wellbeing and the pace of change
Principals also used TSP to gauge teacher morale so that shifts in practice were not undercut by
asking too much, too fast.
The TSP is a good way to take staff temperature, to review what is happening. Even with a
committed staff, you have late adopters, and it’s really important to listen and understand where
they are—important to have the signals. It helps me work with teachers to cope with challenges in
the process, helps to get things right as we go.
It’s a really good way to surface issues.
You think ‘I know my staff’, but you don’t know your staff. It’s a really useful reality check.
I needed a snapshot. I’m conscious of workload. There’s also the drive to improve—wellbeing and
teacher workload are an important part of the puzzle.
Making sure teachers are resourced and supported as a result of looking over items in the data.
Relating TSP data to other school data
Other relevant material was put alongside TSP, particularly evidence about student experiences, with
mention of the Wellbeing at School survey,3 Me and My School student survey,4 student attendance
and achievement data; in the context of what the school was working on to improve. What principals
who mentioned this were looking at was at a high level, of how consistent the picture was, and
whether changes in student views, attendance, and achievement were tracking in line with any
changes in teaching and school practices.
When we were looking at developing a wellbeing role, we used some of the TSP data to say this
is why we need to be focusing on wellbeing, and we linked it to what students are saying in the
Wellbeing at School data.
Sometimes when we look at an item in TSP and what kids say in Wellbeing at School, we see that
kids tell us the opposite. You can only work on a few things at a time, but that difference tells you
you’ve got something to work on.
3 The Wellbeing at School toolkit of surveys is also free to schools, and funded by the Ministry of Education. NZCER
developed the toolkit, hosts the tool, provides schools with their reports, and has analysed patterns at the national level.
https://www.wellbeingatschool.org.nz/
4 The Me and My School survey was developed by NZCER to provide schools with insight into their students’ engagement in
learning at the school. https://www.nzcer.org.nz/tests/me-and-my-school
7Principals’ use of the Teaching, School, and Principal Leadership Practices survey tool
Digging deeper
TSP data also led to further investigation. Usually this focused on particular TSP items and led
principals and school leadership teams to ask further questions, initiate staff discussions, and to try
ways of addressing the issues they had identified.
When we were concerned about the level of trust in the school early on, because we didn’t
understand why that was the case, we developed a set of questions around that and used our
[middle leadership] to ask teachers what they thought was working well and what we could
improve on. Again, actively taking the [TSP] result and saying we want this to be better, and how
can we go about it.
One year teachers wanted more time so we rescheduled meetings, carved time out of the
schedule, but a year later teachers hadn’t changed their opinions, so the leadership team had to
think—why do they feel like that?
We didn’t look so flash on students being set challenging learning goals, and I was thinking about
the annual plan for next year, and whether we should look more deeply into what success is for
individual students, move away from numerical targets like the 85% NCEA Level 2 success. So in
the teacher only day this week staff will work in departments, and look at that one item and share
what they were thinking about, whether they answered it positively or not, and what do you think
it means? A gentle, light touch way of asking people to think about it. Because anything in the TSP,
you have to find out more about it if you’re making a decision about what you’re going to do.
Tracking items over time
Most of the principals tracked items that gave them some evidence about a priority area for the
school.
It’s good for evaluating the impact of the initiatives we’ve put in place, and seeing whether we’ve
done a good job.
One principal noted that ratings on the teaching practice items could go down after professional
development: “they were rating quite well, then the more you know, the teacher ratings actually
declined”. Another observed “the more you know about something, or have deeper understanding,
the more likely you are to give a more critical rating of your practice”. What principals were often
watching for was patterns across the items, in relation to changes or stages in change; for example,
in timetable organisation, new pedagogical approaches, and PLD, rather than simply changes in the
frequency data on the TSP.
Care needed to be taken in small schools not to read too much into changes in percentages or
numbers. One small school principal also thought tracking over time was not useful when there was
not continuity in staff over the period.
Principals focused on shifts at “either end” of the item frequencies: for the schooling practices items,
these would be the proportion who rated a practice as “not at all” or “a little” like our school at one
end, and the proportion who rated a practice as “very like our school”.
A couple noted caution about putting too much weight on shifts if the numbers of teachers doing the
survey each year was markedly different. Some noted the importance of providing a common time for
all teachers to complete the survey. This also gave them more control over when they had the school
picture.
83. How do principals use TSP?
Principals largely focus on the school journey
The national aggregate reports and summaries for each year have been put on the TSP website and
an email sent out about them to all the principals who registered for use of TSP that year. Few of the
principals had looked at these aggregate reports. They were using TSP for their own self-review and
planning, not for comparison with a national picture or with other schools.
Each school is different. No-one else has got my children. It’s more the change over time that’s the
true test.
I’ve got no time for that. You need to deal with what’s in front of you, to get the data on how that’s
going.
The value for me in using TSP is about the school’s journey, not comparing with national averages.
What would be good for a school that had worked hard to change things over a few years would
not be so good for another, it would be a sign of complacency. If you were comparing, it should be
like with like in terms of challenges and journey, not just school characteristics.
The interviews with these 10 consistent users of TSP underlined the value they found in data that
were specific to their school. They approached these data as something to be used alongside
other knowledge and data, as a barometer, as food for thought, as a guide. They were not seen as
something that classified the school, as standing on its own.
We were interested to see how our five global categories of median score levels and shifts between
2017 and 2019 were related to what the principals reported about the use they had made of their
school’s data. We could not see a clear pattern: there were positive shifts, for example, in schools
whose median scores stayed low. Perhaps a much larger study over a longer period would show
more affinity. But as the principal quoted above observes, the speed of change in an individual school
reflects the challenges it faces, as well as its ambitions and capability.
We found when we looked at changes in the individual items for each school that there were positive
shifts in some teacher ratings in every school, some slippage in some items, and some that stayed
much the same. These patterns also underline the multifaceted nature of schools, and the likelihood
that most development over time will not be smooth or uniform across a school.
95. Principals recommend the
use of the TSP tool
When we asked these principals for any advice they would give other principals about TSP, they
recommended its use, and doing it in staff meetings so that all teachers were included. They also
talked about the value of discussing the data it produced with knowledgeable advisers beyond
the school as well as the school’s leadership team and groups of teachers. And they spoke of the
importance of focusing on key aspects that mattered—to where the school was on its journey, an
aspect that would make a big difference for students, their students’ needs, and staff morale—rather
than trying to grasp and respond to each item in the data.
Some would like TSP to be extended to include support staff, and parents and whānau. Some would
welcome longitudinal individual school reports that tracked each item over time. Some would like to
have a resource that linked items with relevant research and guidance.
106. Discussion
Using survey data about practices for school improvement
We live in a data-rich world, but not a world with much time to examine data. Aotearoa New Zealand
principals have increasingly complex roles, with NZCER’s national surveys showing that most cannot
schedule enough time for educational leadership even with the long hours they work.5
Use of data for improvement is identified as one of the nine Educational Leadership capabilities
identified in the Leadership Strategy | Rautaki Kaihautū.6
Evaluating practices in relation to outcomes
An organisational leader:
Ensures that the organisation produces useful, consistent, and robust information about:
• all learners’ achievement across the whole curriculum, patterns of progress over time, their
engagement in learning, and their wellbeing
• organisational practices
• staff wellbeing,
enabling analysis over time to see what needs to be strengthened.
Analyses the learner and practice data in relationship with each other, asking what they indicate
about progress towards the organisation’s vision and goals.
Identifies any “puzzles” and finds out about what is happening in the organisation, and what
is known about the causes of the puzzle and effective responses to it by drawing on relevant
research and working with trusted advisers beyond the organisation, either by themselves, or in
collaboration with relevant staff member/s.
Uses this analysis and enlarging of their knowledge in the discussion they have with positional
leaders and organisational stakeholders to identify actions to improve, and the best way to
allocate resources across the organisation.
5 Bonne, L., & MacDonald, J. (2019). Secondary schools in 2018. Findings from the NZCER national survey. NZCER. https://www.
nzcer.org.nz/system/files/NZCER_Nat-Survey-Report-Secondary.pdf. See Section 7, Principals’ perspectives on their
work. Wylie, C., & MacDonald, J. (2020). What’s happening in our English-medium primary schools. Findings from the
NZCER national survey 2019. NZCER. Section 14, Principal careers, wellbeing, and support. https://www.nzcer.org.nz/
research/publications/what-s-happening-our-english-medium-primary-schools-findings-nzcer-national-0
6 Leadership_Capability_Framework.pdf (cwp.govt.nz)
11Principals’ use of the Teaching, School, and Principal Leadership Practices survey tool
TSP was funded by the Ministry of Education to be a “smart tool”7 for school use, which would also
provide insight for national policy—the frameworks and supports that should enable school leaders
and teachers to do well with their students.
The principals we interviewed found that TSP provided meaningful data that they used as a check
on how things were going, and to identify aspects for closer attention or improvement. This use is in
line with the expectations of the Evaluating practices in relation to outcomes leadership capability.
Those who made most use of TSP data were those who could unpack the TSP data alongside other
data, and discuss it with trusted others to check assumptions and develop strategies for the ongoing
improvement of practices that would benefit students. Not every principal was confident in drawing
different kinds of data together, or had such advisers.
Some found the difference between their own and teachers’ ratings of school practices and principal
leadership particularly useful, though it could also be hard. Studies of feedback surveys in the US
school context have focused on the use of such discrepancies, and point to the value of support for
principals as they unpack data.
Some US school systems have required teacher surveys and ratings of principals, sometimes with high
stakes. Goldring et al. (2014)8 interviewed 14 principals in one school district to understand whether
the assumption that such feedback was useful was valid. They note that such “multisource” feedback
can produce dissonance with a leader’s own view of their effect, and cite a study finding that it “can
expose the domains of leadership behavior most in need of improvement” (p. 575). However, they
also cite research showing that leaders’ reactions to multisource feedback in other fields are highly
variable, and research from management literature on the role played by leaders’ own self-awareness
in their own ratings.
The reports the principals received compared their own response with their teachers’, and also
these responses with other schools in the district. Principals whose teachers rated items lower than
their own self-rating tended to be more defensive, more likely to “explain away” teacher ratings,
and less likely to use the feedback. Where average teacher ratings at a school were lower than the
principal’s but higher than the district average on items, one principal used the comparison to “justify
maintaining the status quo” (Goldring et al., 2014, p. 589). In this context, it was easier to see ratings
as a judgement, rather than information to be used to improve school and leadership practices.
Goldring et al. recommended “scaffolding principals’ learning around how to productively manage the
cognitive dissonance they experience” (p. 592).
Martin-Kniep and Lane (2020, p. 18) note that effective school surveys designed to inform continuous
improvement use “an evidence-based framework [that] allows users to quickly visualise areas for
growth and strength, as well as to track change over time”.
They also noted that “in our work with leaders we have found that it is difficult for principals to
actively use teacher survey data without directly referencing, or being able to assess, how their own
actions and perceptions mesh with teachers’ perceptions” (p. 18). They describe how one principal
7 “Smart tools” incorporating sound theory which are well designed for practical use is a concept developed and described
in the School Leadership Best Evidence Synthesis, which remains a prime source of understanding of effective leadership
practices.
Robinson, V., Hohepa, M., & Lloyd, C. (2009). School leadership and student outcomes: Identifying what works and why.
Best evidence synthesis iteration [BES]. Ministry of Education. https://www.educationcounts.govt.nz/publications/
series/2515/60170
8 Goldring, E. B., Mavrogordalo, M., & Taylor Haynes, K. (2014). Multisource principal evaluation data: Principals’ orientations
and reactions to teacher feedback regarding their leadership effectiveness. Educational Administration Quarterly, 5(4) 572–
599. https://doi.org/10.1177/0013161X14556152
126. Discussion
became more effective and teaching practices improved through a focus on items where teacher and
principal ratings diverged, using these to consider what actions the principal could take to change
teaching practices, rather than “dwelling on explanations as to why there are differences … which can
lead to potentially defensive or non-productive responses” (p. 27).9
Most of the principals we spoke with were discussing the school’s TSP data within the school, and
some with their appraiser. Some would like to use knowledgeable advice beyond the school to make
the most of the data. The US studies underline the importance of “sense-making” with others who are
also invested in a school’s wellbeing and its students’ success.
NZCER was entrusted with the development of TSP as a credible, trustworthy, and timely source of
data for school leaders and teachers that would support self-evaluation.10 This small study reassures
us that TSP is fit for its purpose for school leaders.
9 Martin-Kniep, G. O., & Lane, B. (2020). Using parallel surveys and reflective conversations to tap perspectives and promote
improvement. AASA Journal of Scholarship and Practice, 17(1), 16–30.
10 It would be good to know what use teachers make of the teaching practices items for their own reflection, discussion with
others, and as a spur to change. Teachers can download a PDF of their responses, and could use these to track change
over time.
13Appendices
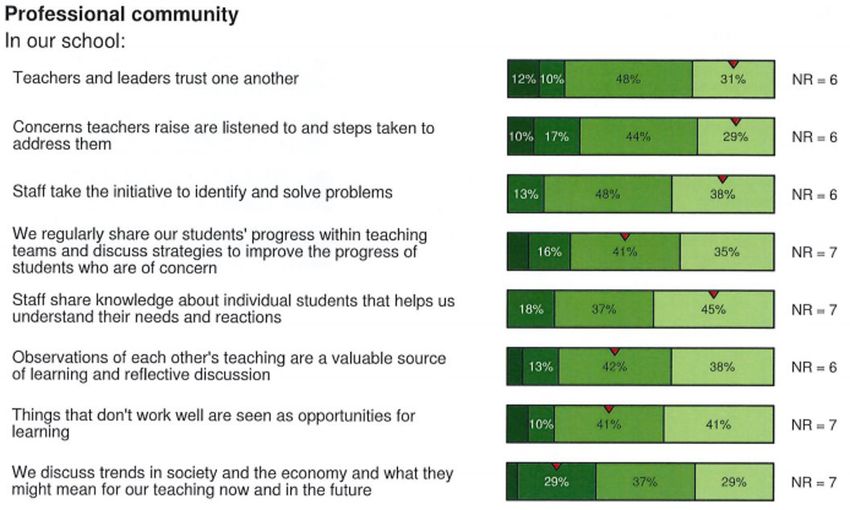
APPENDIX A Two examples of reporting with both principal and teachers’
ratings (trial school)
14Appendix 15
Principals’ use of the Teaching, School, and Principal Leadership Practices survey tool

APPENDIX B Use of TSP data interview questions
 1. Why did you use TSP for 3 years in a row?
 2. How do you look at the TSP data and who is involved in this use? (e.g., yourself, leadership team,
    teachers, external adviser, board chair?)
    – Do you look at all the data—all the scales and items—each year, or focus on just a few?
    – What’s the most useful part of the data for you, and why?
    – What’s the least useful part of the data for you, and why?
 3. What purposes do you use the TSP data for? (e.g., school planning and review, reporting, your
    own development, development of other staff?)
 4. Have you tracked particular items or scales over time? Has that been useful?
 5. What’s the role of TSP in relation to other school data?
 6. Do you compare your school’s TSP data with the aggregate TSP picture?
 7. Has the way you use the data changed over time?
    If so, what are the reasons?
 8. What is your take on the patterns over time for your school?
 9. Looking back, what were the main goals, things you worked on changing, and challenges for the
    school 2017–2019?
 10. What advice would you give other principals about TSP and its use?
 11. What support or advice, if any, would you like to make the best use of TSP for your school?

                                                         16
Appendix
APPENDIX C Shifts in median scale scores 2017–2019
The table below shows the median teacher scores on each of the three TSP scales 2017–2019 for the
schools that did TSP each year, grouped by their median scores on the school practices scale.
HH = high median score both years
HorM D = high or medium median score in 2017, decreased in 2019
MM = medium median score both years
LorM U = Low or medium median score in 2017, increased in 2019
LL = Low median score both years
The table shading compares median scores, running from dark blue for the highest median score,
through lighter blues, white, shades of pink, to red for the lowest median score among these schools.
TP.All.2017 TP.All.2018 TP.All.2019 SP.All.2017.x SP.All.2019.x PL.All.2017.x PL.All.2019.x SP.x
2.15 2.26 2.33 2.58 2.55 2.68 2.70 1 HH
2.39 2.48 2.18 2.79 2.53 2.94 2.74 1 HH
2.14 2.03 2.34 2.47 2.75 2.50 2.71 1 HH
2.16 1.94 1.89 2.65 2.75 2.77 2.60 1 HH
2.22 2.04 1.99 2.58 2.61 2.82 2.82 1 HH
1.92 2.28 2.24 2.59 2.66 2.84 2.57 1 HH
2.41 2.22 2.30 2.87 2.60 2.80 2.84 1 HH
2.47 2.30 2.03 2.89 2.76 2.98 2.96 1 HH
2.07 2.03 2.02 2.53 2.54 2.42 2.70 1 HH
2.09 2.12 1.98 2.08 1.88 2.31 1.94 2 HorM D
1.99 2.03 2.01 2.32 1.80 2.38 1.81 2 HorM D
2.20 2.30 2.13 2.56 2.34 2.86 2.65 2 HorM D
2.03 2.14 2.11 2.50 2.30 2.57 2.71 2 HorM D
1.86 1.80 1.93 2.56 2.01 2.34 2.21 2 HorM D
2.12 2.14 2.21 2.50 2.45 2.53 2.60 2 HorM D
1.97 2.38 1.79 2.58 2.11 2.35 2.13 2 HorM D
1.95 2.01 2.12 2.15 2.46 2.29 2.73 3 MM
1.43 1.52 1.58 2.27 1.97 2.36 1.91 3 MM
1.89 1.94 2.07 2.24 2.10 2.43 2.58 3 MM
2.17 2.09 2.11 2.22 2.06 2.35 2.44 3 MM
1.96 1.96 2.06 2.12 2.21 2.38 2.34 3 MM
17Principals’ use of the Teaching, School, and Principal Leadership Practices survey tool
TP.All.2017 TP.All.2018 TP.All.2019 SP.All.2017.x SP.All.2019.x PL.All.2017.x PL.All.2019.x SP.x
1.87 2.02 2.07 2.22 2.06 2.18 1.76 3 MM
2.31 2.23 2.21 2.28 2.27 2.06 2.07 3 MM
1.94 1.49 2.20 2.22 2.38 2.54 2.70 3 MM
2.19 1.96 2.09 2.14 2.33 2.08 2.55 3 MM
1.82 1.82 1.95 2.01 2.12 1.99 2.17 3 MM
2.04 1.89 2.32 1.97 2.36 2.48 2.69 3 MM
2.10 1.97 2.09 2.21 2.26 2.28 2.36 3 MM
1.88 1.87 1.98 1.97 2.10 1.86 2.03 3 MM
1.64 1.87 2.03 2.22 2.47 2.58 2.78 3 MM
1.93 2.01 1.97 1.99 2.45 2.17 2.48 3 MM
2.16 2.21 2.25 2.44 2.47 2.72 2.77 3 MM
1.89 2.02 2.02 2.32 2.35 2.74 2.56 3 MM
1.72 1.70 2.07 2.01 1.97 2.26 2.34 3 MM
1.31 1.51 1.55 2.44 2.31 2.61 2.51 3 MM
2.16 2.08 2.06 1.99 2.42 1.82 2.84 3 MM
1.98 1.98 2.02 2.38 2.16 2.45 1.85 3 MM
2.10 1.86 2.09 2.04 2.10 1.82 1.66 3 MM
1.79 1.70 1.70 2.16 2.15 2.70 2.46 3 MM
1.97 1.94 2.45 1.78 2.87 1.85 2.63 4 LorM U
1.77 1.77 1.89 2.36 2.72 2.13 2.97 4 LorM U
2.18 2.40 2.29 1.93 2.16 1.99 2.14 4 LorM U
2.23 2.01 2.40 2.36 2.61 2.13 2.31 4 LorM U
2.19 2.33 2.16 1.82 2.09 2.11 2.36 4 LorM U
2.73 2.07 2.04 2.14 2.90 1.68 3.00 4 LorM U
1.72 1.84 1.80 2.01 2.67 2.87 2.95 4 LorM U
1.80 1.78 1.74 1.61 1.70 1.89 1.85 5 LL
1.92 1.96 1.89 1.61 1.79 2.12 2.10 5 LL
2.15 2.19 2.08 1.74 1.92 1.52 1.77 5 LL
1.83 2.03 1.81 1.89 1.31 1.26 0.78 5 LL
18New Zealand Council for Educational Research facebook.com/nzcer @NZCER www.linkedin.com/company/new-zealand- council-for-educational-research
You can also read