Shifting the System: Food Access and Availability in Latrobe City - December 2014
←
→
Page content transcription
If your browser does not render page correctly, please read the page content below

Healthy Food Connect

Shifting the System:
Food Access and
Availability in Latrobe
City
December 2014

  Report prepared by:

  Nikki Visser1, Julia McCartan1,2

     1. Monash University

     2. Healthy Together Latrobe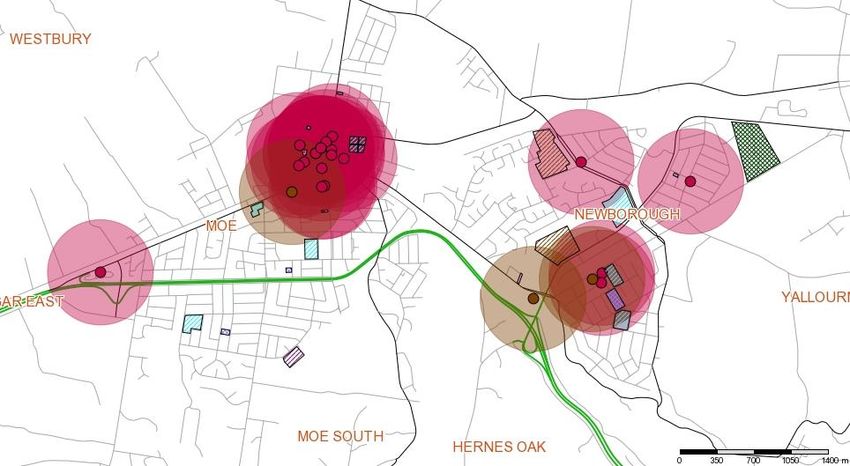
Shifting the System:
Food Access and
Availability in Latrobe
City
December 2014
Contact
Julia McCartan

Food System Research Officer

Healthy Together Latrobe

P: 1300 367 700 1300 367 700

E: latrobe@latrobe.vic.gov.au

To receive this document in an accessible format phone 1300 367 700 or email latrobe@latrobe.vic.gov.au
Except where otherwise indicated, the images in this publication show models and illustrative settings only, and do not necessarily
depict actual services, facilities or recipients of services.
© Copyright, Healthy Together Latrobe, Nov 2014

Healthy Together Latrobe, supported by the Victorian Government and partners, is improving the health of our community.
Contents

Executive Summary ........................................................................................ 1

Background ...................................................................................................... 3

Methods ............................................................................................................ 6

Findings ............................................................................................................ 8

Discussion...................................................................................................... 21

References ..................................................................................................... 25

Acknowledgments ......................................................................................... 28

Appendices .................................................................................................... 29
Executive Summary
Only 7% of Latrobe City residents eat the recommended servings of fruits and vegetables each day.
Research has shown that the cost and availability of fresh produce is a significant predictor of eating
habits and the consumption of fruits and vegetables. Research was undertaken to assess the cost,
availability and level of access to food within Latrobe City. This project forms builds on previous food
system research conducted in Latrobe City in 2013.

The price and availability of fresh produce in Latrobe was investigated by conducting the Victorian
Healthy Food Basket (VHFB) survey in 28 food retailers. Access to food within Latrobe City was analysed
by mapping different categories of food outlets in a Geographic Information System (GIS) mapping
program. This study has identified that the Latrobe City food environment provides inequitable access to
affordable, nutritious foods, particularly fruits and vegetables.

Key findings of this research include:

•    The cost of a healthy food basket can vary significantly by up to $170 across the region.

•    The satellite towns of Latrobe City are the most expensive area to purchase a healthy food basket for
     a family of four in Latrobe ($501.78).

•    The major centre of Morwell is the cheapest area to purchase a healthy food basket for a family of
     four ($449.93).

•    The cost of a healthy food basket in Latrobe is $33.44 more expensive compared with the Victorian
     average.

•    It is $35.22 cheaper to purchase the fruit and vegetable component of a healthy food basket for a
     family of four from greengrocers compared to supermarket retailers.

•    Takeaway food outlets account for 32% of the total food outlets in Latrobe City. This is a significant
     share of the total number of food outlets when compared to retailers that sell fresh produce such as
     supermarkets (7%), greengrocers (1%), and bakery, butcher, fishmonger and poultry retailers
     combined (14%).

•    For every one fresh food outlet in Latrobe (supermarket or greengrocer) there are 3.7 takeaway or
     fast food outlets.

•    Out of the 18 fruit and vegetable items surveyed, some satellite towns were missing up to 16 items,
     indicating significant gaps in access to fruits and vegetables in these towns.

•    There are also gaps in access to supermarket and greengrocer retailers in the major centres of
     Latrobe City.

Food Access and Availability in Latrobe City                                                              1
• There are a significant number of food outlets selling unhealthy food items in close proximity to
education centres in Latrobe City.
• Additionally, many food outlets selling discretionary food items are in close proximity to some of the
most disadvantaged areas of Latrobe City.
There is a clear need for strategies and initiatives that increase the supply of fresh produce in both major
centres and the smaller satellite towns in Latrobe City. The findings of this research should be used to
advocate for change to the local food system to key decision makers within and external to local
government. Additionally, this evidence can inform and assist greater collaboration with the food retail
sector in Latrobe City.
Recommendations for future action include:
Continue to emphasise the importance of considering the food system within council policies, plans,
strategies, and legislation using this research as an evidence base.
Use the Latrobe Food System GIS mapping information to inform future town planning and
development to ensure that there are acceptable levels of access to fresh food outlets.
Investigate the logistics of increasing the supply of fresh produce to satellite towns, ‘food deserts’ and
disadvantaged areas in major centres/Encourage local greengrocers and supermarket retailers to
improve delivery to these areas.
Encourage and support takeaway food and dining outlets to offer healthier menu options that include
fruits and vegetables.
Encourage the development of more community gardens and local food hubs, particularly in smaller
towns of Latrobe and outskirts of major centres
Support mixed businesses e.g. petrol stations, milk bars and convenience stores to increase their
supply of fresh produce.
2 Food Access and Availability in Latrobe City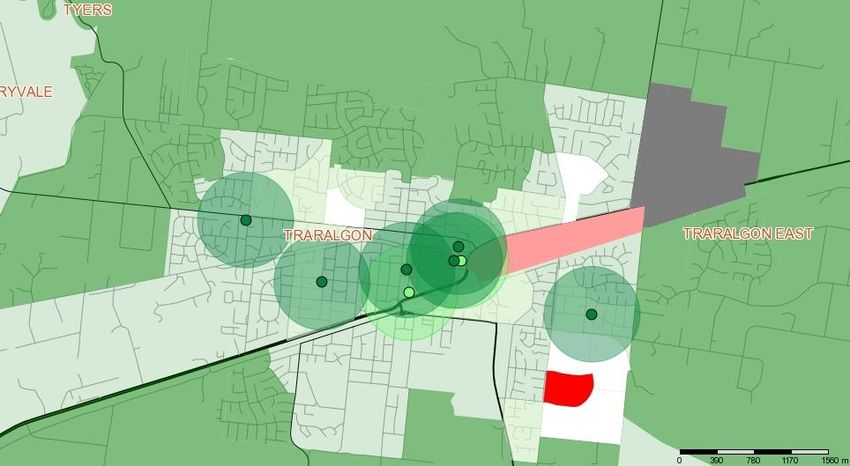
Background

The Problem
According to preliminary survey findings from the
Victorian Population Health Survey Report 2011-
12, rates of overweight and obesity in Latrobe
                                                            1
are 10% higher than the Victorian average.
60.6% of Latrobe residents are considered
overweight or obese compared with the Victorian
                            1
average of 49.8%.               Additionally, only 7% of
adults in Latrobe meet the recommended daily
intake of two serves of fruit and five serves of
                        1
vegetables a day.               This figure exceeded the
Victorian average of 5.2%, however these rates
                                    1
are still considerably low. Fruit and vegetable
consumption is particularly important as a
nutritious diet high in fibre, vegetables and fruit
                                                                                                      2, 3
protects against chronic diseases such as heart disease, cancer, diabetes and obesity.                       A nutritious diet
                                                                                             4, 5
is recognised as important in maintaining and improving health and wellbeing.                       Additionally, the cost
                                                                                                      5
and availability of nutritious food is a recognised as an important determinant of health.

Factors influencing healthy eating

The factors influencing healthy eating habits are complex. However, the availability and cost of nutritious
                                                                             4, 6
foods are widely accepted as factors which influence eating habits.                 Physical access to nutritious foods
                                               4, 7
is an important determinant of health.                Research has shown that individuals who have access to good
nutritious food are more likely to consume a healthy diet and are less likely to be obese than those who
                                                      8
do not have the same level of access. Additionally, access to good, affordable food makes more
difference to what people eat than health education, therefore it is important to ensure that individuals
                                                                                                             6
have access to a nutritious food supply and are not just educated on the ‘right’ way to eat.

Cost is also a large predictor of healthy eating habits as studies have shown that diets high in fruit and
                                                                                                                 2
vegetables are more expensive than diets which are high in sugar, salt and saturated fat. This means
that for low income or welfare dependant individuals and families it can cost a significant proportion of
their income to purchase the foods required for a healthy and nutritious diet. Studies in Australia have
shown that low income households are less likely to buy and eat healthy food, with income shown to be

Food Access and Availability in Latrobe City                                                                                3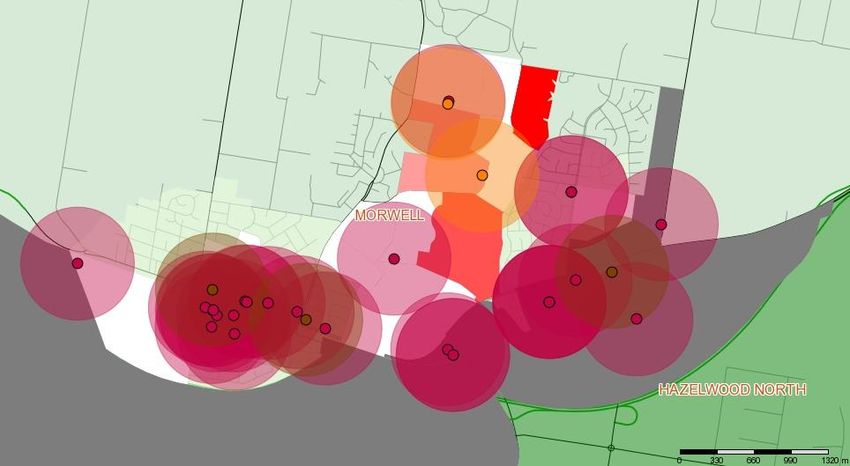
9
the biggest predictor of food purchasing behaviour, compared to education and occupation. Furthermore,
it should be noted that Latrobe City has lower rates of median total weekly family income than Victoria
10
with $1236 the average in Latrobe compared to $1460 in Victoria. This is a difference of $224. The
lower rates of total family income for families in Latrobe may be a factor contributing to the lower rates of
fruit and vegetable consumption occurring in the region. However, there is currently little understanding of
the level of access, cost and availability of food across all regions within Latrobe City.
The purpose of this report
To present a visual representation of food access and availability within Latrobe City by conducting
Geographic Information System (GIS) mapping.
To report on the findings of the Victorian Healthy Food Basket (VHFB) survey regarding the cost of
and access to food within Latrobe City.
To provide evidence-informed strategies to relevant stakeholders to improve Latrobe residents’
access to healthy and affordable food.
This project will address the first two steps of the Victorian Government’s Healthy Food Connect
framework: ‘Undertake a local food needs assessment’ and ‘Identify and prioritise actions’ and builds on
11, 12
previous food system research conducted in Latrobe City in 2013.
Healthy Together Victoria
Healthy Together Victoria is a state wide systems-based initiative that aims to improve the health of
13
people where they live, learn, work and play. The Healthy Together Victoria initiative focuses on the
underlying causes of poor health in workplaces, communities and children’s settings by encouraging
13
healthy eating and physical activity, and reducing smoking and harmful alcohol use . Twelve locally led
13
Healthy Together Communities operate throughout Victoria, including within Latrobe City. Latrobe City
Council and Latrobe Community Health Service together form Healthy Together Latrobe.
Previous Research
Research was previously conducted on Latrobe City’s food system by Monash Nutrition and Dietetics
12
students in 2013. A situational analysis of the natural, socio-cultural, economic and built environments
within the Latrobe food system was conducted and identified a number of potential opportunities for future
action. This research also identified that in recent years, two local fruit and vegetable wholesalers and
four sole fruit and vegetable retailers had closed, which has implications for fruit and vegetable access
12
and consumption rates in Latrobe City over the past few years. This report acknowledges and builds on
this previous research conducted in 2013.
4 Food Access and Availability in Latrobe City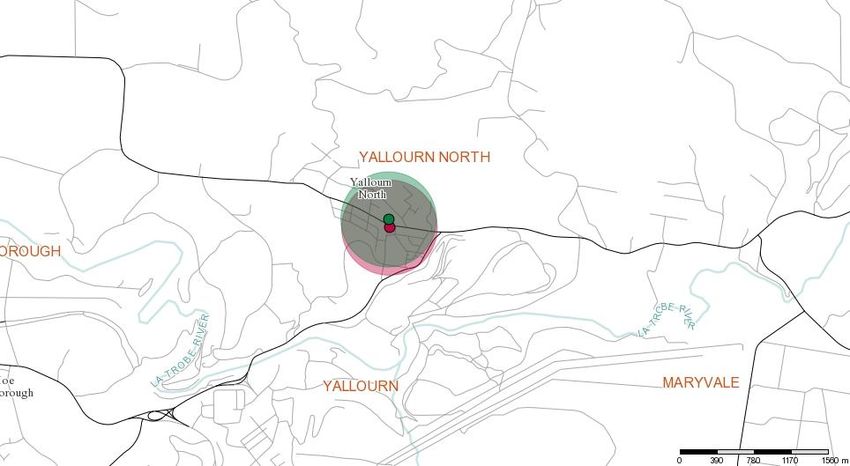
Context

The City of Latrobe is located approximately 150kms east of Melbourne and contains the four major
                                                                          14
centres of Traralgon, Morwell, Moe/Newborough and Churchill.                   Smaller townships located within
Latrobe City include: Boolarra, Glengarry, Toongabbie, Tyers, Traralgon South, Yallourn North and
        14
Yinnar.      There were over 73,788 residents living in Latrobe in 2011, with that population expected to
                                  15
increase to 78,215 in 2021.            The Socio-Economic Indexes for Areas (SEIFA) ranking is a measure of the
relative level of advantage and disadvantage in an area. The lower the ranking the more disadvantage in
an area. Conversely, the higher the ranking the less disadvantage in an area. Latrobe City has a SEIFA
                                                                                                    16
ranking of 940 and is ranked 133 out of 564 in all local government areas in Australia.                  Furthermore,
Morwell and Moe are ranked in the top 10 percent of the most disadvantaged towns in Australia, and are
                                                                                               17
also ranked as the fourth and sixth most disadvantaged towns in Victoria respectively.              There are also
considerably higher levels of unemployment in persons aged 15 years and over in Latrobe compared to
                                               10
Victoria, 7.9% and 5.4% respectively.

Food Access and Availability in Latrobe City                                                                        5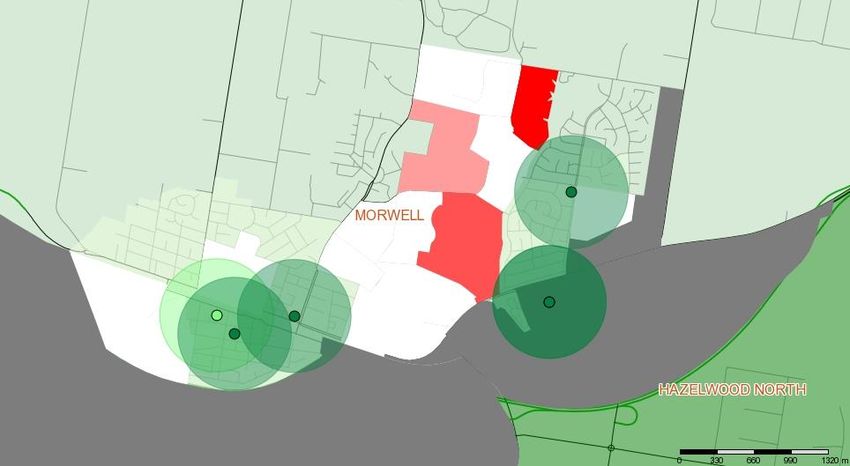
Methods

Victorian Healthy Food Basket Survey
The Victorian Healthy Food Basket (VHFB) is a tool developed by Monash University to measure the cost
of a ‘healthy food basket’ for four different family types: a family of four (two adults and two children), a
                                                                        18
single mother with two children, a single male, and an elderly woman.        During this study, VHFB surveys
were conducted in Latrobe City and data was collected from food retailers including supermarkets,
greengrocers, convenience stores and mixed businesses (n = 28) using the VHFB tool. See Appendix 1
for a list of stores where surveys were conducted. VHFB data was collected over a one month time frame
from late August to end of September 2014, with the majority of stores surveyed within a three week
timeframe to reduce the variability of price in seasonal produce. The price was recorded for each
cheapest, non-generic product, with promotional or special prices ignored as per VHFB protocols.

All supermarkets and green grocers within Latrobe City were surveyed except for one supermarket where
management refused. Although greengrocers typically do not stock all the items included in the survey,
they were included in the data collection so that comparisons could be made between the cost of fresh
fruit and vegetables in greengrocer retailers compared with supermarket retailers. Data analysis was
conducted on only the fruit and vegetable component of both baskets. Several convenience stores and
mixed businesses were included in the data collection as these can be the only or nearest food access
point for many Latrobe residents, particularly those living in some of the smaller satellite towns. Whilst
many of these businesses were missing items from the VHFB survey it was important to include these in
the data collection as each of these businesses have the potential to stock all items contained in a
healthy food basket.

All stores were grouped into four area codes as seen in Figure 1. Major centres were each given their
own area code and the smaller satellite towns of Latrobe City were combined into one area code so that
no individual businesses could be identified in the data analysis, as per VHFB protocols. Comparisons
could then be made in the cost of a healthy food basket between the major centres (area codes 1, 3 and
4) and the satellite towns of the region (area code 3). Analysis was conducted on the mean, median,
standard deviation, minimum and maximum values for each of the four area codes as well as for Latrobe
City as a whole. Averages were also calculated for the percentage of income that a healthy food basket
would cost a family of four (two adults and two children) receiving Centrelink benefits. An analysis of the
availability of fruit and vegetables was also conducted in the satellite towns. This was done to better
understand the level of fruit and vegetable access away from Latrobe’s major centres as often there was
only one food access point for residents in these towns.

6                                                                       Food Access and Availability in Latrobe City
Figure 1: Area codes for VHFB analysis
Area Code Township/s
1 Moe, Newborough
2 Morwell
3 Churchill, Boolarra, Yinnar, Yallourn North, Glengarry, Toongabbie, Tyers, Traralgon
South
4 Traralgon, Traralgon East
Significance tests were conducted on the following data comparisons: satellite versus major centres, and
greengrocers versus supermarkets (fruit and vegetables only). These non parametric data sets were
analysed using SPSS (version 21.0). A Mann-Whitney U-test was conducted and a significance limit of
p=0.05 was set. Where the p-value was less than 0.05 the results were deemed to be statistically
significant. Where p-value equalled greater than 0.05 the results were deemed to be not statistically
significant.
GIS Mapping
Geographic Information System [GIS] mapping was undertaken for all food access points within Latrobe
City. GIS mapping is a tool that assists in the collection and display of data in relation to its place and is a
19
useful public health tool. GIS data can be mapped in relation to other key infrastructure and public
health information including transport routes, schools, hospitals, and other amenities. GIS mapping was
used in this project to gain a better understanding of geographical distributions of different types of outlets
throughout Latrobe City, the density of different types of food outlets, and to identify any ‘food deserts’
that may exist within Latrobe where there is limited access to fresh food and produce.
Using data obtained from both the Latrobe City Council’s Health Services and Economic Sustainability
teams, the Prime Safe online database and desktop research, a database of all the food outlets and food
access points within the Latrobe City was developed. Each food outlet was allocated to one of 15
categories, which can be seen in Appendix 2. Pubs, clubs, hotels and motels where meals may be served
were excluded from this analysis. This data was then uploaded to the Intramaps database. Data was then
analysed through the development of a series of GIS maps that could analyse the placement and
distribution of different food outlet categories throughout the entire Latrobe City municipality.
Food Access and Availability in Latrobe City 7Findings
Victorian Healthy Food Basket Survey
The following are the findings of the VHFB data analysis for Latrobe City. Note that all analyses are
based on the cost of a healthy food basket for a family of four (two adults and two children).
The cost of a healthy food basket for a family of four in Latrobe City ranged from $415.70 to $586.18
(see Appendix 3). This is a difference of $170.48 from the cheapest to the most expensive basket.
The average price of a healthy food basket for a family of four was $480.84 in Latrobe City. Based on
this price a healthy food basket would cost 35% of a family of four’s total fortnightly government
assistance from Centrelink (see Appendix 3).
The Victorian average price of a healthy food basket for a family of four is $447.40. Therefore the
healthy food basket is $33.44 more expensive in Latrobe City compared with the Victorian average.
The cheapest area to purchase food was within Morwell, with an average cost of $449.93 (see
Appendix 3).
The most expensive area to purchase foods was area 3, which contains the satellite towns of the
region, with an average cost in of $501.78. It should be noted that the cost in area code 3 ranged
from $458.79 to $586.18, a difference of $127.39 (see Appendix 3).
The average cost for major centres combined (area codes 1, 2 and 4) was $469.67 (see Appendix 3).
This was $32.09 less expensive than the cost in area code 3, the satellite towns of Latrobe City. The
cost of healthy food basket for major centres ranged from $415.70 to $532.23, a difference of
$116.53 (see appendix 3). Additionally, the difference in the range between satellite towns and major
centres can be seen in Appendix 4, a box plot analysis of the cost of a healthy food basket of major
centres versus satellite towns, which differences in the range between these two groups. The
statistical significance of the cost difference between major centres and satellite towns was tested
with a Mann-Whitney U-test with this test indicating that these results were not statistically significant
(p=0.93). However, the results can be classed as clinically significant since $32.09 is still a
substantial amount of money for a low-income family.
When comparing the cost of fruits and vegetables in greengrocers versus supermarkets it was found
that the average cost of fruit and vegetables was $127.67 at supermarket retailers and $92.45 at
greengrocer retailers (see Appendix 5). This shows that on average it is $35.22 cheaper to purchase
8 Food Access and Availability in Latrobe Citythe fruit and vegetable component of healthy food basket for a family of four from a greengrocer than
from a supermarket in Latrobe City. See Appendix 6 for a box plot analysis of the cost of fruit and
vegetables in supermarkets versus greengrocers that shows a clear difference in the range of costs
between these two categories. For the supermarket and greengrocer fruit and vegetable cost
comparison a Mann-Whitney U-test indicated that these results were statistically significant
(p=0.002).
Availability of fruit and vegetables
When analysing the availability of fruit and vegetables within the satellite towns of Latrobe City (area 3), it
was found that out of 18 items of fresh, tinned and frozen fruits and vegetables, some towns had up to 16
missing items. Therefore residents in these towns only had access to two fruit and/or vegetable items if
they were unable to travel to another location where there was greater access. Additionally, it was
reported by retailers in satellite towns that stocking fresh produce such as fruits and vegetables was often
inconsistent and sporadic, which has further implications for the level of access that residents have to
fresh produce in these areas.
Food outlet database
The food outlet database developed for the purpose of providing data for GIS mapping assisted in
discovering the following findings:
As of October 2014, there were 89 takeaway food outlets, 82 cafés and restaurants, 20 supermarkets
and 4 greengrocers in Latrobe City (see Appendix 2).
The takeaway outlets represent 32% percent of the total number of food outlets in Latrobe City, whilst
supermarkets represented 7%, greengrocers 1%, and fresh retailers such as butchers, and bakery
combined represented 14%, see figure 2 below.
There is a disproportionate number of fresh food outlets compared with outlets which provide
discretionary choices. For every one fresh food outlet in Latrobe (supermarket or greengrocer) there
are 3.7 takeaway or fast food outlets.
Food Access and Availability in Latrobe City 9Figure 2: Composition of food outlets by type in Latrobe City (%)
Composition of food outlets by type in Latrobe City (%)
Supermarket
1%
8% 7%
Greengrocer
14% Fresh (Bakery, Butcher, Fishmonger,
Delicatessen)
29% 1% Cultural Supermarket
9% Mixed Business & Petrol Station
Takeaway food outlet
Café & Restaurant
32%
Other (Aged Care, Hospitals, Community
Gardens)
Mapping of the Latrobe City food system
By utilising the GIS Mapping program Intramaps, a number of maps were developed to show a visual
representation of the Latrobe City food system. The most telling data has been included in this report with
Figures 3 to 19 spatially mapping the subsets of the food system across Latrobe City. A 500 metre radius
has been applied to each food outlet type which is deemed as a reasonable walking distance for
20 20
accessing food. Above 500 metres and the area may be considered a ‘food desert’.
Figures 3 and 4 focus on Morwell. Access to fresh fruit and vegetables (supermarkets and
greengrocers) is compared with access to takeaway food outlets, mixed businesses and petrol
stations, all of which typically sell discretionary food items. These maps show that there is a major
difference between access to supermarkets and greengrocers compared to the access to food
businesses that typically sell unhealthy items.
Figures 5 and 6 show this data again overlaid with the SEIFA index for each area within Morwell. This
indicates that there are significant gaps in access to supermarkets and greengrocers in Morwell
where there are higher levels of disadvantage according to the SEIFA index. In comparison there are
many takeaway food outlets, mixed businesses and petrol stations that surround these areas of
higher disadvantage in Morwell.
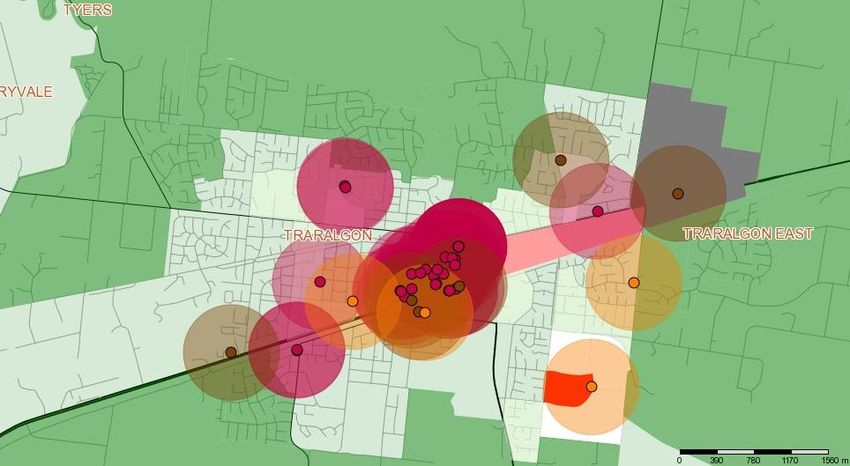
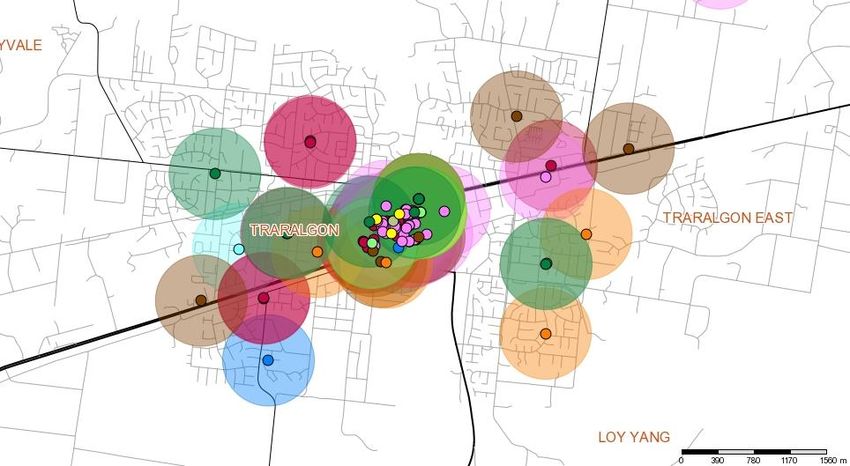
Figures 7 and 8 show that Traralgon has better retail access to fresh fruit and vegetables and lower
levels of disadvantage as depicted by the SEIFA ranking overlaid on these maps compared to
10 Food Access and Availability in Latrobe CityMorwell. However, there are still many areas where there is no access to fruit and vegetables, or any
food outlets of any category particularly around the outskirts of Traralgon as seen in Figure 9.
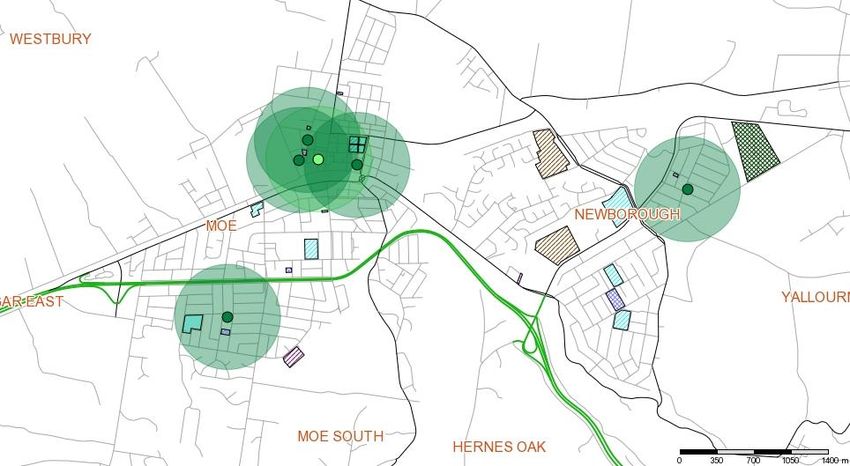
Figures 10 and 11 show that the proximity of supermarkets and greengrocers to education centres in
Moe and Newborough compared to takeaway outlets, mixed businesses and petrol stations which
typically sell discretionary food items. These figures indicate that there is a considerable amount of
takeaway food outlets, mixed businesses and petrol stations in close proximity to education centres in
the Moe and Newborough area.
Figures 12 to 19 show the level of access and types of food outlets accessible in the satellite towns of
Latrobe City. All food outlets and access points have been included in these maps to give a greater
understanding of the types of businesses that residents have access to. As can be seen by the maps,
access is often lacking, with just the presence of one “mixed business” such as a petrol station,
general store or milk bar in some towns. As stated previously, many of these stock few lines of fruit
and vegetables.
Food Access and Availability in Latrobe City 11Figure 3: Supermarket and greengrocer access in Morwell
Figure 4: Takeaway food outlet, mixed business and petrol station access in Morwell
Note
The information shown on this map is derived from a variety of sources including, but not
limited to, Vicmap Data, other State and Local Government Agencies data and Latrobe City 11/19/2014
Data.
Disclaimer:
The State of Victoria does not warrant the accuracy or completeness of information in this
publication and any person using or relying upon such information does so on the basis that Morwell supermarkets
and greengrocers
the state of Victoria shall bear no responsibility or liability whatsoever for any errors, faults,
defects or omissions in the information.
Latrobe City does not guarantee the accuracy or the currency of the information presented on
this map and therefore Latrobe City will not be held liable for any loss or damage arising as a Scale 1:29400
result of using this information.
The location of features shown on this map is indicative only. The underground infrastructure
location shown is not to be used as a substitute for Dial Before You Dig .
The compilation of this map is subject to copyright laws and regulations, no part of this map
can be reproduced without prior written consent of Latrobe City Council.
Note
The information shown on this map is derived from a variety of sources including, but not
limited to, Vicmap Data, other State and Local Government Agencies data and Latrobe City 11/19/2014
Data.
Disclaimer:
The State of Victoria does not warrant the accuracy or completeness of information in this Morwell takeaway, mixed
publication and any person using or relying upon such information does so on the basis that
12 the state of Victoria shall bear no responsibility or liability whatsoever for any errors, faults, business and
Food petrol
Access and Availability in Latrobe City
defects or omissions in the information.
Latrobe City does not guarantee the accuracy or the currency of the information presented on
station
this map and therefore Latrobe City will not be held liable for any loss or damage arising as a Scale 1:29400
result of using this information.Figure 5: Supermarket and greengrocer access in Morwell with SEIFA ranking for areas
Note
The information shown on this map is derived from a variety of sources including, but not
limited to, Vicmap Data, other State and Local Government Agencies data and Latrobe City 11/19/2014
Data.
Disclaimer:
The State of Victoria does not warrant the accuracy or completeness of information in this Morwell supermarkets
publication and any person using or relying upon such information does so on the basis that
the state of Victoria shall bear no responsibility or liability whatsoever for any errors, faults, and greengrocers and
defects or omissions in the information.
Latrobe City does not guarantee the accuracy or the currency of the information presented on
SEIFA
this map and therefore Latrobe City will not be held liable for any loss or damage arising as a Scale 1:29400
result of using this information.
The location of features shown on this map is indicative only. The underground infrastructure
location shown is not to be used as a substitute for Dial Before You Dig .
The compilation of this map is subject to copyright laws and regulations, no part of this map
can be reproduced without prior written consent of Latrobe City Council.
Figure 6: Takeaway food outlets, mixed business and petrol station access in Morwell with SEIFA
ranking for areas
Food Access and Availability Note
in Latrobe City 13
The information shown on this map is derived from a variety of sources including, but not
limited to, Vicmap Data, other State and Local Government Agencies data and Latrobe City 11/19/2014
Data.
Disclaimer:
The State of Victoria does not warrant the accuracy or completeness of information in this Morwell takeaway, mixedFigure 7: Supermarket and greengrocer access in Traralgon with SEIFA ranking for areas
Note
The information shown on this map is derived from a variety of sources including, but not
limited to, Vicmap Data, other State and Local Government Agencies data and Latrobe City 11/19/2014
Data.
Disclaimer:
The State of Victoria does not warrant the accuracy or completeness of information in this Traralgon supermarkets
publication and any person using or relying upon such information does so on the basis that
the state of Victoria shall bear no responsibility or liability whatsoever for any errors, faults, and greengrocers and
defects or omissions in the information.
Latrobe City does not guarantee the accuracy or the currency of the information presented on
SEIFA
this map and therefore Latrobe City will not be held liable for any loss or damage arising as a Scale 1:34755
result of using this information.
The location of features shown on this map is indicative only. The underground infrastructure
location shown is not to be used as a substitute for Dial Before You Dig .
The compilation of this map is subject to copyright laws and regulations, no part of this map
can be reproduced without prior written consent of Latrobe City Council.
Figure 8: Takeaway food outlet, mixed business and petrol station access in Traralgon with SEIFA
ranking for areas
Note
The information shown on this map is derived from a variety of sources including, but not
limited to, Vicmap Data, other State and Local Government Agencies data and Latrobe City 11/19/2014
Data.
Disclaimer:
The State of Victoria does not warrant the accuracy or completeness of information in this Traralgon takeaway,
publication and any person using or relying upon such information does so on the basis that
the state of Victoria shall bear no responsibility or liability whatsoever for any errors, faults, mixed business and
defects or omissions in the information.
Latrobe City does not guarantee the accuracy or the currency of the information presented on
petrol station with SEIFA
this map and therefore Latrobe City will not be held liable for any loss or damage arising as a Scale 1:34755
result of using this information.
The location of features shown on this map is indicative only. The underground infrastructure
location shown is not to be used as a substitute for Dial Before You Dig .
The compilation of this map is subject to copyright laws and regulations, no part of this map
can be reproduced without prior written consent of Latrobe City Council.
14 Food Access and Availability in Latrobe CityFigure 9: All food access points in Traralgon
Note
The information shown on this map is derived from a variety of sources including, but not
limited to, Vicmap Data, other State and Local Government Agencies data and Latrobe City 11/23/2014
Data.
Disclaimer:
The State of Victoria does not warrant the accuracy or completeness of information in this
publication and any person using or relying upon such information does so on the basis that
Traralgon all food outlets
the state of Victoria shall bear no responsibility or liability whatsoever for any errors, faults,
defects or omissions in the information.
Latrobe City does not guarantee the accuracy or the currency of the information presented on
this map and therefore Latrobe City will not be held liable for any loss or damage arising as a Scale 1:36351
result of using this information.
The location of features shown on this map is indicative only. The underground infrastructure
location shown is not to be used as a substitute for Dial Before You Dig .
The compilation of this map is subject to copyright laws and regulations, no part of this map
can be reproduced without prior written consent of Latrobe City Council.
Food Access and Availability in Latrobe City 15Figure 10: Supermarket and greengrocer access in relation to education centres in Moe and
Newborough
Note
The information shown on this map is derived from a variety of sources including, but not
limited to, Vicmap Data, other State and Local Government Agencies data and Latrobe City 11/19/2014
Education
Data.centres legend
Disclaimer:
The State of Victoria does not warrant the accuracy or completeness of information in this Moe supermarket and
publication and any person using or relying upon such information does so on the basis that
the state of Victoria shall bear no responsibility or liability whatsoever for any errors, faults, greengrocer and
defects or omissions in the information.
Latrobe City does not guarantee the accuracy or the currency of the information presented on
education centres
this map and therefore Latrobe City will not be held liable for any loss or damage arising as a Scale 1:31582
result of using this information.
The location of features shown on this map is indicative only. The underground infrastructure
location shown is not to be used as a substitute for Dial Before You Dig .
The compilation of this map is subject to copyright laws and regulations, no part of this map
can be reproduced without prior written consent of Latrobe City Council.
Figure 11: Takeaway outlets, mixed businesses and petrol station access in relation to education
centres in Moe and Newborough
Note
The information shown on this map is derived from a variety of sources including, but not
limited to, Vicmap Data, other State and Local Government Agencies data and Latrobe City 11/19/2014
Data.
Disclaimer:
The State of Victoria does not warrant the accuracy or completeness of information in this
publication and any person using or relying upon such information does so on the basis that Moe takeaway, mixed
business, petrol station
the state of Victoria shall bear no responsibility or liability whatsoever for any errors, faults,
16 defects or omissions in the information. Food Access and Availability in Latrobe City
Latrobe City does not guarantee the accuracy or the currency of the information presented on
this map and therefore Latrobe City will not be held liable for any loss or damage arising as a
and education centres Scale 1:31582
result of using this information.
The location of features shown on this map is indicative only. The underground infrastructure
location shown is not to be used as a substitute for Dial Before You Dig .
The compilation of this map is subject to copyright laws and regulations, no part of this mapFood access in satellite towns
Figure 12: Food access points in Churchill
Note
The information shown on this map is derived from a variety of sources including, but not
limited to, Vicmap Data, other State and Local Government Agencies data and Latrobe City 11/23/2014
Data.
Disclaimer:
The State of Victoria does not warrant the accuracy or completeness of information in this
publication and any person using or relying upon such information does so on the basis that
Churchill all food outlets
the state of Victoria shall bear no responsibility or liability whatsoever for any errors, faults,
defects or omissions in the information.
Latrobe City does not guarantee the accuracy or the currency of the information presented on
this map and therefore Latrobe City will not be held liable for any loss or damage arising as a Scale 1:34617
result of using this information.
The location of features shown on this map is indicative only. The underground infrastructure
location shown is not to be used as a substitute for Dial Before You Dig .
The compilation of this map is subject to copyright laws and regulations, no part of this map
can be reproduced without prior written consent of Latrobe City Council.
Food Access and Availability in Latrobe City 17Figure 13: Food access points in Glengarry
Note
The information shown on this map is derived from a variety of sources including, but not
limited to, Vicmap Data, other State and Local Government Agencies data and Latrobe City 11/19/2014
Data.
Disclaimer:
The State of Victoria does not warrant the accuracy or completeness of information in this
publication and any person using or relying upon such information does so on the basis that Glengarry food access
points
the state of Victoria shall bear no responsibility or liability whatsoever for any errors, faults,
Figure 14: Food access
defects or omissions points in Toongabbie
in the information.
Latrobe City does not guarantee the accuracy or the currency of the information presented on
this map and therefore Latrobe City will not be held liable for any loss or damage arising as a Scale 1:24051
result of using this information.
The location of features shown on this map is indicative only. The underground infrastructure
location shown is not to be used as a substitute for Dial Before You Dig .
The compilation of this map is subject to copyright laws and regulations, no part of this map
can be reproduced without prior written consent of Latrobe City Council.
Note
The information shown on this map is derived from a variety of sources including, but not
limited to, Vicmap Data, other State and Local Government Agencies data and Latrobe City 11/19/2014
Data.
Disclaimer:
The State of Victoria does not warrant the accuracy or completeness of information in this
publication and any person using or relying upon such information does so on the basis that Toongabbie food access
points
the state of Victoria shall bear no responsibility or liability whatsoever for any errors, faults,
defects or omissions in the information.
Latrobe City does not guarantee the accuracy or the currency of the information presented on
this map and therefore Latrobe City will not be held liable for any loss or damage arising as a Scale 1:17130
result of using this information.
The location of features shown on this map is indicative only. The underground infrastructure
location shown is not to be used as a substitute for Dial Before You Dig .
The compilation of this map is subject to copyright laws and regulations, no part of this map
can be reproduced without prior written consent of Latrobe City Council.
18 Food Access and Availability in Latrobe CityFigure 15: Food access points in Tyers
Note
The information shown on this map is derived from a variety of sources including, but not
limited to, Vicmap Data, other State and Local Government Agencies data and Latrobe City 11/19/2014
Data.
Disclaimer:
Figure 16: Food
The State of Victoriaaccess points
does not warrant the in Yinnar
accuracy or completeness of information in this
publication and any person using or relying upon such information does so on the basis that
the state of Victoria shall bear no responsibility or liability whatsoever for any errors, faults, Tyers food access points
defects or omissions in the information.
Latrobe City does not guarantee the accuracy or the currency of the information presented on
this map and therefore Latrobe City will not be held liable for any loss or damage arising as a Scale 1:25651
result of using this information.
The location of features shown on this map is indicative only. The underground infrastructure
location shown is not to be used as a substitute for Dial Before You Dig .
The compilation of this map is subject to copyright laws and regulations, no part of this map
can be reproduced without prior written consent of Latrobe City Council.
Note
The information shown on this map is derived from a variety of sources including, but not
limited to, Vicmap Data, other State and Local Government Agencies data and Latrobe City 11/22/2014
Data.
Disclaimer:
The State of Victoria does not warrant the accuracy or completeness of information in this
publication and any person using or relying upon such information does so on the basis that
the state of Victoria shall bear no responsibility or liability whatsoever for any errors, faults, Food access points in
defects or omissions in the information.
Latrobe City does not guarantee the accuracy or the currency of the information presented on
Yinnar second version
this map and therefore Latrobe City will not be held liable for any loss or damage arising as a Scale 1:44018
result of using this information.
The location of features shown on this map is indicative only. The underground infrastructure
location shown is not to be used as a substitute for Dial Before You Dig .
The compilation of this map is subject to copyright laws and regulations, no part of this map
can be reproduced without prior written consent of Latrobe City Council.
Food Access and Availability in Latrobe City 19Figure 17: Food access points in Traralgon South
Note
The information shown on this map is derived from a variety of sources including, but not
limited to, Vicmap Data, other State and Local Government Agencies data and Latrobe City 11/22/2014
Data.
Disclaimer:
The State of Victoria does not warrant the accuracy or completeness of information in this
publication and any person using or relying upon such information does so on the basis that
the state of Victoria shall bear no responsibility or liability whatsoever for any errors, faults, Food access points in
defects or omissions in the information.
Latrobe City does not guarantee the accuracy or the currency of the information presented on
Traralgon South
Figure 18: Food access points in Yallourn North
this map and therefore Latrobe City will not be held liable for any loss or damage arising as a Scale 1:36299
result of using this information.
The location of features shown on this map is indicative only. The underground infrastructure
location shown is not to be used as a substitute for Dial Before You Dig .
The compilation of this map is subject to copyright laws and regulations, no part of this map
can be reproduced without prior written consent of Latrobe City Council.
Note
The information shown on this map is derived from a variety of sources including, but not
limited to, Vicmap Data, other State and Local Government Agencies data and Latrobe City 11/22/2014
Data.
Disclaimer:
The State of Victoria does not warrant the accuracy or completeness of information in this
publication and any person using or relying upon such information does so on the basis that
the state of Victoria shall bear no responsibility or liability whatsoever for any errors, faults, Food access points in
defects or omissions in the information.
Latrobe City does not guarantee the accuracy or the currency of the information presented on
Yallourn North
this map and therefore Latrobe City will not be held liable for any loss or damage arising as a Scale 1:34915
result of using this information.
The location of features shown on this map is indicative only. The underground infrastructure
location shown is not to be used as a substitute for Dial Before You Dig .
20 The compilation of this map is subject to copyright laws and regulations, no part of this map Food Access and Availability in Latrobe City
can be reproduced without prior written consent of Latrobe City Council.Figure 17: Food access points in Boolarra
Note
The information shown on this map is derived from a variety of sources including, but not
limited to, Vicmap Data, other State and Local Government Agencies data and Latrobe City 11/19/2014
Data.
Disclaimer:
The State of Victoria does not warrant the accuracy or completeness of information in this
publication and any person using or relying upon such information does so on the basis that Boolarra food access
Publicthe transport and
state of Victoria shall bear no food
responsibility
defects or omissions in the information.
access
or liability whatsoever for any errors, faults,
points
Latrobe City does not guarantee the accuracy or the currency of the information presented on
this map and therefore Latrobe City will not be held liable for any loss or damage arising as a Scale 1:16730
As seen
resultin Figures
of using this information.12 to 19, residents in the satellite towns of Latrobe tend to have access to retailers
The location of features shown on this map is indicative only. The underground infrastructure
location shown is not to be used as a substitute for Dial Before You Dig .
that do not stock the range of food items that are required for a healthy diet. Due to this limited access,
The compilation of this map is subject to copyright laws and regulations, no part of this map
can be reproduced without prior written consent of Latrobe City Council.
these residents would have to travel to Latrobe’s larger centres to access a wider variety of fresh
produce. Using the example of the town of Boolarra, which has only one mixed business (see Figure 19),
a resident from this town may choose to travel to Churchill to access a greater range of foods. If this
resident is reliant on public transport, a bus service to Churchill passes through Boolarra every two hours
21
and return services leave one hour after arrival in Churchill. Therefore, it may take three hours or more
to travel and shop for food. The reliance on public transport may influence food purchasing behaviours as
the resident would need to carry their purchases, influencing how much and what sort of foods they would
purchase. Also the length of this trip may mean that they shop infrequently therefore may be more likely
to purchase non-perishable and packaged foods rather than fresh produce.
Discussion
As stated earlier in this report Latrobe City has significantly higher rates of overweight and obesity than
the Victorian average, 60.6% and 49.8% respectively. Additionally, only 7% of adults consume the
recommended daily servings of fruits and vegetables each day. We also know that access, availability
Food Access and Availability in Latrobe City 21and cost are significant predictors of food purchasing behaviours and will influence an individual’s eating
habits and their consumption of a healthy diet more so than education. Therefore, in order to improve
healthy eating habits we must ensure that individuals have easy access to affordable and nutritious foods.
The research conducted in this study has identified that the Latrobe City food environment provides
inequitable access to affordable, nutritious foods, particularly fruits and vegetables. There are quite
significant gaps and disparities in the level of access to, and the cost of fresh produce throughout the
entire region.
Overview of key findings
• The cost of a healthy food basket can vary significantly by up to $170 across the region.
• The satellite towns of Latrobe City are the most expensive area to purchase a healthy food
basket for a family of four in Latrobe ($501.78).
• The major centre of Morwell is the cheapest area to purchase a healthy food basket for a family
of four ($449.93).
• The cost of a healthy food basket in Latrobe is $33.44 more expensive compared with the
Victorian average.
• It is $35.22 cheaper to purchase the fruit and vegetable component of a healthy food basket for a
family of four from greengrocers compared to supermarket retailers.
• Takeaway food outlets account for 32% of the total food outlets in Latrobe City. This is a
significant share of the total number of food outlets when compared to retailers that sell fresh
produce such as supermarkets (7%), greengrocers (1%), and bakery, butcher, fishmonger and
poultry retailers combined (14%).
• For every one fresh food outlet in Latrobe (supermarket or greengrocer) there are 3.7 takeaway
or fast food outlets.
• Out of the 18 fruit and vegetable items surveyed, some satellite towns were missing up to 16
items, indicating significant gaps in access to fruits and vegetables in these towns.
• There are also gaps in access to supermarket and greengrocer retailers in the major centres of
Latrobe City.
• There are a significant number of food outlets selling unhealthy, discretionary food items in close
proximity to education centres in Latrobe City further increasing access to unhealthy food items
for young people.
• Additionally, many food outlets selling discretionary foods are in close proximity to some of the
most disadvantaged areas of Latrobe.
There is a clear need for strategies and initiatives that increase the supply of fresh produce in both major
centres and the smaller satellite towns in Latrobe City. The findings of this research should be used to
advocate for change to the local food system to key decision makers within and external to local
government. Additionally, this evidence can inform and assist greater collaboration with the food retail
sector in Latrobe City.
22 Food Access and Availability in Latrobe CityLimitations
A limitation of the Victorian Healthy Food Basket tool is that benchmark prices must be entered where
missing items occur. Therefore values may not fully reflect the true cost of food for residents within
Latrobe City. Additionally, although Churchill can be considered a major centre in itself, its healthy food
basket data was analysed as part of the satellite town area code. There were concerns that the
supermarket retailers would be identified in terms of price if Churchill was given its own area code. The
inclusion of Churchill as part of the satellite towns’ area code may have reduced the average cost of a
healthy food basket in this area code. Another limitation of this study was that different data was used to
create the food outlet database compared to the research conducted in previous years. It is likely that the
latest data is more accurate, given it was cross-checked across four databases, however both data sets
give a good indication of the current mix of food retailers in Latrobe.
Implications for wider research in Victoria
Monash University Department of Nutrition and Dietetics have committed to further exploring the cost of
fruit and vegetable items in greengrocers and supermarkets. Reflecting the results from this study,
22
greengrocers have also been found to be significantly less expensive in metropolitan Melbourne.
However, further evidence is needed to tell the story from a rural perspective and assess whether the
Latrobe results reflect trends across Victoria. Collecting cost data from greengrocers will be built into the
Summer 2014/2015 State-wide Victorian Healthy Food Basket data collection. This evidence may
facilitate mutually beneficial partnerships between local government/health agencies and greengrocers,
the Melbourne Market Authority and other relevant businesses that supply fruit and vegetables.
Recommendations for future action
Council
• Continue to emphasise the importance of considering the food system within council policies,
strategies, and legislation using this research as an evidence base.
• Disseminate these results to relevant stakeholders within Latrobe City Council:
• Councillors
• Senior Management and Executives
• Relevant Team Meetings
• Use the Latrobe Food System GIS mapping information to inform future town planning and
development to ensure that there are acceptable levels of access to fresh food outlets.
• Advocate for a review of planning permits issued to food outlets selling discretionary food items in
close proximity to education centres and areas of high disadvantage.
Latrobe food system
• Continue to conduct VHFB surveying in Latrobe City to monitor the price of food over time.
Food Access and Availability in Latrobe City 23• Set protocols to ensure that additions and deletions of food outlets are updated in the GIS
Mapping software on a regular basis.
• Investigate the logistics of increasing the supply of fresh produce to satellite towns, ‘food deserts’
and disadvantaged areas in major centres/Encourage local greengrocers and supermarket
retailers to improve delivery to these areas.
• Encourage and support takeaway food and dining outlets to offer healthier menu options that
include fruits and vegetables.
• Encourage the development of more community gardens and local food hubs, particularly in
smaller towns of Latrobe.
• Support mixed businesses eg: petrol stations, milk bars and convenience stores to increase their
supply of fresh produce.
Future research in Latrobe
• Investigate public transport connectivity and timetabling throughout Latrobe City.
• Investigate the footpath connectivity to fresh food access points in Latrobe, particularly in satellite
towns of the region.
• Investigate the level of access to alcohol in both major centres and satellite towns as this was
observed to be higher than access to fruits and vegetables.
• Continue to map all petrol stations, sporting kiosks and school canteens in Intramaps to tell a
more comprehensive story of food access and availability in Latrobe City.
24 Food Access and Availability in Latrobe CityReferences
1. Department of Health. Victorian Population Health Survey 2011-12: Selected Preliminary Results
- Gippsland Melbourne: Department of Health2013 Oct. 6p. Available from:
http://docs.health.vic.gov.au/docs/doc/Victorian-Population-Health-Survey-2011-12:-Selected-
Preliminary-Results--Gippsland
2. Kettings C, Sinclair AJ, Voevodin M. A healthy diet consistent with Australian health
recommendations is too expensive for welfare‐ dependent families. Australian and New Zealand
journal of public health. 2009;33(6):566-72.
3. World Health Organization. Promoting fruit and vegetable consumption around the world 2014
[cited 2014 Nov 10]. Available from: http://www.who.int/dietphysicalactivity/fruit/en/index2.html
4. Palermo C. The cost of nutritious food: a determinant of health. Nutrition & Dietetics.
2011;68(4):246-7.
5. Wilkinson RG, Marmot MG. Social determinants of health: the solid facts: World Health
Organization; 2003.
6. Lee A, Mhurchu CN, Sacks G, Swinburn B, Snowdon W, Vandevijvere S, et al. Monitoring the
price and affordability of foods and diets globally. Obesity Reviews. 2013;14(S1):82-95.
7. World Health Organization. The determinants of health: Food and agriculture [Internet]. 2014
[cited 2014 Nov 18]. Available from: http://www.who.int/hia/evidence/doh/en/index3.html
8. Larson NI, Story MT, Nelson MC. Neighborhood environments: disparities in access to healthy
foods in the US. American journal of preventive medicine. 2009;36(1):74-81. e10.
9. Turrell G, Hewitt B, Patterson C, Oldenburg B, Gould T. Socioeconomic differences in food
purchasing behaviour and suggested implications for diet‐ related health promotion. Journal of
Human Nutrition and Dietetics. 2002;15(5):355-64.
Food Access and Availability in Latrobe City 2510. Australian Bureau of Statistics. 2011 Census of Population and Housing Basic Community Profile
[Internet]. 2013 [cited 2014 Nov 21]. ABS cat. no. 2001.0 [Available from:
http://www.abs.gov.au/websitedbs/censushome.nsf/home/communityprofiles
11. Department of Health. Healthy Food Connect: A support resource [Internet]. 2014 [updated 28
April 2014; cited 2014 Dec 15]. Available from: http://docs.health.vic.gov.au/docs/doc/Healthy-
Food-Connect:-A-support-resource
12. Healthy Together Latrobe. Directions For Connections. Morwell: Healthy Together Latrobe: 2013
October 42p.
13. Department of Health. Healthy Together Victoria [Internet]. 2014 [cited 2014 Nov 21]. Available
from: http://www.health.vic.gov.au/prevention/healthytogether
14. Latrobe City Council. Snapshot of Our Region Morwell, Victoria 2012 [cited 2014 13 Oct].
Available from: http://www.latrobe.vic.gov.au/Our_Community/Who_Lives_in_Latrobe/Snapshot
15. Department of Health. Projected Estimated Resident Population: Latrobe 2011-2021 2014 Sep.
Available from:
http://docs.health.vic.gov.au/docs/doc/0AC6C64B9FCDF25DCA25787700825E11/$FILE/DPP10
4.pdf
16. REMPLAN. SEIFA Index of Disadvantage (2011) n.d. Available from:
http://www.remplanlogin.com.au/Community/
17. McRae L. Most disadvantaged. Latrobe Valley Express [Internet] 2013, Apr 13 [cited 2014 Nov
18]. Available from: http://www.latrobevalleyexpress.com.au/story/1422985/most-disadvantaged/
18. Palermo C, Wilson A. Development of a healthy food basket for Victoria. Australian and New
Zealand journal of public health. 2007;31(4):360-3.
19. Graham SR, Carlton C, Gaede D, Jamison B. The benefits of using geographic information
systems as a community assessment tool. Public Health Reports. 2011;126(2):298.
26 Food Access and Availability in Latrobe CityYou can also read