Assessing compliance with deposit protection requirements - Briefing paper
←
→
Page content transcription
If your browser does not render page correctly, please read the page content below

Assessing compliance
with deposit protection
requirements
Briefing paper
Dr Jennifer Harris (University of Bristol) and
Prof Scott Orford (Cardiff University)

3 September 2020

                                                 housingevidence.ac.uk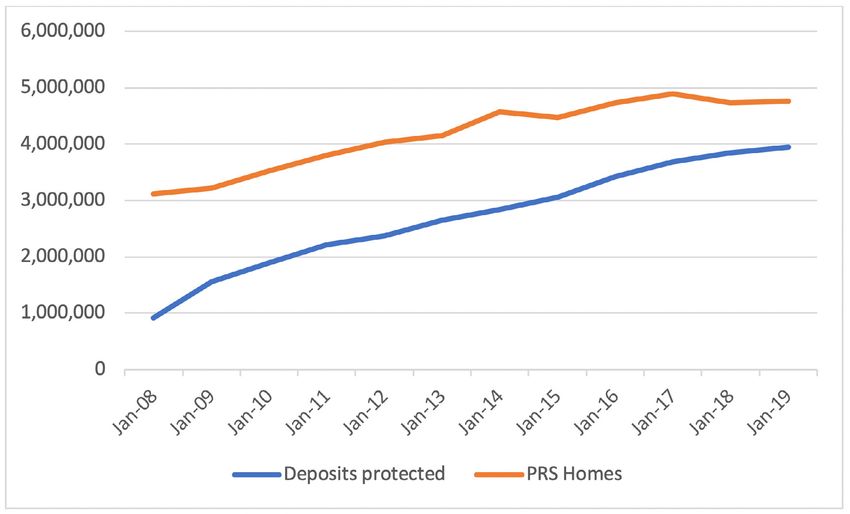
About the authors
Dr Jennifer Harris is a Senior Research Associate for the UK Collaborative Centre for Housing Evidence (CaCHE), and is
based in the School for Policy Studies, University of Bristol.
Professor Scott Orford is the Data Director for the UK Collaborative Centre for Housing Evidence (CaCHE). He is a
Professor in Geographic Information Science and Spatial Analysis at Cardiff University and is the Research Data
Manager and Data Integration Co-ordinator of the Wales Institute of Social and Economic Research, Data and Methods
(WISERD).

Acknowledgements
This is part of the third project carried out by the collaboration between CaCHE, the TDS Charitable Foundation and
the SafeDeposits Scotland Charitable Trust. Through this collaboration we are undertaking a diverse programme of
research on issues relating to developments in, and operation of, the UK private rented sector. The broad objective of
the programme is to contribute to raising standards in the UK private rented sector.

2
housingevidence.ac.uk

Contents
Background............................................................................................................................................................................................................................................. 4

Deposit protection in the UK ...................................................................................................................................................................................................... 4

            England and Wales................................................................................................................................................................................................................ 4

           Scotland.........................................................................................................................................................................................................................................5

            Northern Ireland..................................................................................................................................................................................................................... 6

Size of the UK PRS................................................................................................................................................................................................................................ 6

          England and Wales.................................................................................................................................................................................................................. 6

          Scotland......................................................................................................................................................................................................................................... 8

          Northern Ireland....................................................................................................................................................................................................................... 9

Alternative sources of data............................................................................................................................................................................................................11

           Court and tribunal statistics............................................................................................................................................................................................11

            National Landlord Registration Schemes.............................................................................................................................................................. 12

            HMRC data................................................................................................................................................................................................................................13

            Understanding landlord behaviour..........................................................................................................................................................................13

Proposals for change.......................................................................................................................................................................................................................14

                                                                                                                                                                                                                                                           3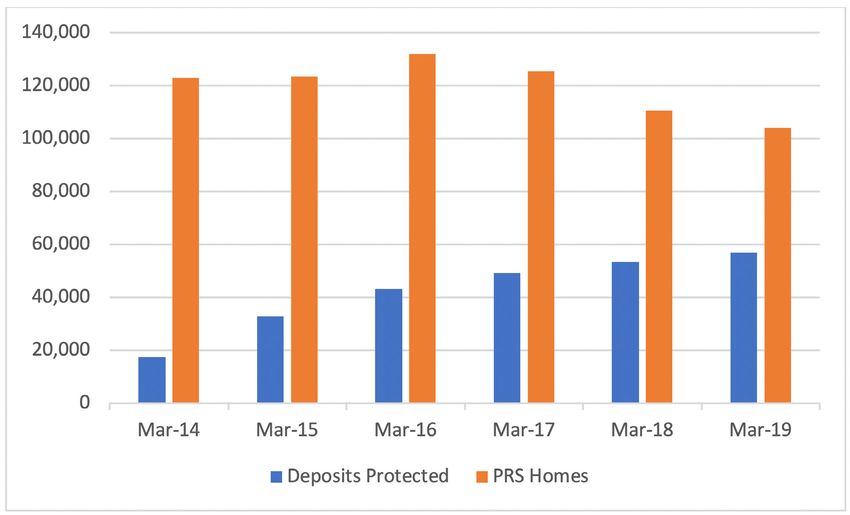
Background
In each nation of the UK, legislation requires landlords to protect tenant deposits in third party schemes. This
requirement has been in place for some considerable time. In addition, from 1st June 2019 landlords in England can
only charge 5 weeks’ deposit for new and renewed tenancies.1 In Scotland the deposit cannot exceed two months’
rent payable. There are currently very few datasets or estimates of compliance with the requirement to protect
deposits. Although there are anecdotal reports of non-compliance,2 how many landlords are taking deposits but not
lodging them with one of the approved schemes is currently unknown.
This briefing paper provides details of the data which is available on deposits and identifies what information is
currently available that could be used to assess compliance with deposit protection requirements. It identifies key
limitations or gaps associated with these statistics and considers what changes are needed in order to have the data
necessary to determine whether there is a gap between PRS tenancies and deposits protected, and therefore a
compliance problem.

Deposit protection in the UK
Protecting tenant deposits in a government-backed tenancy deposit scheme is mandatory across the UK. Failure to
do so can result in financial penalties. Each deposit protection scheme also operates a free and independent dispute
resolution service that can be accessed for disputes over the return of deposits.

England and Wales
Since 6 April 2007, deposits for assured shorthold tenancies3 in England and Wales4 have to be protected by one of the
three government-approved schemes: mydeposits, the Tenancy Deposit Scheme and the Deposit Protection Service.
Historically, landlord handling of deposits has been a contentious issue and the legislation followed reports from
Citizens Advice that landlords were unfairly withholding tenant deposits.5 Tenants faced numerous barriers to taking
legal action and reimbursement through the courts rarely occurred.6
Landlords can choose between two types of scheme:
l      Custodial: where the deposit is held by the scheme (this is free to join and is funded by the interest generated by
       the deposits).
l      Insurance: landlord keeps the deposit and pays a fee to the scheme. A significantly higher number of deposits are
       protected through the insurance scheme.
The tenancy deposit schemes are not responsible for enforcing the legislation. If a tenant believes their landlord or
agent has not been compliant, they can approach the local county courts or the First Tier Tribunal.7 This can result in a
penalty of up to three times the value of the deposit, payable to the tenant. The landlord can also lose certain rights,
including the right to serve a Section 21 Notice of Possession.

1
  Or 6 weeks if the annual rent is £50,000 or more. In Wales and Northern Ireland there is currently no limit on the amount of deposit a landlord or letting agency can
charge.
2
    Wilson and Barton, C. (2019) Tenancy deposit schemes. Briefing paper (Accessed: 29/4/20)
3
    This is the most common type of tenancy if renting from a private landlord or letting agent. Such tenancies can be fixed term or periodic.
4
  Existing deposit protection requirements in Wales will be replaced by the Renting Homes (Wales) Act 2016 once it is implemented. This will largely replicate existing
provisions and extend the requirements to all occupation contracts.
5
    National Association of Citizens Advice Bureaux (1998) Unsafe deposit: CAB clients’ experience of rental deposits
6
    Harris, J. (2020) Alternative approaches to resolving housing disputes (Accessed: 30/4/20).
7
    For an overview of dispute resolution in the UK PRS see Harris, J. (2020) Alternative approaches to resolving housing disputes (Accessed: 30/4/20).

4
housingevidence.ac.uk
Table 1: Total number and total value of tenancy deposits protected in England and Wales
(March 2008 – March 2020).
Total Deposits Protected Value of Deposits
Mar-08 924,181 £885,098,501
Mar-09 1,553,130 £1,406,482,263
Mar-10 1,888,532 £1,661,896,693
Mar-11 2,220,543 £2,104,219,832
Mar-12 2,374,385 £2,325,317,355
Mar-13 2,659,301 £2,637,843,361
Mar-14 2,848,110 £2,865,824,221
Mar-15 3,066,130 £3,187,501,867
Mar-16 3,425,718 £3,566,784,769
Mar-17 3,691,242 £4,017,045,899
Mar-18 3,840,216 £4,159,663,783
Mar-19 3,949,202 £4,408,543,068
Mar-20 4,141,467 £4,307,902,071
Scotland
In Scotland, tenancy deposit protection is similar to the model adopted in England and Wales but only custodial
schemes are available. Three schemes are in operation: Letting Protection Service Scotland; SafeDeposits Scotland;
and mydeposits Scotland.
If the tenant believes their landlord has not been compliant with the legislation, they can approach the First Tier
Tribunal for Scotland (Housing and Property Chamber). The tribunal can order the landlord to pay up to three times
the amount of the deposit paid.
Table 2: Total number and total value of tenancy deposits protected in Scotland
(March 2013 – March 2020).
Total Deposits Protected Value of Deposits
Mar-13 116,839 £77,809,426
Mar-14 149,639 £100,213,926
Mar-15 171,466 £113,164,006
Mar-16 186,070 £124,603,219
Mar-17 202,514 £134,596,623
Mar-18 211,955 £134,596,623
Mar-19 219,629 £150,844,370
Mar-20 221,834 £159,873,688
5Northern Ireland
The three schemes which are currently operational in Northern Ireland include Tenancy Deposit Scheme Northern
Ireland (TDS), My Deposits Northern Ireland, and Letting Protection Service NI. The legislation allows for both
insurance and custodial schemes to be provided. In Northern Ireland, councils are responsible for enforcing
compliance with fixed penalties up to £5,000.
Table 3: total number and total value of tenancy deposits protected in Northern Ireland
(March 2014 – March 2020)
Total Deposits Protected Value of Deposits
Mar-14 17,544 £9,901,267
Mar-15 32,722 £18,757,501
Mar-16 43,211 £23,430,569
Mar-17 49,102 £28,405,824
Mar-18 53,510 £31,395,767
Mar-19 56,786 £34,064,162
Mar-20 60,613 £36,759,231
Size of the UK PRS
Comparing the number of properties with the number of deposits protected should, in principle, give an indication of
the scale of non-compliance in each country. The census, annual dwelling stock estimates and housing condition
surveys published for each country provide a broad overview of the size and changes in levels of the PRS. An overview
of the available data is explored in an accompaniment briefing paper.8
England and Wales
The English Household Survey 2018-19 provides an estimate of the size of the private rented sector in England.9
Table 4: Estimated size of PRS in England
Measure 2018-19
Total housing stock 23.5 million
Proportion of homes in the PRS 19%
Number of homes in the PRS 4.6 million
8
S.Orford and J. Harris (2020) UK Private Rented Sector Data: A briefing paper
9
MHCLG (2019) English Housing Survey. Headline Report, 2018-19 (Accessed: 28/8/20)
6housingevidence.ac.uk
The Welsh Government dwelling stock estimates are based on local authority returns, registered social landlord
returns and the annual population survey.
Table 5: Estimated size of PRS in Wales
Measure 2018-19
Total housing stock 1.43 million
Proportion of homes in the PRS 15%
Number of homes in the PRS 207,700
At first glance these figures indicate a significant gap between the number of deposits protected in England and
Wales 2019 (3.9 million) and the number of households in the private rented sector. However, the English Household
Survey does not disaggregate data into the different tenancies. In England and Wales the requirement to protect a
deposit only covers assured shorthold tenancies (ASTs). Other tenancies that are not as common as ASTs include:10
l Excluded tenancies or licenses: this includes where a lodger lives with the landlord and shares some of the rooms
such as a kitchen or a bathroom.
l Assured tenancies: tenancies starting between 15 January 1989 and 27 February 1997 may be assured.
l Regulated tenancies: this covers tenancies starting before 15 January 1989.
The English Household Survey data does not exclude tenancies that are exempt from the requirement to protect a
deposit, and those who may have decided not to charge a deposit. These figures therefore cannot be directly
compared with the deposit protection data to determine the scale of non-compliance. An estimate of the total
number of deposits that need protecting is currently lacking.
In Wales, private sector dwellings are calculated by subtracting the number of local authority dwellings and RSL
dwellings from the total number of dwellings in Wales. Whilst private sector stock covers both owner-occupied and
private rented dwellings, there is no direct measure of these tenures due to the difficulty of collecting information on
the private sector and the relatively fluid interchange between these two parts. Due to changes in the methodology
implemented from 2013 onwards, estimates of changes in the PRS must be treated with caution and provide broad
comparisons only.11 The proportion of privately rented dwellings in all of Wales and at an individual local authority
level is calculated using data from the Annual Populations Survey (APS) and the variability within a sample survey may
cause small fluctuations. As in England, those tenancies exempt from the requirement to protect the deposit are not
excluded from this data.
The English Household Survey includes questions on tenancy deposits. In 2018-19, about three quarters (77%) of all
renters paid a deposit when they moved into their current accommodation; about three quarters (76%) of deposits
were registered with a tenancy deposit scheme; 18% said that they did not know if their deposit was protected. The
estimated total proportion of PRS tenancies covered by a deposit protection scheme is reported to have increased
from between 45% and 66% in 2014-15 to between 59% and 72% in 2018-19.12 The coverage of tenancy deposit
protection schemes across the private rented sector was calculated out of the total number of private renters and
tenants with all types of tenancies, not just assured shorthold tenancies.
10
Tenancy agreements: a guide for landlords (England and Wales) (Accessed: 30/4/20)
11
Welsh Government (2019) Dwelling Stock Estimates for Wales, as of 31 March 2019 – Revised. Available at: https://gov.wales/sites/default/files/statistics-and-
research/2019-11/dwelling-stock-estimates-31-march-2019-281.pdf (Accessed: 2/8/20).
12
It is expressed as a range, with the lower bound being tenants who were certain their deposit was registered in a TDP scheme and the upper bound including
those who did not know.
7The follow graph shows that the number of tenancy deposits has increased alongside the growth of the private
rented sector in England and Wales.
Graph 1: Tenancy deposits protected and number of PRS homes in England and Wales
Scotland
In Scotland, the Scottish Household Survey and the Housing Statistics annual returns provides estimates of the size of
the PRS.13 The Scottish Household Survey provides a snapshot of the sector and does not provide a means of directly
measuring change in the sector over time.
Table 6: Estimated size of PRS in Scotland
Measure 2017-18
Total housing stock 2.6 million
Proportion of occupied homes in the PRS 14%
Number of homes in the PRS 371,00014
The Scottish Household Survey reports that almost eight in 10 paid a deposit when they started to rent their property
(78%), rising to almost nine in 10 (87 per cent) for households in which the respondent had been living at that address
for under a year. The survey however does not include information on whether the deposit has been protected. The
survey also does not differentiate those properties that would be exempt from the legislation. Several situations are
exempt from the requirement to use a tenancy deposit scheme including where:
l the landlord and tenant are family members.
l the landlord is also a resident in the property.
l the property is used by a religious organisation
As in England and Wales it is therefore difficult to estimate the extent of landlord compliance with deposit protection
requirements.
13
Scottish Government (2018) Housing Statistics: Stock by tenure (Accessed: 28/8/20)
14
This figure includes properties rented privately or with a job/business and households living rent-free.
8housingevidence.ac.uk
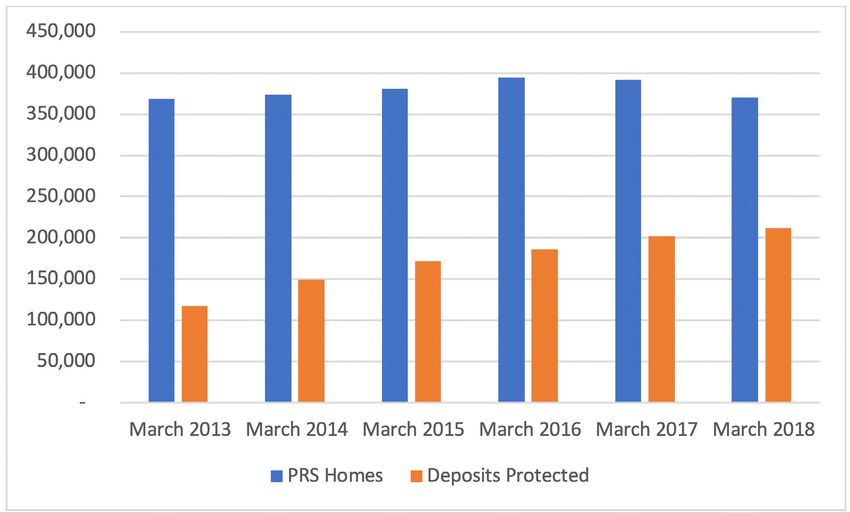
The follow graph shows that the number of tenancy deposits protected has increased in Scotland.
Graph 2: Tenancy deposits protected and number of PRS homes in Scotland
Northern Ireland
The most recent estimate of the private rented sector in Northern Ireland can be found in the Northern Ireland
Housing Statistics 2017-2018. This is a compilation of the latest statistics drawn from a range of sources including
household surveys and provides an indication of the size of the sector.
Table 7: Estimated size of PRS in Northern Ireland
Measure April 2019
Total housing stock 798,971
Proportion of homes in the PRS 13%
Number of homes in the PRS 104,000
9At first glance these figures may indicate that in 2019, 47,214 landlords were not compliant with the requirement to
protect a deposit. However, this figure should be treated with caution. Commentators have noted that the most
recent estimate of the PRS in Northern Ireland is likely to be an underestimate.15 The survey used to estimate the size
of the private rented sector received a response rate of 56% and is based on unweighted data.16 The problem with a
low response rate is that some respondents – in this case PRS properties – can be under-represented. It has therefore
been argued that it is wiser to continue to use the figure of 18% of all occupied homes as reported in the 2016 survey
as this has been adjusted to account for non-response rate.17 However, due to the relatively fluid nature of the sector
this figure is unlikely to accurately represent the current number of PRS homes. Whilst it may be possible to assume
that there is a gap between the number of homes in the private rented sector in Northern Ireland and the number of
deposits protected it is not possible to determine the full extent of non-compliance with the available data.
In Northern Ireland there are also some private tenancies which are not covered by the regulation including where:18
l The tenancy is for the purpose of occupying the house for a holiday.
l The property belongs to the Executive, the Crown, or a housing association.
l The tenancy is for a term exceeding 99 years.
These tenancies are not excluded from the statistics which are used to measure the PRS.
The following graph shows that the number of tenancy deposits protected has increased in Northern Ireland.
Graph 3: Tenancy deposits protected and number of PRS homes in Northern Ireland
15
Frey, J. (2018) Northern Ireland Housing Statistics 2017-18: Insights into the private rented sector (Accessed: 28/8/20)
16
Weighting adjustment is a commonly applied correction technique.
17
Frey, Northern Ireland Housing Statistics
18
For a full list of exemptions see https://www.tdsnorthernireland.com/landlords/the-legislation/ (Accessed: 30/4/20).
10housingevidence.ac.uk
Alternative sources of data
The previous section highlighted gaps in current statistics describing the stock of the private rented sector. As a result
there is no official estimate of the proportion of the PRS that is covered by the deposit protection schemes. This
section identifies alternative sources of data that could be used to assess compliance with the requirement to protect
a deposit.
Court and tribunal statistics
Administrative data from the First-tier Tribunal in Scotland provides new evidence of non-compliance. In 2018-2019,
the Chamber received 3781 applications across 10 jurisdictions and the vast majority (85%) fell within the new PRS
jurisdiction.19 The highest proportion of PRS applications received, totalling 353 or 11%, were applications for an order
for payment of a sanction where the landlord failed to comply with the duty to pay a tenancy deposit into an
approved scheme. This is the first year that data on the type of private rental disputes has been provided by the
Tribunal. Prior to the transfer of this jurisdiction to the Tribunal, there were few such reported cases in the Sheriff Court,
and it has been suggested that the Tribunal ‘has led to a dramatic increase in the number of deposit protection
cases’.20
These statistics provide valuable insight regarding the PRS and compliance with the legislation and could, in principle,
be compared with landlord registration data (see below). A key limiting factor however relates to tenants’ willingness
to approach courts and tribunal. Despite the prevalence of problems and disputes in the UK private rented sector, it is
generally recognised that tenants are highly unlikely to take legal action. Some of the barriers that tenants face
include: a lack of knowledge or understanding of rights and obligations; limited access to advice or assistance; fear of
attending court; cost barriers; or fear of a landlord’s possible negative response. Whilst the introduction of a fee-free
and specialist process in Scotland may have led to an increase in the number of deposit protection cases, there are
anecdotal reports that continuing complexity may be deterring a proportion of tenants from pursuing otherwise
legitimate claims.21 As a result, these data cannot be extrapolated to estimate the scale of non-compliance across the
UK. Tenants who have approached the Tribunal are unlikely to be representative of people living in the sector and it is
highly probable that a significant proportion of non-compliance will not be represented within statistics. Our ability to
generalise or predict the full scale of non-compliance from these data is limited and it may be necessary to consider
them alongside other sources of data (see below).
In England and Wales disputes regarding deposits will usually be heard in county courts. The Ministry of Justice
publishes quarterly national statistics on possession claims in the county courts by private landlords.22 Whilst these
statistics show that housing cases make up a large proportion of civil cases, they do not include other types of
housing claims such as claims regarding deposits. In Northern Ireland tenants can pursue disputes on deposits
through the small claims court. The number of applications made to the county courts and small claims court
regarding landlords’ failure to lodge a deposit could be made available at relatively low cost and would help increase
our understanding of non-compliance in this area.
19
Scottish Tribunals (2019) Scottish Tribunal Annual Report 2018-19 (Accessed: 28/8/20)
Property 118 (2008) ‘Will a wave of deposit protection cases hit a specialist court?’ https://www.property118.com/will-wave-deposit-protection-cases-hit-specialist-
20
housing-court/
21
Harris, Alternative Approaches to Resolving Housing Disputes.
22
Ministry of Justice (2019) Mortgage and landlord possession statistics: January to March 2019 (Accessed: 28/8/20).
11National Landlord Registration Schemes
Mandatory registration for all landlords operates in Scotland, Northern Ireland and Wales. In Wales, all landlords and
agents must also be licensed. National systems of registration and licensing should in principle increase the visibility of
the sector and provide more complete datasets, at least about the identity of landlords and properties. In these
jurisdictions it should be possible to compare the numbers of landlords lodging a deposit with the approved schemes
with the number of landlords on the private landlord register. However, aggregate data from the registration schemes
in Scotland and Northern Ireland is currently not available for research or statistical purposes on a national or regional
level. Whilst in Scotland, anonymised data from the register has been provided by a limited number of local
authorities for research purposes, to assess the full scale of non-compliance combined data would need to be
provided. Increasing the availability of this data for research purposes would help assess the extent of non-compliance
in this area.
Rent Smart Wales publishes monthly statistics of the number of landlords registered. However, due to limitations in
the measurement of private rented sector stock described above, these data cannot be easily compared.
Obtaining an accurate view of the size of the sector is only possible, if all eligible landlords register, and where
necessary, re-register. As explored in a recent study on local authority enforcement, there are currently key data gaps
with landlord registration, in part because of the challenges in building the database.23 Across the devolved
governments, an unknown number of landlords are currently operating outside of the schemes and local authorities
face significant difficulties in identifying and enforcing against those landlords. In addition, in Scotland landlords
register for 3 years and because the sector is relatively fluid there is a danger that they may leave the market in that
period.
Visibility of the sector remains a key issue and local authorities can usually only estimate the number of PRS properties
in their area. In Scotland, councils often rely on Census data in reaching this estimate. However, this data is only
collected every 10 years and is therefore generally out of date.
A lack of information about the PRS on a local authority level exists across the UK but is particularly noticeable in
England where national registration has not been introduced. A recent study on local authority enforcement practices
illustrates the various means employed by local authorities to attempt to improve knowledge of the PRS for the
purpose of developing their approach.24 This includes carrying out surveys of the sector in their area, or analysing
housing benefit and council tax data or HM Land Registry data. However, findings suggest that these data can be of
variable quality and housing benefit data is becoming increasingly difficult to obtain following migration to Universal
Credit.
Information from online advertising sites such as Zoopla has been identified as an additional means of gaining insight
into the sector, particularly when considered alongside landlord registration data.25 However, this may be of less use in
local housing markets, particularly in rural areas, where many properties are advertised by word of mouth.
23
Harris, J., Cowan, D. and Marsh, A. (2020) Improving Compliance with PRS Legislation
24
Harris, J., Cowan, D. and Marsh, A. (2020) Improving Compliance with PRS Legislation
25
Livingston, Berry, Gibb, and Bailey, Private Renting Reforms.
12housingevidence.ac.uk
HMRC data
Comparisons between HMRC numbers and estimates of the number of tenancies in the UK PRS may provide some
indication into the extent to which landlords are complying with tax laws. Landlords who seek to evade paying tax on
their rental income are also likely to be non-compliant with deposit protection requirements. The HMRC ‘Let Property
Campaign’ launched in 2013, estimated that between 2009 and 2010 up to 1.5 million had failed to pay tax. In 2019,
35,099 people have made voluntary disclosures to HMRC, just 2.3% of the individuals originally identified. Recent
updated analysis provided by TaxWatch estimates that the current tax gap resulting from residential landlords not
declaring their income is £1.73 billion a year.26
Connect allows the tax authority to cross-check activity across multiple information sources including property
disclosures on tax returns, estate agents’ client lists and Land Registry data, as well as social media profiles and
extraordinary spending patterns to identify instances of tax avoidance and evasion.27 However this activity only occurs
during investigations of individual landlords and may be doing little to tackle the full scale of non-compliance in the
private rented sector. Tax watch suggests that the following steps could be taken to tackle tax avoidance among
residential landlords:
l Introduction of a national registration scheme in England to support in the identification of residential landlords.
l A requirement on lenders to provide data to HMRC on who owns a buy-to-let mortgage.
l Create a central record of rental properties with each property given its own unique identification number.
Understanding landlord behaviour
The PRS is complex and comprises numerous submarkets operating within one local authority area. People’s
experiences of the private rented sector are affected by local markets and national data generally does not reflect the
behaviour of landlords or tenants.
Local authorities are responsible for developing strategies and interventions to improve their private rented sector.
Providing statistics at a level that allows for analysis of local housing markets is key to developing effective
interventions in the sector. This includes where non-compliance with the tenancy deposit regulations may be an issue.
Even if an accurate national estimate of the gap between tenancies and deposits protected could be achieved, this
may be of little use to local authorities aiming to improve landlord management practices in their local area. Other
research has highlighted a distinct lack of small area geographical data available to develop local housing strategies.28
In rural communities where properties are generally dispersed over a much larger area, gathering this information
poses further challenges.
Existing data tells us little about landlord behaviour or how this may have changed. It is possible that some landlords
may be charging a higher rent to avoid deposit protection requirements or simply be forgoing a deposit in order to
avoid the administrative requirements or financial outlay associated with managing any deposit holding. The lack of
data on landlord and agency behaviour can pose a problem for policy makers and local authorities seeking to
develop regulatory strategies that are responsive to behaviour, attitude and culture of those being regulated.
26
Tax Watch (2020) Rogue Landlords: Landlord tax evasion costing up to £1.7bn a year
27
Harris, Cowan, Marsh, Improving Compliance
28
Harris, Cowan, Marsh, Improving Compliance
13Information held by the tenancy deposit schemes can, in principle, be requested by local authorities to inform local
strategies towards the PRS and to target enforcement action. However, anecdotal evidence suggests significant
variation in the extent to which this data is drawn upon by local authorities. Identifying non-compliant landlords only
works if the data from all three schemes can be easily accessed. If all tenancy deposit schemes are willing to share
relevant data with local authorities, then the question arises regarding how the data can be brought together into
one database to make it useful for councils to interrogate. If this data were to be routinely used as a resource for local
authorities, a means of providing the data that is not hugely resource intensive for local authorities or the tenancy
deposit schemes would need to be developed.
Proposals for change
The top priority for change would be to include a question about the nature of tenancies in the national housing
surveys that would allow us to better identify those tenancies that are exempt from the requirement to protect
tenancy deposits. This would allow for a more precise estimate of those that should be covered by deposit. This could
then be set alongside data from the deposit holding bodies and HMRC data to get a better estimate of non-
compliance. The surveys which could be amended include (but are not limited to) the English Household Survey and
the Scottish Household Survey.
As highlighted elsewhere, data from registration schemes has significant potential in helping us to understand the
sector and how it is changing.29 UK and devolved governments should explore the possibility of making aggregate
data from the national registration schemes available for research and statistical purposes. The data would need to be
anonymised appropriately and be compliant with data protection laws. This could be achieved at relatively low costs
to governments. At the point of registration, landlords could be made aware that data will be used for these purposes.
In order to achieve their full potential, national schemes of registration or licensing require clear aims and purpose. As
we have argued elsewhere, in England, a national registration scheme should be introduced.30 Processes to ensure
that the data collected can be used for research and statistical purposes should be incorporated into the design and
administration of this system.
Data on the type of private rental disputes provided by First-tier Tribunal (Housing and Property Chamber) provides a
useful indication of the extent of non-compliance with the requirement to protect a deposit. The county courts in
England and Wales and small claims courts in Northern Ireland could also make data available on the type of private
rental dispute at relatively low cost. This could provide some indication of whether non-compliance is widespread.
However, this data must be treated with caution. Particularly in England and Wales where landlords still have the
power to evict a tenant from their home without a reason (“no-fault evictions”) many tenants are likely to be unwilling
to approach the courts due to fear of retaliatory eviction.
Whilst local authorities can in principle approach the deposit protection schemes for data relating to their local area,
this only works if data from all three schemes can be easily accessed. The deposit protection schemes may wish to
explore the potential of providing aggregate data to local authorities on a finer geographical level. An initial
consultation between the three schemes may be necessary to explore ways in which this data can be shared in a
form that is low cost and easily accessible.
29
Livingston, Berry, Gibb, and Bailey, Private Renting Reforms.
30
Harris, Cowan, Marsh, Improving Compliance
14housingevidence.ac.uk
Due to the data limitations outlined within this paper it is currently not possible to estimate the full extent of non-
compliance with the requirements to protect deposits. Unless better data is made available, it will not be possible to
gain a full understanding of landlord behaviour and the effectiveness of different legislative requirements. However,
available data does indicate that a potentially significant proportion of landlords are not compliant with the
requirement to protect deposits. A recent report by CaCHE outlines key changes that need to be made to improve
compliance with the legislation governing the private rented sector.31 The main recommendations which are also
applicable to this context include:
l Local authorities should provide a wider range of activities to improve landlord knowledge and awareness about
their rights and responsibility by providing a range of compliance-focused activities which are provided
systematically, regularly and targeting the sector at large. Examples of these activities include: online information,
dedicated advisory services, regular newsletters, forums, landlord days and free training.
l UK and devolved governments should improve the data available to local authorities on the PRS. In England, a
national registration system of all landlords and letting agents should be introduced. National schemes of
registration or licensing should have clear aims and purpose.
l When formulating their strategy, local authorities should adopt an overarching goal, clear aims and objectives, and
an explicit definition of the problem they are aiming to address. The specific focus of their strategy should be
evidence-informed which may include collecting data on the extent of compliance with deposit protection
requirements in their local area.
31
For further information on how to improve compliance with PRS legislation see Harris, J., Cowan, D. and Marsh, A. (2020) Improving Compliance with PRS
Legislation
15You can also read